0539
Increasing-load leg extensions in supine position using a novel pneumatic ergometer for dynamic 1H and 31P NMR muscle evaluations at 3T1NMR Laboratory, Neuromuscular Investigation Center, Institute of Myology, Paris, France, 2NMR Laboratory, CEA/DRF/IBFJ/MIRCen, Paris, France, 3University Paris-Saclay, CEA/DRF/SHFJ, Orsay, France
Synopsis
Evaluating quadriceps function is key in the context of sarcopenia. A pneumatic ergometer was built to allow performing knee extensions in supine position. An increasing-load, 13-min-long, isotonic exercise was successfully performed by volunteers during interleaved 1H MRI/1H MRS/31P MRS acquisitions in the quadriceps. Work, pedal displacement and velocity values per stroke and the maximum voluntary torque were measured with the ergometer. End-of-exercise [PCr] decreased (69±10%) and T2* increased (up to 10.5±7.2% in Rectus Femoris) relative to baseline. Simultaneous vascular, metabolic and physical effort evaluations during an incremental physical test could be a powerful method to investigate muscle quality in aging.
INTRODUCTION
Functional NMR examinations in the muscle allow investigating the physiological response to a transient stress, such as an exercise bout. The characteristics of the physical effort have a direct impact on muscle fatigue and the hemodynamic and metabolic response. Furthermore, quantifying the exercise performance provides relevant complementary information for energy metabolism studies. Quadriceps function is important to evaluate in the context of aging as a risk factor for disability1,2. Here, we developed a pneumatic ergometer to perform knee extensions in supine position within the scanner bore and validated a normalized increasing-load exercise in healthy subjects using interleaved 1H/31P multi-nuclear dynamic acquisitions.METHODS
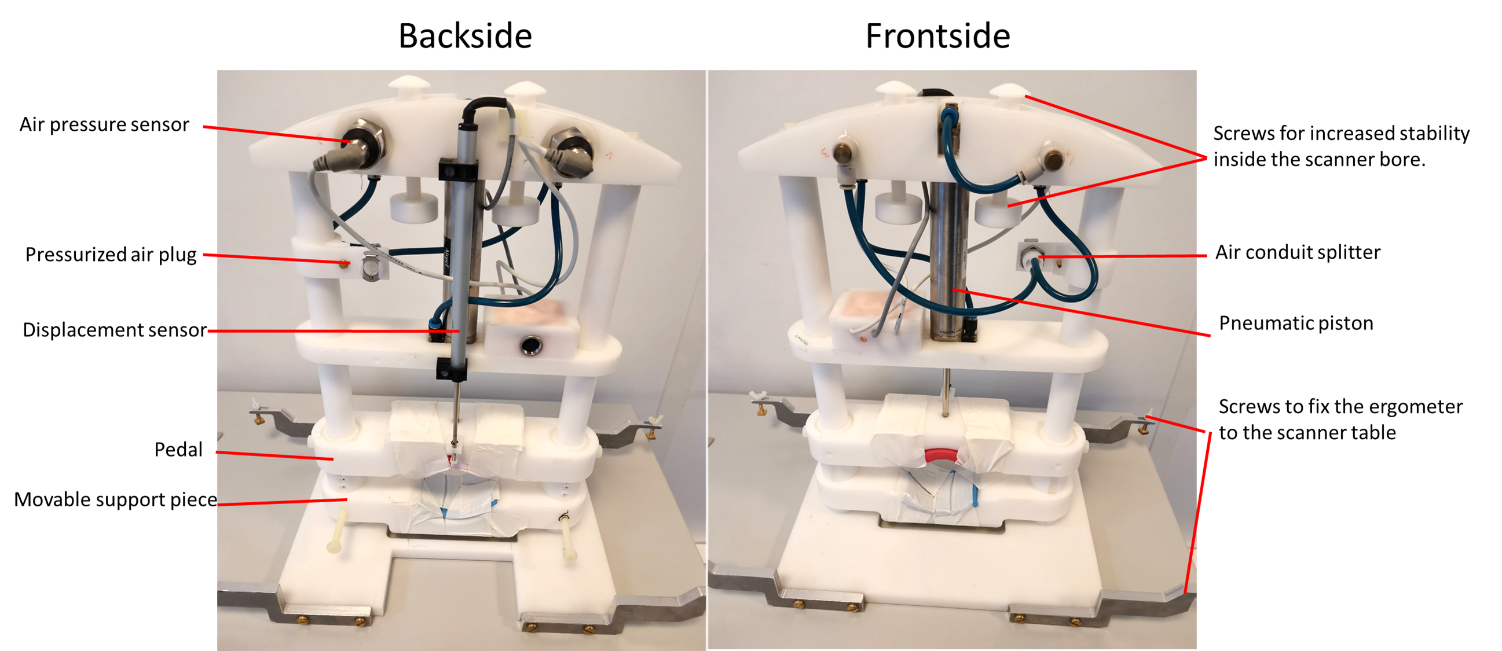
Ergometer. A pneumatic ergometer was built in-house using a single piston (M24D125.0N Airpel) and polyoxymethylene pieces, closely fitting the scanner bore dimensions (figure 1). The maximum movement range was 6.8 cm. The ergometer was connected to an air pressure control unit placed outside the scanner. The air pressure inside the piston chambers was controlled using LabView (National Instruments). With a maximum air pressure difference of 6.7 bar, a load of up to 303 N could be achieved. The effective air pressure in the piston and the pedal position were monitored using dedicated sensors (figure 1). This information was processed in real time in LabView to calculate the torque, work, displacement and velocity values per stroke.NMR equipment. Experiments were done at 3T (Siemens Prisma) with a dual-tuned 1H/31P flex coil (RAPID Biomedical), wrapped around the thigh and facing the rectus femoris.
Subject positioning. Volunteers (38±12 y.o., 2 men, 4 women) laid supine on the scanner bed, with a short inclined support placed under the thigh and the ergometer pedal positioned proximal to the ankle.
Exercise paradigm. Leg extensions were performed every 2.5 s for 13 min, increasing the load every minute from 5% to 25% of the maximum voluntary torque (MVT, measured using the ergometer). Dynamic NMR acquisitions lasted 25 min, starting 2 min before exercise onset.
Dynamic NMR. An interleaved 1H/31P pulse sequence (figure 2A) consecutively acquired, every 2.5s, a 31P spectrum (pulse-acquire), a 1H spectrum for the detection of desaturated myoglobin (pulse acquire, 32 averages, 79 ppm carrier frequency), an anatomical Golden-Angle radial FLASH image (1.3x1.3 mm² resolution) and multi-echo T2*-weighted images (6 echoes, 2.6x2.6 mm² resolution).
Data Analysis. Data was processed using Matlab. 1H dMb spectra were averaged before processing. Zero- and first-order phase corrections were applied to the dynamic 1H and 31P spectra. The rephosphorylation rate of PCr (τPCr) was estimated with an exponential function during exercise recovery. Metabolite and pH quantification was done as described elsewhere3,4. Images were reconstructed using a non-uniform FFT algorithm5. No motion correction was applied. Regions-of-interest (ROI) were drawn based on the anatomical images (figure 2B) at rest and during recovery. T2* values were calculated for each ROI assuming an exponential decay. Statistical differences were evaluated using paired t-tests.
RESULTS
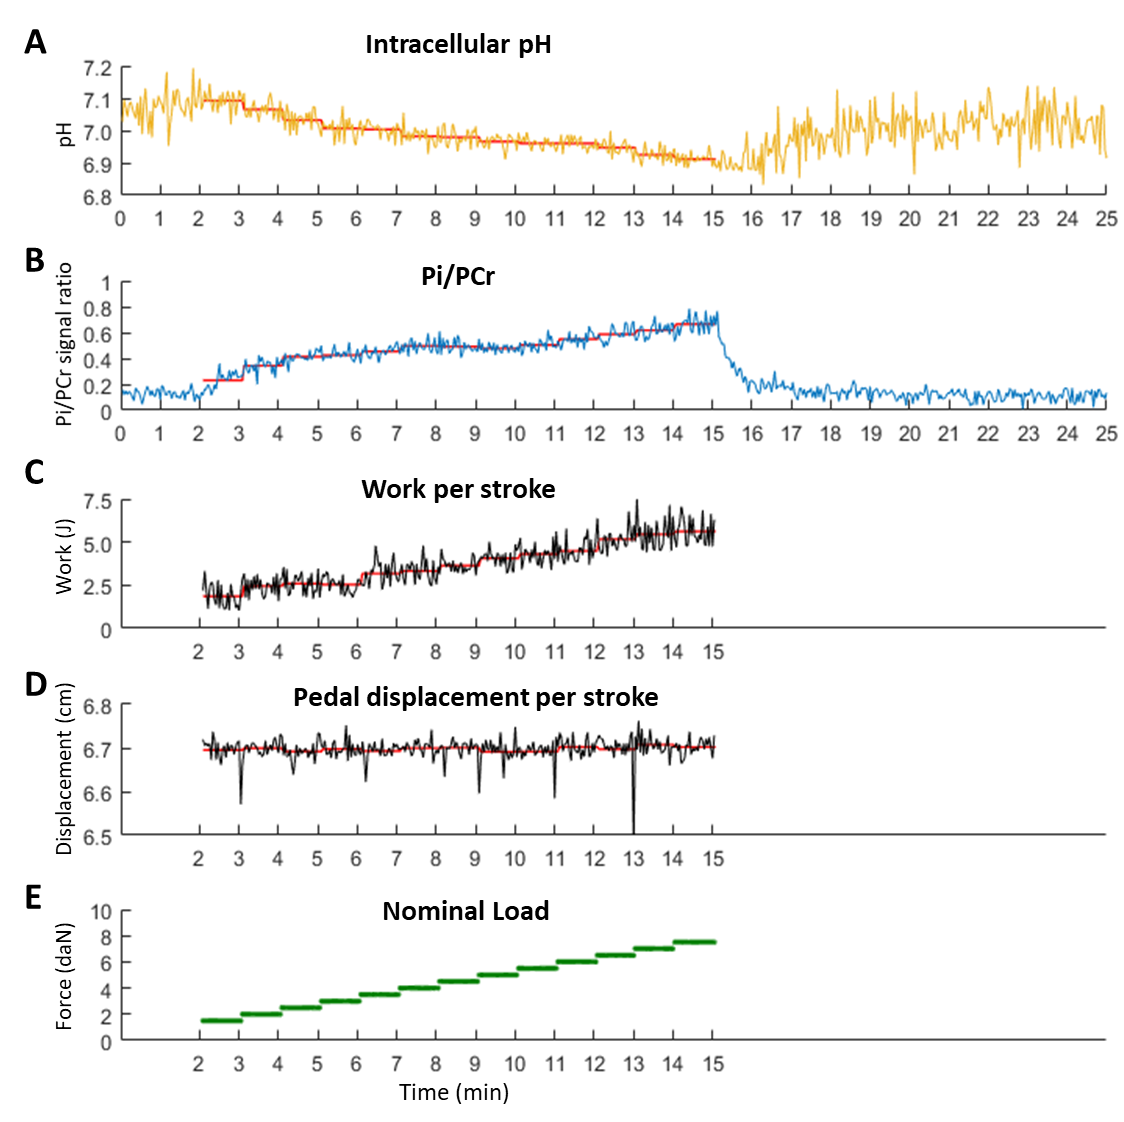
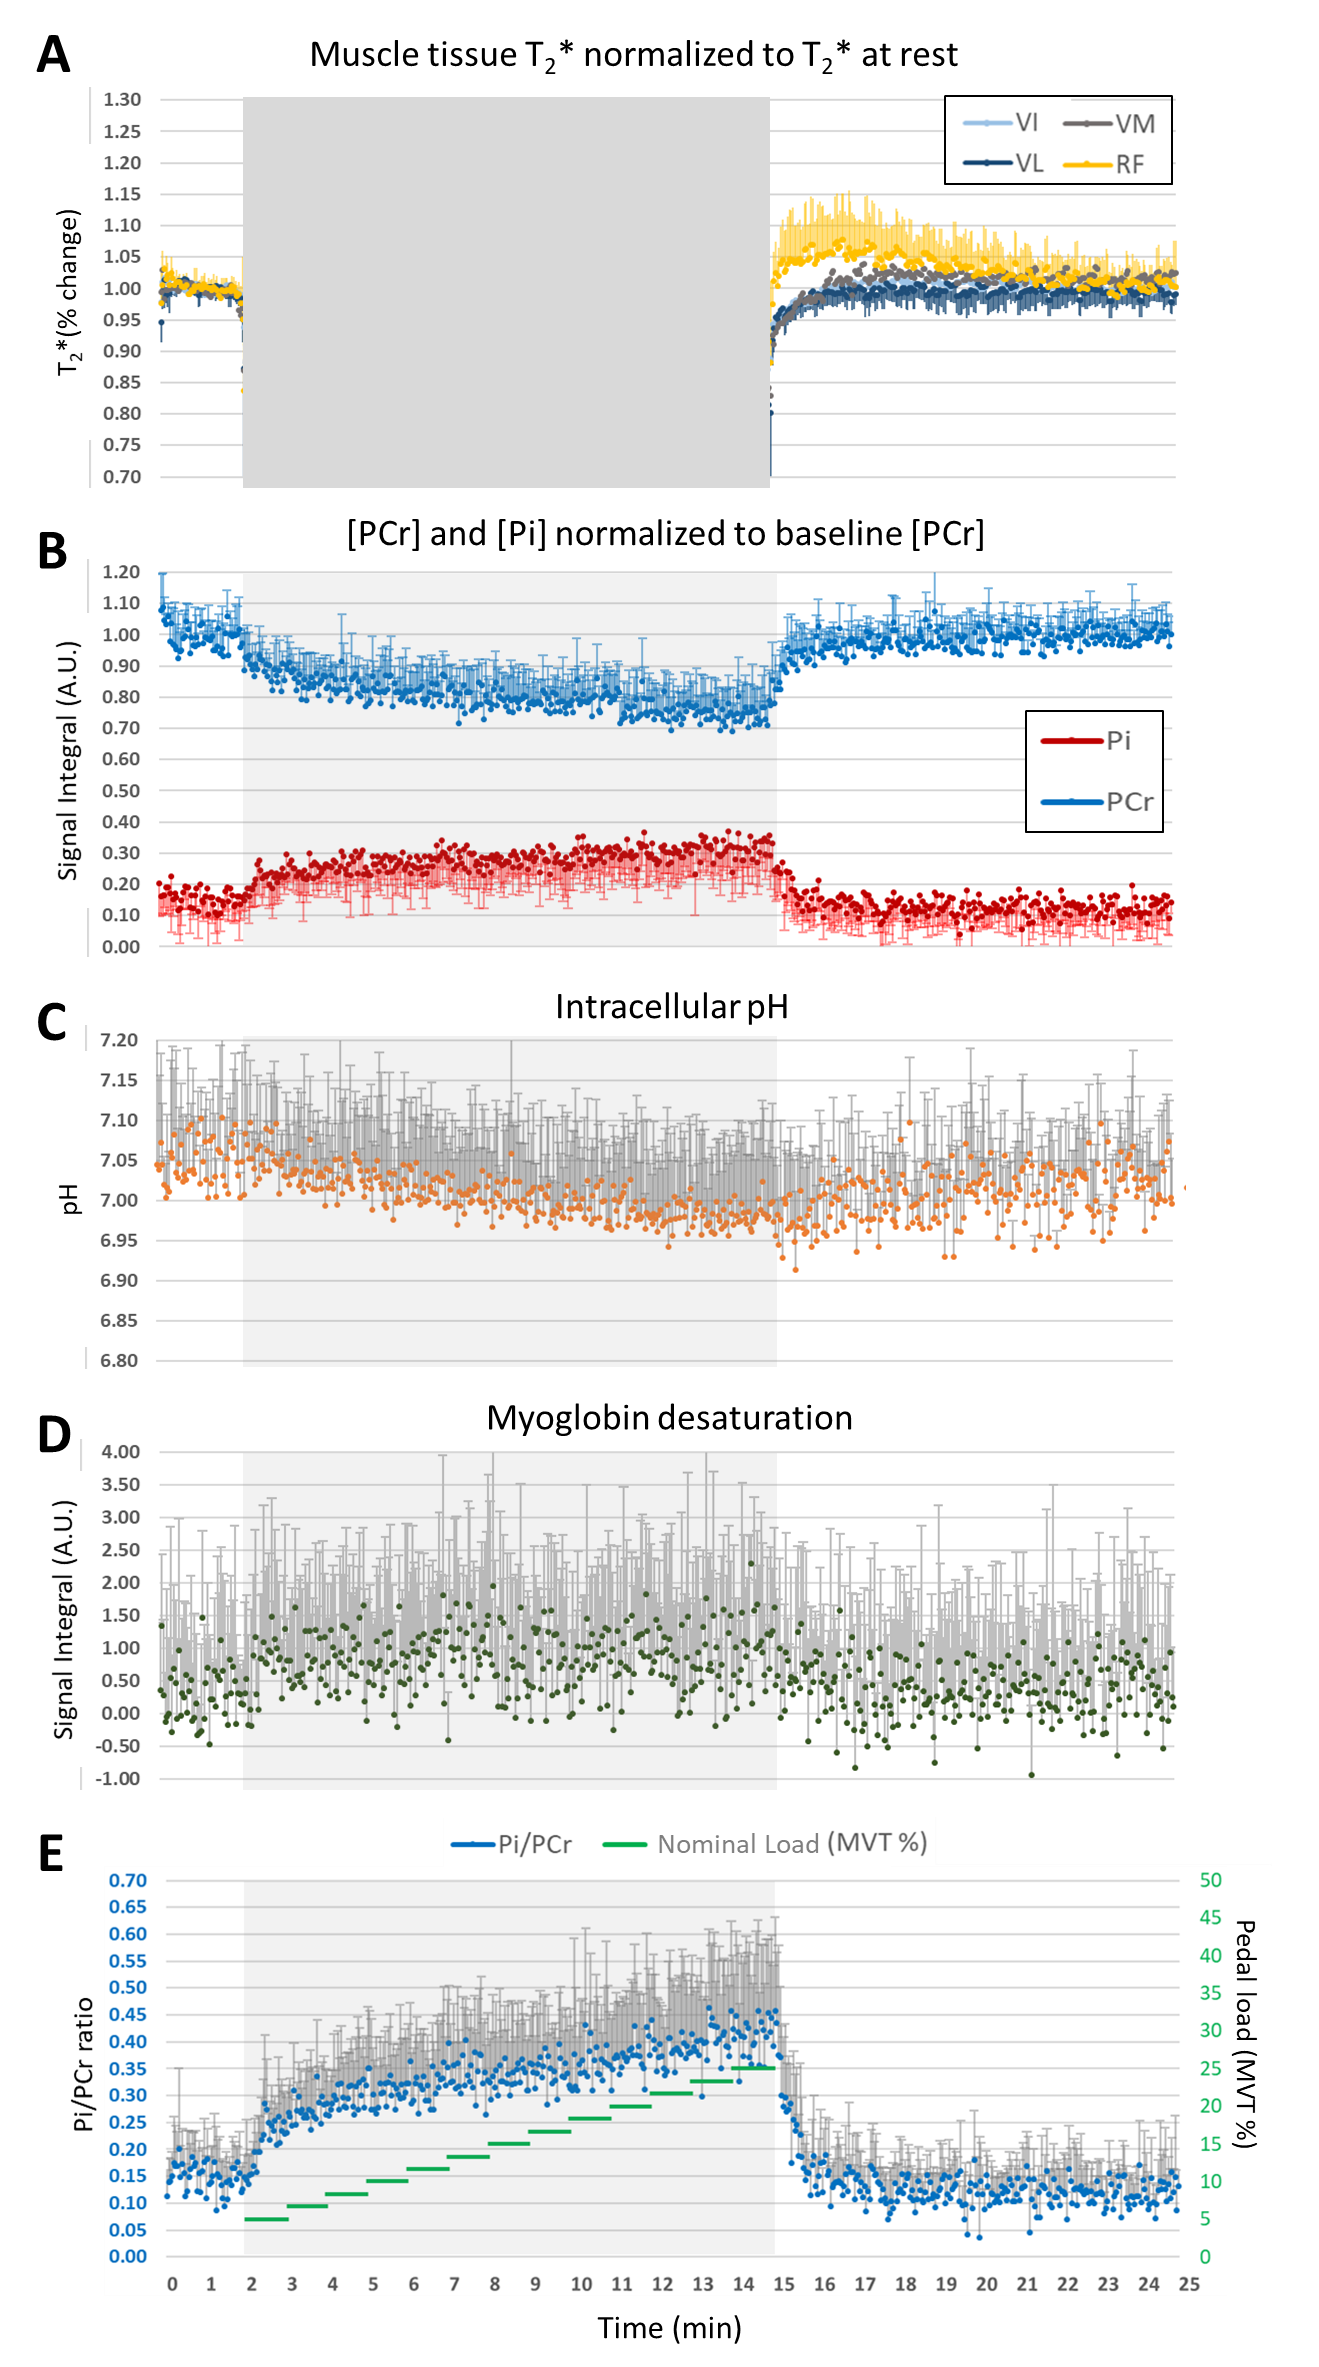
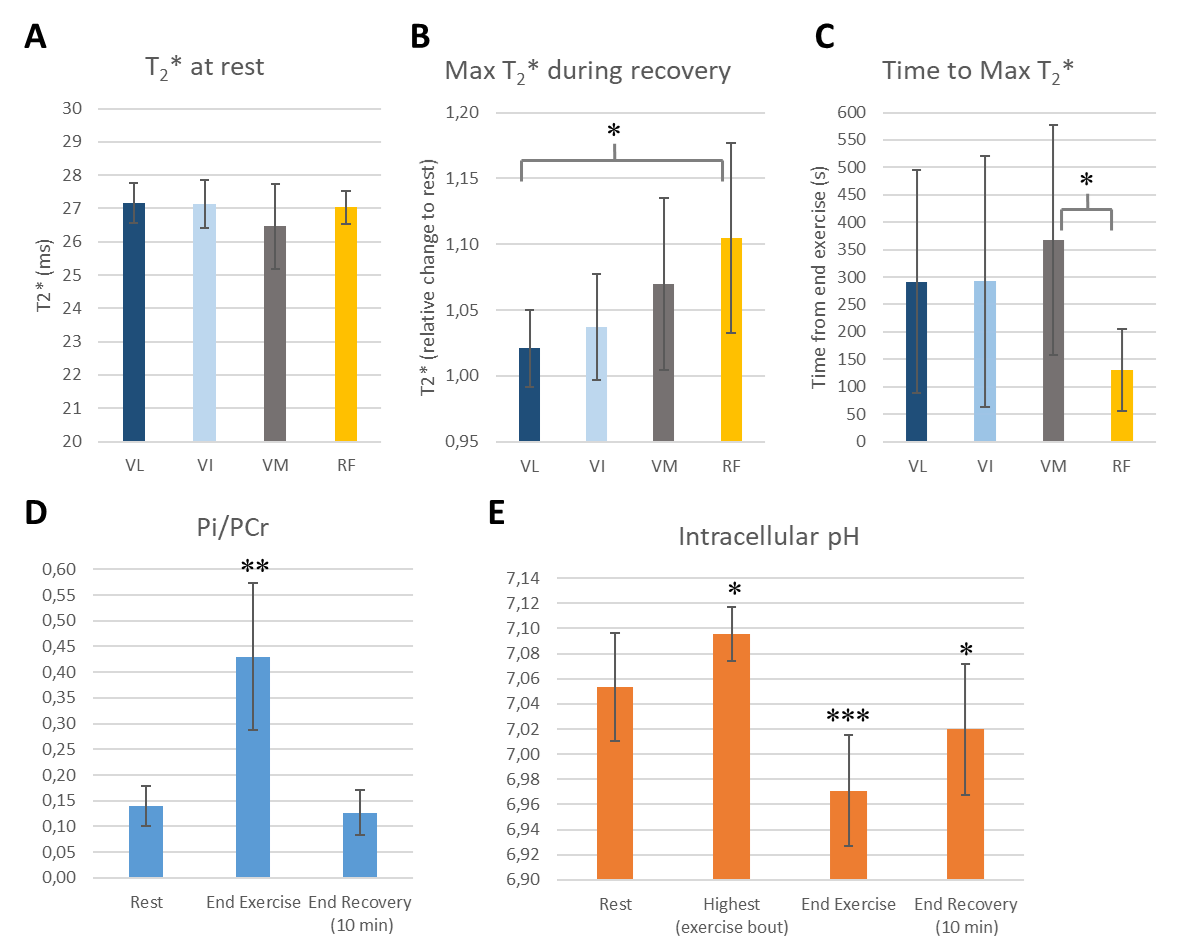
Figure 3 shows the measured pH, Pi/PCr, performed work, pedal displacement and ergometer’s nominal load for one subject. All subjects successfully performed the exercise at the demanded frequency and for the full range of motion. Figure 4 shows the time series of muscle-specific T2*; intracellular pH; and PCr, Pi and dMb signal integrals. The Pi/PCr ratio and exercise nominal loads are also shown (figure 4E). A progressive decrease of pH and PCr during exercise was observed while Pi and Pi/PCr increased. A more important T2* response was observed in the rectus femoris than in the other muscles. End-of-exercise PCr was 69±10% of PCr at baseline and τPCr was 38.0±16.0 s. Figure 5 summarizes the main extracted parameters, averaged over all subjects. The rectus femoris presented a higher increase in T2* (relative to baseline) than VL (p=0.036) and shorter time to peak T2* than VM (p=0.039). After 10 min of recovery, Pi/PCr had returned to baseline level (p=0.39) but pH had not fully recovered (p=0.014).DISCUSSION AND CONCLUSION
The presented ergometer allowed performing a MVT measurement and a 13 min-long exercise with increasing load without patient discomfort. It allows performing the exercise in supine position, which is beneficial for patient comfort and long exams, and could also be used for knee flexion exercise. Ergometers allowing to change resistances and monitor pedal displacement during knee extensions in supine position are scarce6. Contrary to Jaber et al., our design is less constrained in the placement of the supporting hardware (pressure control unit, air compressor) but the use of long air tubes and the high compressibility of air delays the ergometer response time. We chose an intermittent isotonic exercise to limit the possible blood flow hindrances occurring during extended contraction periods (as in isometric exercises). This could explain the minor desaturation of myoglobin observed here, contrary to previous studies where voluntary (10% to 50 % MVC) or electrically-stimulated isometric contractions were used7,8. The quadriceps muscle weakness is a risk factor for falls and disability and muscle quality decline precedes muscle loss in aging and sarcopenia1,2,9,10. Simultaneous evaluations of the energy metabolism, vascular response and physical effort during an incremental exercise paradigm could be a powerful method to assess ATP contraction costs11,12 and investigate quadriceps muscle quality in the elderly9,10.Acknowledgements
No acknowledgement found.References
1. Caetano et al. Gait Posture. 2018. 59:188-192.
2. Ahmadiahangar et al. Chiropar Man Therap. 2018. 26 :31.
3. Moon & Richards. J Biol Chem. 1973; 248: 7276-7278.
4. Lopez Kolkovsky et al., MRM. 2021; 86(1):115-130.
5. Fessler, JA & Sutton BP. IEEE Trans on Signal Processing. 2003; 51(2):560-574.
6. Jaber et al. J Biomech Eng. 2020; 142(9):095001
7. Lopez Kolkovsky et al., ISMRM. 2017; pg. 91.
8. Vanderthommen et al.J App Physiol(1985). 2003. 94(3):1012-1024
9. Cruz-Jentoft et al., Age Ageing. 2019. 48(1):16-31.
10. McGregor et al. Longev Healthspan. 2014. 3 :9.
11. Conley et al. J Physiol. 1998. 511 :935-945.
12. Layec et al. Clin Sci. 2014. 126(8) :581-592.
Figures
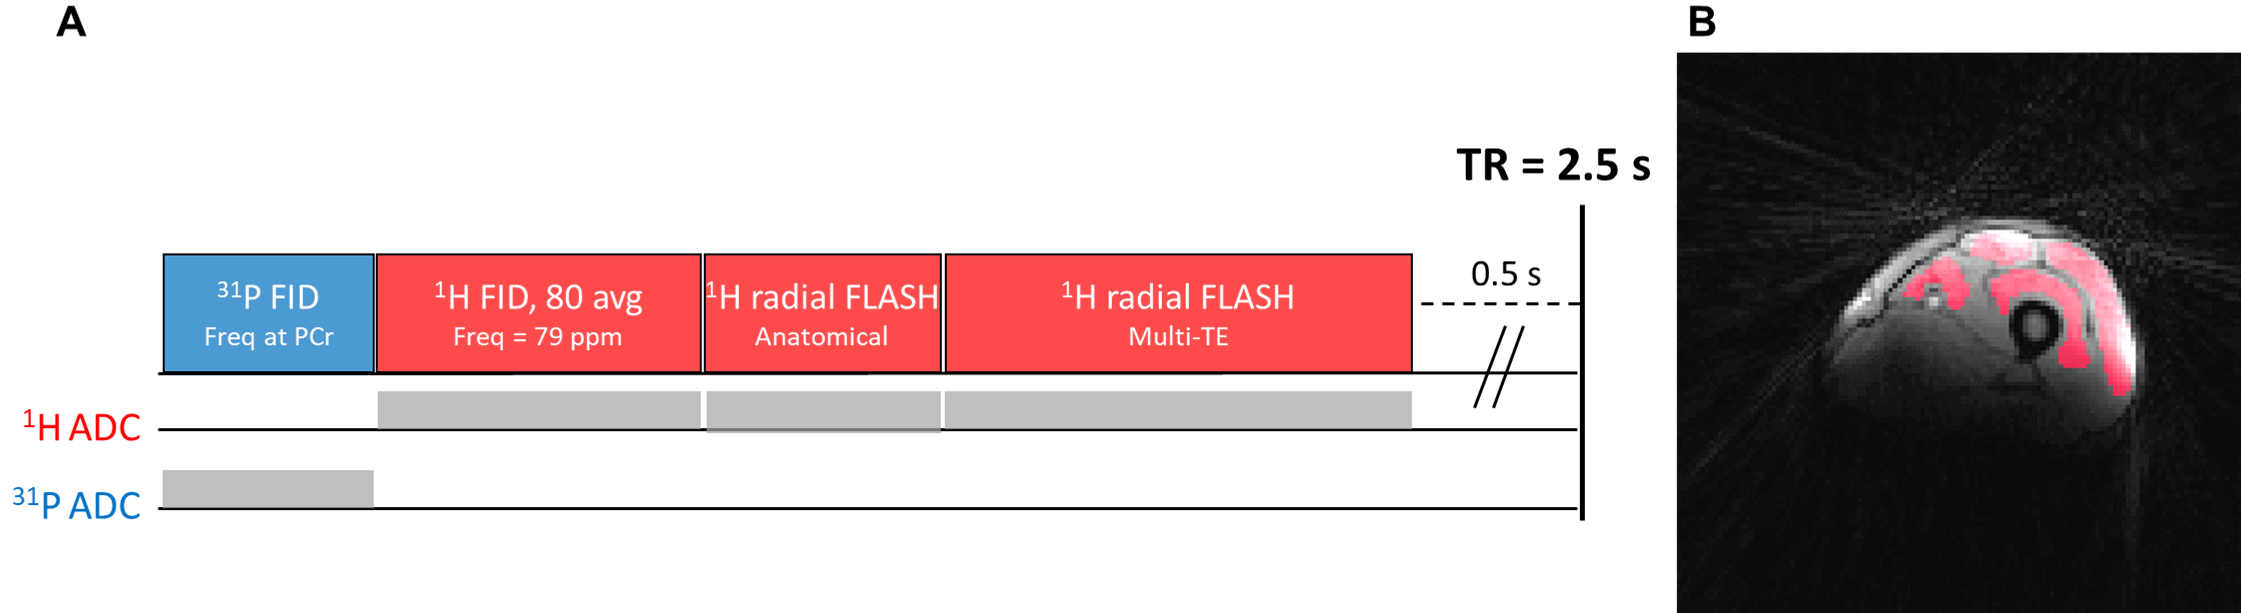
A) Interleaved pulse sequence diagram. Acquisition parameters: TR= 2.5 s, 31P MRS: Pulse-acquire (FID), 1024 points, 4 kHz BW; 1H MRS: Pulse-acquire (FID), 32 averages, 256 points, 20 kHz BW, -75 ppm shift); 1H MRI: Golden-angle radial FLASH, 9 mm slice thickness. Anatomical MRI: TE=2.59 ms, 1.3x1.3 mm² resolution, 128 points, 64 spokes; T2*-weighted MRI: TE:1.72/6.72/11.72/16.72/21.72/26.72 ms, 2.6x2.6 mm² resolution, 64 points, 32 spokes per TE.
B) Example anatomical image during rest with superposed ROIs (red) used for VL, VI, VM and RF.