0538
Three dimensional multi-parameter quantification of inter-vertebral discs using magnetic resonance fingerprinting1Center for Biomedical Imaging, Grossman school of Medicine, NYU Langone Health, New York, NY, United States
Synopsis
Low back pain that have etiologies related to degenerative intervertebral(IVD) disc changes are difficult to diagnose and treat. Quantitative characterization of the lumbar spine IVD can potentially be useful in detecting early changes to the IVD. In this study a 3D-MR fingerprinting technique was employed that is capable of simultaneously quantifying four different parameters in a clinically feasible time. Five healthy subjects underwent lumbar spine 3D-MRF scans. The results demonstrate that 3D-MRF can simultaneously measure and generate T1, T2, T1ρ, and B1+ volumetric maps of lumbar spine in a single scan within clinically feasible scan time of about 10 minutes.
PURPOSE
Discogenic back pain is commonly occurring pathology, is hard to treat, and a major cause is degenerative changes to the inter-vertebral disc (IVD)[1]. It is critical to be able to characterize the IVD quantitatively, and identify early degenerative changes to the IVD. The goal of this study was to apply multi-parameter 3D-MRF mapping to characterize lumbar spine IVD in a clinically feasible time.METHODS
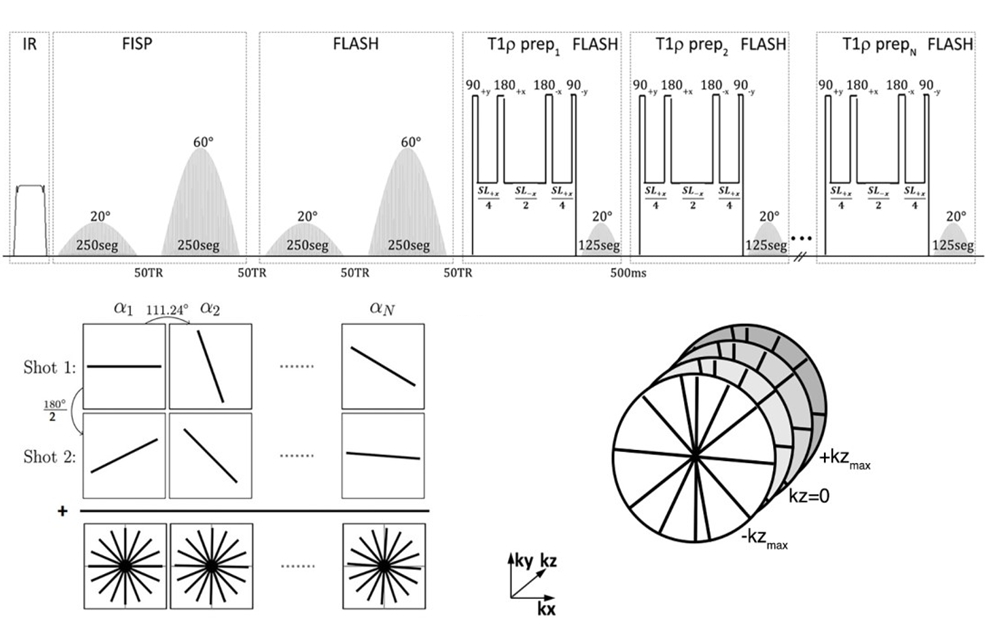
A 3D implementation of the MRF sequence is shown in figure 1[2-4]. An adiabatic inversion pulse is followed by two FISP segments that encode for T1/T2, where each FISP segment consists of 250 RF excitations and two FLASH segments that encode for T1/B1. The flip angles (FA) for the FISP and FLASH segments vary from 0° to 20°, and from 0° to 60° for the first and second segments, respectively. This is followed by a T1ρ preparation module followed by 125 RF excitations for each spin lock pulse, with FA’s ranging from 0° to 20°. This implementation used 6 spin lock pulses at TSL=2, 4, 7, 13, 25, 45 ms. Golden angle radial readouts following each RF excitation was used with centric out readout in the kz dimension.To increase SNR and k-space coverage, additional shots (n shots) were acquired by adding an offset angle (180°/n) at the beginning of each train. The 3D-MRF imaging sequence for 10 sagittal slices with 1 shot took 2.5 minutes, 2 shots took 5 min, 4 shots took 10 minutes. The common MR acquisition parameters included: FOV = 240mm, orientation = sagittal, in-plane voxel resolution = 0.7x0.7 mm2, 4 mm through plane slice thickness, TR = 7.5ms, TE = 3.5 ms, bandwidth = 500Hz/pixel, frequency of spin lock = 500 Hz.
Extended phase graph[5] simulations were performed to compute a dictionary of simulated MR fingerprints with a range of 50-3000 ms, T2 range of 2-200 ms, and a T1ρ range of 2-200 ms in steps of 6%. SVD compression was used to speed up the reconstruction[6], which was performed offline. An iterative dictionary pattern matching algorithm was used to produce quantitative maps of proton density, T1, T2, T1ρ and B1.
Five healthy volunteers (3 females, 2 males, age = 39 ± 13) with no history of back pain were recruited following written informed consent. The imaging protocol consisted of 3D-MRF imaging of the lumbar spine IVD segments L1/L2 to L5/S1. For the first subject, imaging was performed at multiple shots (1-, 2- and 4-shots) to determine the optimal number of shots at the given voxel resolution.
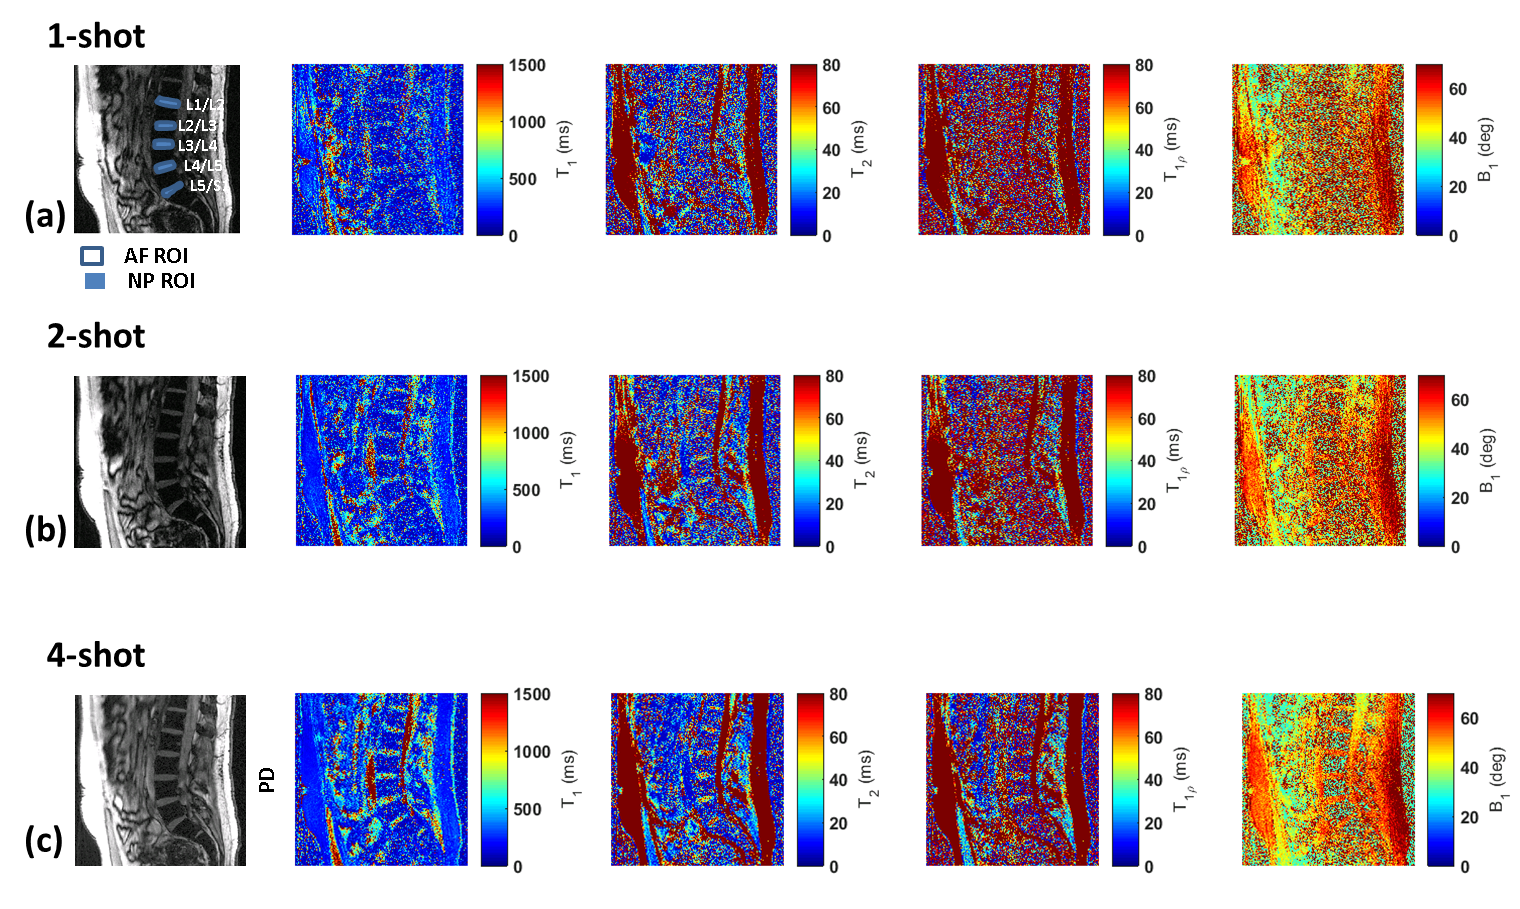
The raw data was imported to MATLAB (Mathworks, Natick, MA) running on a cluster. The iterative dictionary matching was used to generate quantitative multi-parameter maps. Typical ROI locations used for L1/L2 through to L5/S1 are highlighted in Figure 2(a). For each lumbar IVD disc from L1/L2 to L5/S1, two concentric ROIs were drawn, the outer ROI for the Anulus fibrosus(AF), and an inner ROI for Nucleus pulposus (NP), as shown in figure 2(a). Encoding multiple parameters into a single imaging sequence gains advantages in time efficiency and ensures that all individual parameters are co-registered by design, thus eliminating errors resulting from running multiple mapping sequences and co-registering them off-line.
RESULTS
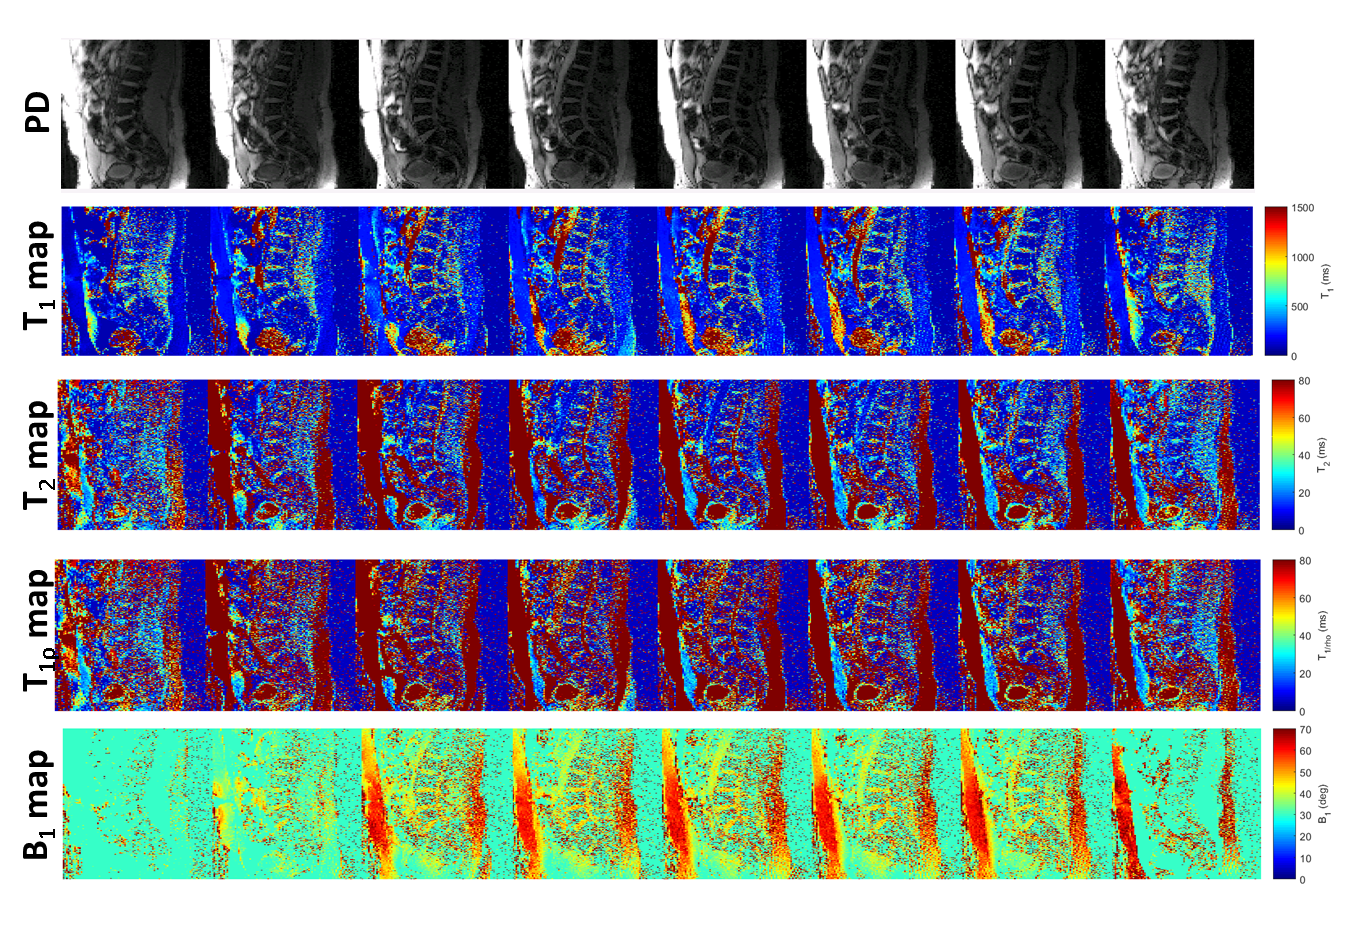
The comparison of results obtained from 1-, 2- and 4-shots is shown in figure 2. For 1-shot and 2-shot data, the lower SNR and quantification errors necessitated the use of 4-shot data for better fidelity and more accurate quantification in a clinically feasible time. The rest of the cohort in the study underwent imaging with 4-shot 3D-MRF acquisition.Figure 3 highlights the volumetric, multi-parameter capability of the 3D-MRF technique. The top row shows PD images, the second row shows volumetric T1-maps, the third row shows volumetric T2-maps, the 4th row shows volumetric T1ρ maps, and the last row shows volumetric B1 maps computed from the dictionary matching process.
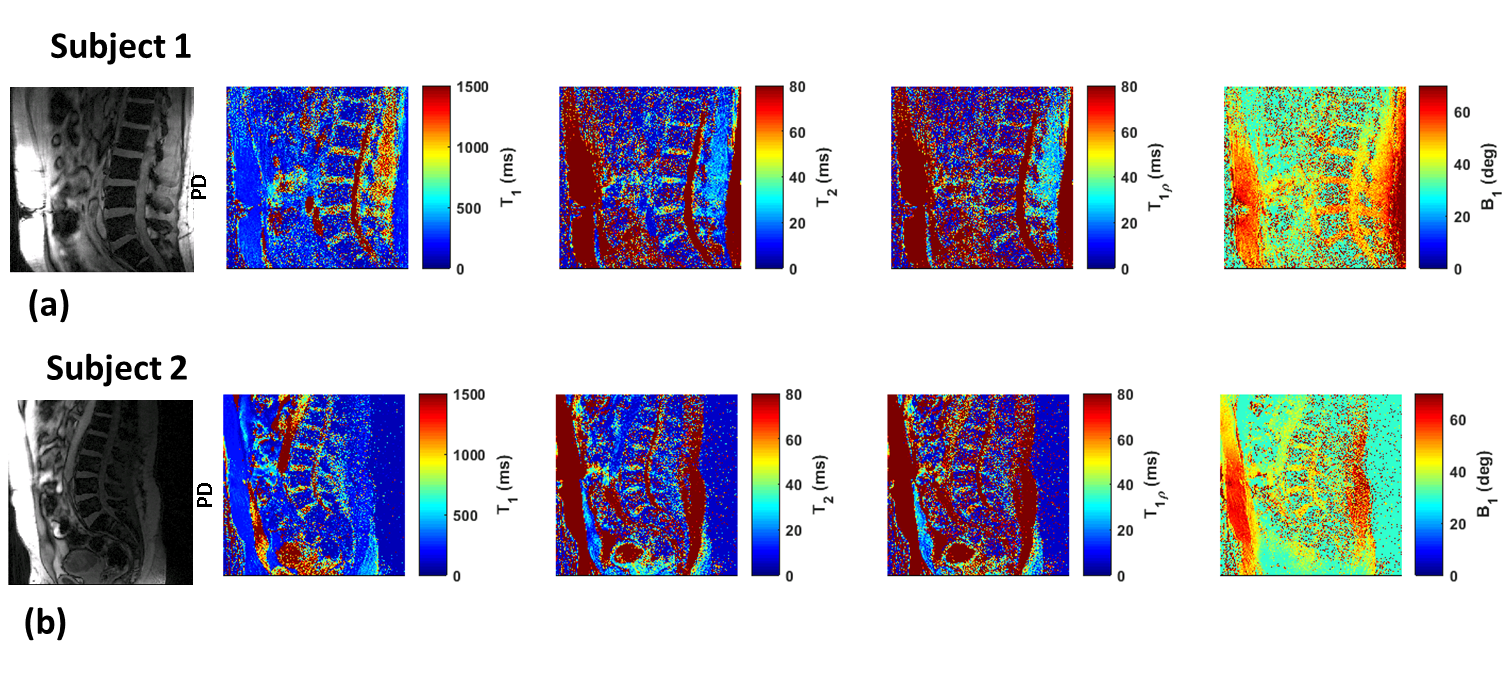
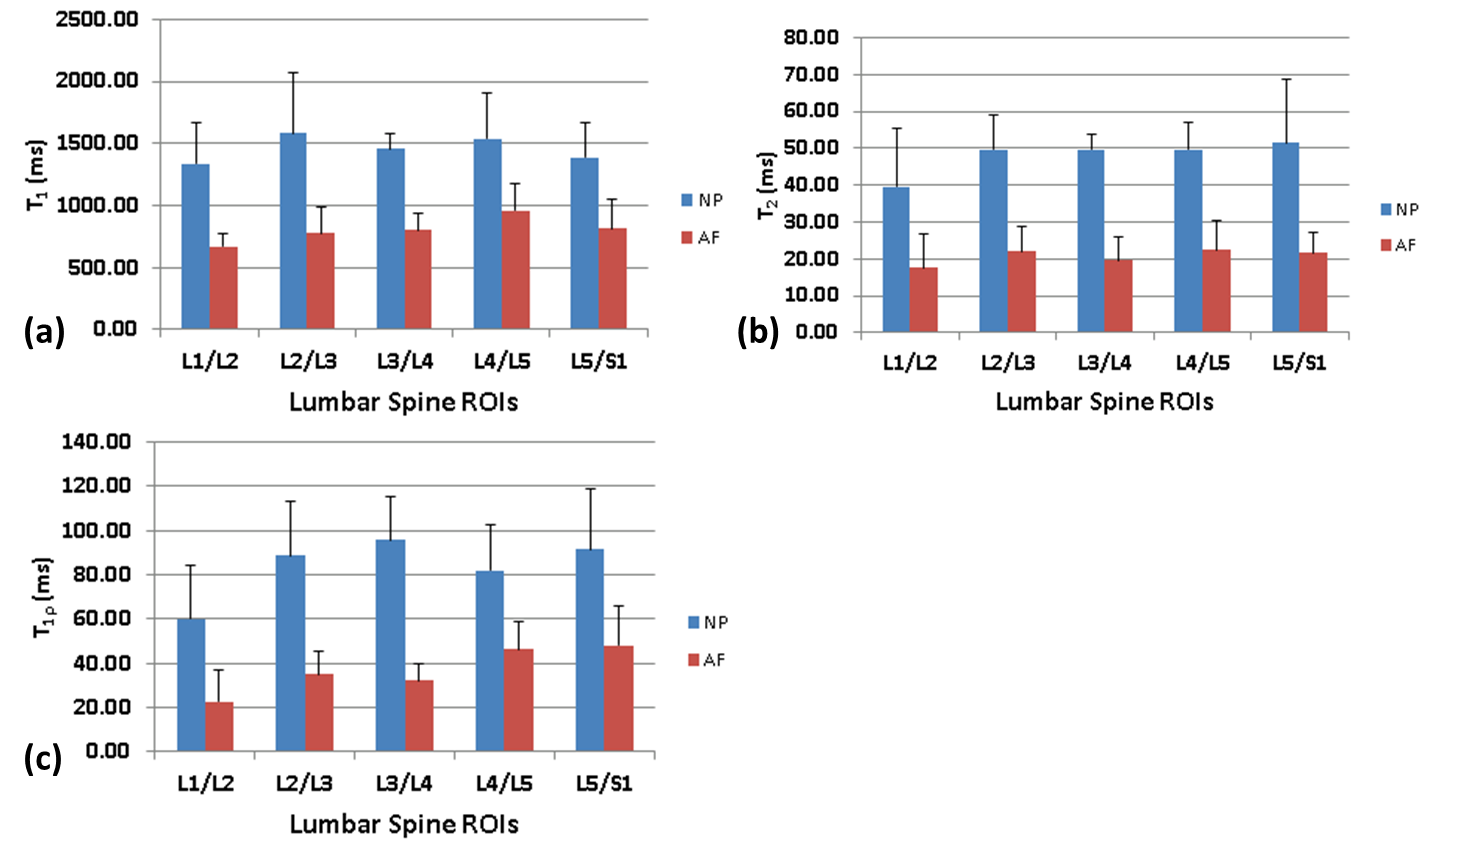
Exemplary high-resolution, multi-parameter data from two subjects are shown in figure 4. In Figure 5(a), the mean T1 values computed for each IVD segment in the NP and AF ROIs are shown for the study cohort (N=5), with the error bars representing the standard deviation observed in the cohort. Figure 5(b) shows the mean T2 values for each IVD segment in the NP and AF ROIs and similarly figure 5(c) shows the mean T1ρ values computed for each lumbar IVD segment in the NP and AF ROIs. Significant differences in T1, T2, and T1ρ values are seen between the outer AF and the inner NP ROIs, which are in agreement with literature[7].
DISCUSSION AND CONCLUSION
The proposed 3D-MRF sequence is rapid, robust to B1+ inhomogeneity, and can simultaneously measure T1, T2, T1ρ, and B1+ volumetric maps of lumbar spine in a single scan within clinically feasible scan times (~10 minutes).Acknowledgements
This study was supported by NIH grants R21-AR075259-01A, R01 AR076328, R01 AR076985, and R01 AR068966, and was performed under the rubric of the Center of Advanced Imaging Innovation and Research (CAI2R) at the Grossman School of Medicine and NIBIB Biomedical Technology Resource Center (NIH P41 EB017183).References
1. Fujii K, Yamazaki M, Kang JD, et al. Discogenic Back Pain: Literature Review of Definition, Diagnosis, and Treatment. JBMR Plus. 2019;3(5):e10180.
2. Cloos MA, Asslander J, Abbas B, et al. Rapid Radial T1 and T2 Mapping of the Hip Articular Cartilage With Magnetic Resonance Fingerprinting. J Magn Reson Imaging. 2019;50(3):810-815.
3. Sharafi A, Zibetti MVW, Chang G, Cloos M, Regatte RR. MR fingerprinting for rapid simultaneous T1 , T2 , and T1 rho relaxation mapping of the human articular cartilage at 3T. Magn Reson Med. 2020;84(5):2636-2644.
4. Sharafi A, Medina K, Zibetti MWV, et al. Simultaneous T1 , T2 , and T1rho relaxation mapping of the lower leg muscle with MR fingerprinting. Magn Reson Med. 2021;86(1):372-381.
5. Weigel M. Extended phase graphs: dephasing, RF pulses, and echoes - pure and simple. J Magn Reson Imaging. 2015;41(2):266-295.
6. McGivney DF, Pierre E, Ma D, et al. SVD Compression for Magnetic Resonance Fingerprinting in the Time Domain. Ieee Transactions on Medical Imaging. 2014;33(12):2311-2322.
7. Pandit P, Talbott JF, Pedoia V, Dillon W, Majumdar S. T1rho and T2 -based characterization of regional variations in intervertebral discs to detect early degenerative changes. J Orthop Res. 2016;34(8):1373-1381.
Figures