0535
3D-MR-Fingerprinting for Rapid Simultaneous T1, T2, and T1ρ Volumetric Mapping of the Human Articular Cartilage at 3T
Azadeh Sharafi1, Marcelo V. W. Zibetti1, Gregory Chang1, Martijn Cloos 2, and Ravinder Regatte1
1Radiology, NYU Langone Health, New York, NY, United States, 2University of Queensland, Brisbane, Brisbane, Australia
1Radiology, NYU Langone Health, New York, NY, United States, 2University of Queensland, Brisbane, Brisbane, Australia
Synopsis
Conventional quantitative cartilage MRI (e.g., T1, T2, and T1ρ) approaches measure one single parameter at a time. Magnetic resonance fingerprinting (MRF) is a flexible, non-invasive measurement technique that simultaneously quantifies multiple MR parameters. In this work, we proposed a 3D-MRF sequence for the simultaneous volumetric acquisition of submillimetric proton density (PD) image and T1, T2, T1ρ, and B1+ maps of the knee cartilage in clinically feasible scan time (~11 minutes).
Purpose
To implement a 3D-magnetic resonance fingerprinting (3D-MRF) technique for concurrent volumetric mapping of T1, T2, and T1ρ in the knee articular cartilage.Methods
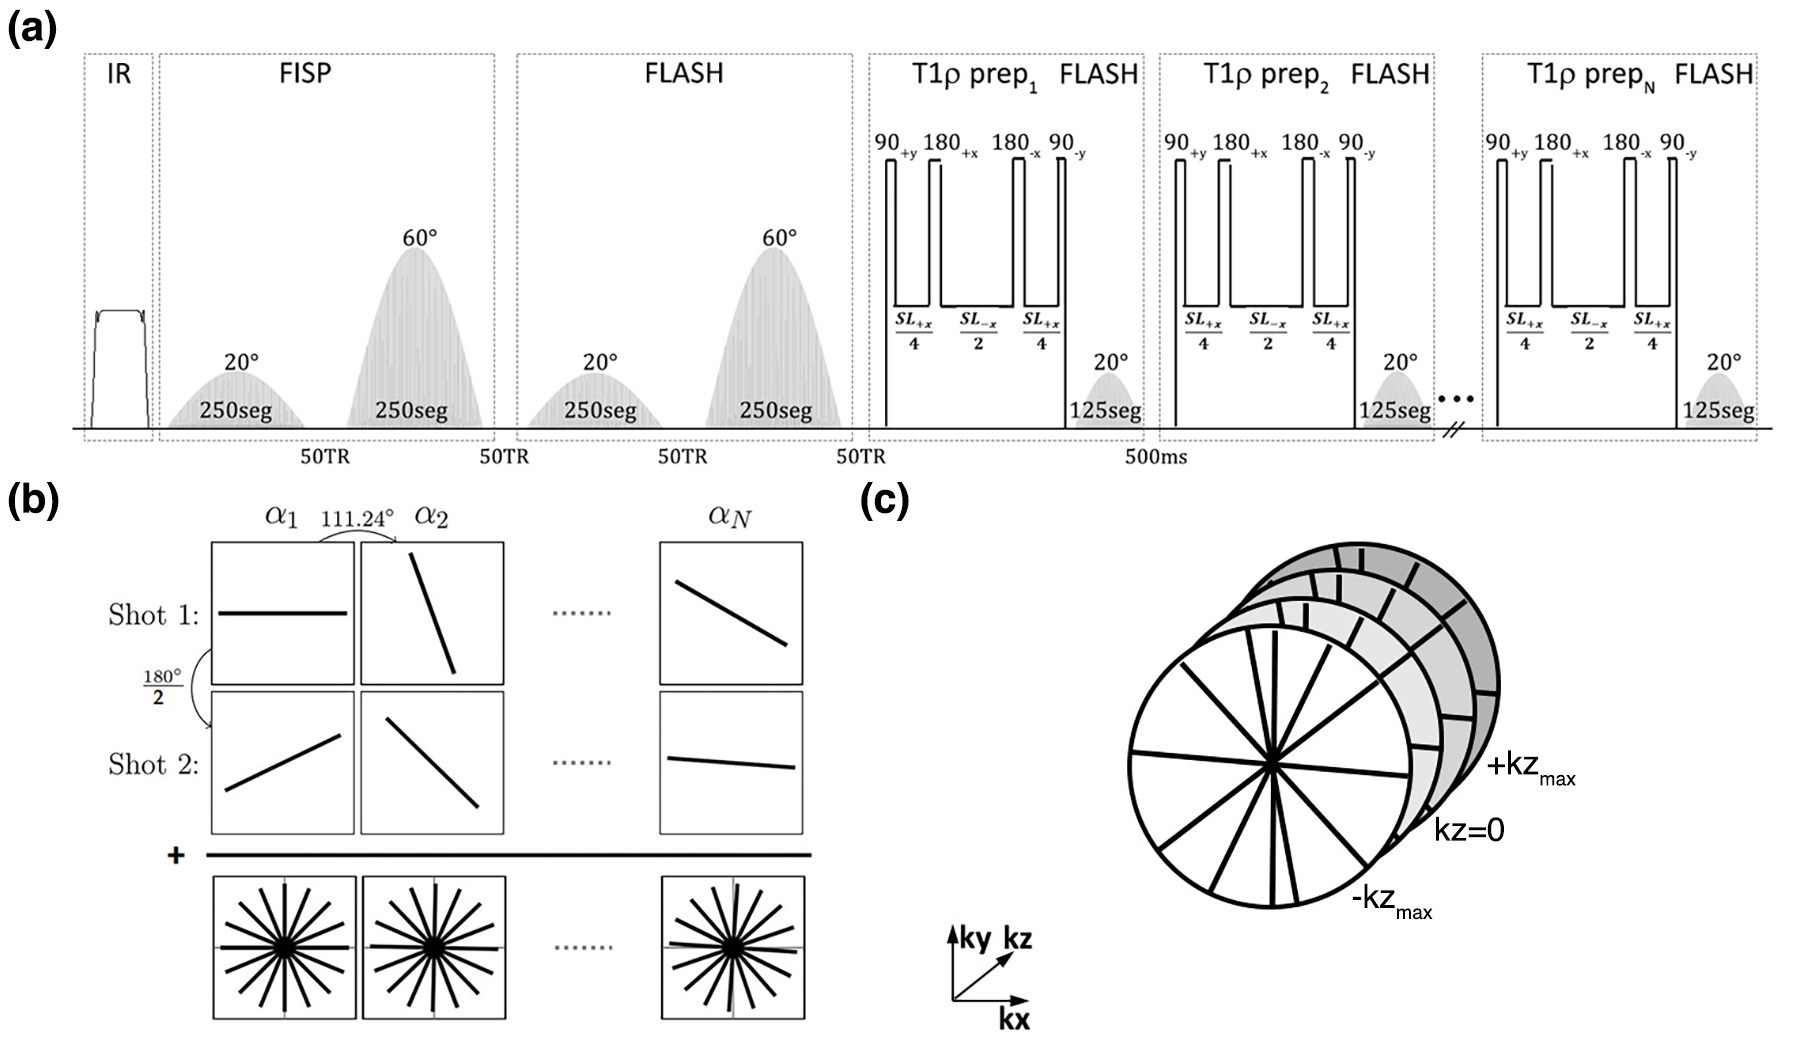
Our 3D-MRF sequence consists of three preparation modules encoding T1, T2, B1+, and T1ρ. Following an adiabatic inversion pulse, two fast imaging with steady‐state precession (FISP) segments consisting of 250 slab-selective variable flip angle excitations encode T1 and T2. Subsequently, two fast low‐angle shot (FLASH) segments seperate T1/ T2 and B1+. The third, and final, part consists of N=6 balanced (1) T1ρ preparation modules with different spin-lock durations (TSL=2, 4, 7, 13, 24, and 45ms) each followed by a FLASH segment with 125 variable FA excitations. A golden angle stack of stars readout (2) was used (Figure 1b) with Cartesian sampling along the partition direction (Figure 1c). A complete FA train consisting of 1750 excitation is called a "shot". 192 radial spokes were acquired per shot. To increase SNR and k-space coverage (3), the whole train was acquired multiple times (n shots) by adding an offset angle (180°/n) at the beginning of each train (Figure 1b).The extended phase graph technique (4) was used to simulate the signal evolutions and create a dictionary containing a wide range of possible T1, T2, T1ρ, and B1+ values. SVD (5) compression was used to speed up the reconstruction, which was performed offline.
We scanned the ISMRM/NIST (6) phantom on a 3T MRI scanner (MAGNETOM Prisma, Siemens Healthcare GmbH, Germany) using an Rx only 20 channel birdcage head coil (Siemens Healthcare) using our proposed 3D-MRF and a customized turbo-flash, T1ρ-TFL (7) sequence. To evaluate the repeatability and reproducibility, the 3D-MRF sequence was repeated on the same scanner and ran on another 3T MRI scanner (MAGNETOM Skyra, Siemens Healthcare GmbH, Germany).
IRB-approved MRF imaging was performed on a healthy volunteer on the same 3T scanner using a 15 channel Tx/Rx knee coil (Quality Electrodynamics [QED], Mayville, OH) with 1, 2, 4 shots. A single shot 3D-MRF sequence was acquired without applying RF excitation pulse (noise scan) to calculate the SNR. Considering the results from multi-shot experiments, n = 2 shots was chosen for the rest of the in-vivo scans in which three subjects (age: 29.7 ± 4.3) were scanned twice in the same session to assess the in-vivo repeatability.
Results
Figure 2a shows representative PD weighted images of the NIST/ISMRM system. Representative T1, T2, T1ρ relaxation time, and ΔB1+ maps are shown in Figure 2b. The estimated relaxation times were compared with the references from ISMR/NIST data sheet and measured by T1ρ-TFL(7) using regression and Bland-Altman plot analysis to select the optimal number of shots. As shown in Figure 3, there is good agreement between 3D MRF and conventional mapping techniques for T1, T2, T1ρ estimation. The experiment result also showed excellent repeatability and reproducibility. Analysis of the Bland-Altman plot (Figure 4) demonstrated an average difference of 25.6 ± 58.6 ms, 1.4 ± 3.6 ms, and 2.3 ± 4.3 ms between two scans from the same 3T scanner (Figure 4a for repeatability), and -25.6 ± 58.6 ms, 2.8 ± 6.4 ms, and 4.4 ± 7.6 ms between the scans acquired on two different 3T scanners for T1, T2, and T1ρ (Figure 4b for reproducibility), respectively. Figure 5 demonstrates an example of in-vivo the 3D and multi-plane PD images (Figure 5a) and T1, T2, T1ρ relaxation time, and ΔB1+ maps in lateral and medial side (Figure 5b). The SNRs were 62.3, 124.3, and 253.1 for 1, 2, and 4 shots. Using the four shots as a reference, the overall estimation error decreased from 7% to 5% for T1, 17% to 11% for T2, and 17% to 9% for T1ρ when acquiring two shots instead of one. Hence, we selected two shots as a good trade-off between scan time and accuracy for the rest of the in-vivo experiments. Representative test-retest knee MRF maps (Figure5b), and Bland-Altman plots show good agreement between two scans (Figure5c). Our in-vivo study showed excellent repeatability with rmsCV less than 1%, 2%, and 1% across cartilage for T1, T2, and T1ρ, respectively.Discussion and Conclusion
The proposed approach enables rapid and reproducible 3D-MRF sequence for the simultaneous volumetric acquisition of the human knee joint's T1, T2, T1ρ, and B1+ maps and PD images. Compared to separate acquisitions, there is no need for an additional co-registration step for voxel-wise mapping using simultaneous measurement, reducing the possible mismatch due to experimental imperfections such as field inhomogeneities.Acknowledgements
This study was supported by NIH grants R21-AR075259-01A, R01 AR070297, R01 AR076328, R01 AR076985, and R01 AR068966, and was performed under the rubric of the Center of Advanced Imaging Innovation and Research (CAI2R) at the Grossman School of Medicine and NIBIB Biomedical Technology Resource Center (NIH P41 EB017183).References
1. Gram M, Seethaler M, Gensler D, Oberberger J, Jakob PM, Nordbeck P: Balanced spin-lock preparation for B1-insensitive and B0-insensitive quantification of the rotating frame relaxation time T1ρ. Magn Reson Med 2021; 85:2771–2780. 2. Block KT, Chandarana H, Milla S, et al.: Towards Routine Clinical Use of Radial Stack-of-Stars 3D Gradient-Echo Sequences for Reducing Motion Sensitivity. J Korean Soc Magn Reson Med 2014; 18:87. 3. Cloos MA, Assländer J, Abbas B, et al.: Rapid Radial T1 and T2 Mapping of the Hip Articular Cartilage With Magnetic Resonance Fingerprinting. J Magn Reson Imaging 2019; 50:810–815. 4. Weigel M: Extended phase graphs: Dephasing, RF pulses, and echoes - Pure and simple. J Magn Reson Imaging 2015; 41:266–295. 5. McGivney DF, Pierre E, Ma D, et al.: SVD compression for magnetic resonance fingerprinting in the time domain. IEEE Trans Med Imaging 2014; 33:2311–2322. 6. Stupic KF, Ainslie M, Boss MA, et al.: A standard system phantom for magnetic resonance imaging. Magn Reson Med 2021; 86:1194–1211. 7. Sharafi A, Xia D, Chang G, Regatte RR: Biexponential T1ρ relaxation mapping of human knee cartilage in vivo at 3 T. NMR Biomed 2017; 30.Figures
Figure
1. (a) 3D-MRF sequence timing diagram. Two FISP and two FLASH segments
were used after an adiabatic pulse to encode T1/ T2 and T1/B1+.
Six FLASH segments preceded by the T1ρ preparation module with
variable duration were applied to measure T1ρ. (b) Radial
spoke was acquired per excitation with golden angle increment. Each shot
consists of 1750 variable flip angles. To increase the SNR, the train was
repeated with a 90° offset and summed to generate the trajectory (c) Stack of stars was acquired for volumetric coverage
with centric out Cartesian phase-encoding in the kz direction.
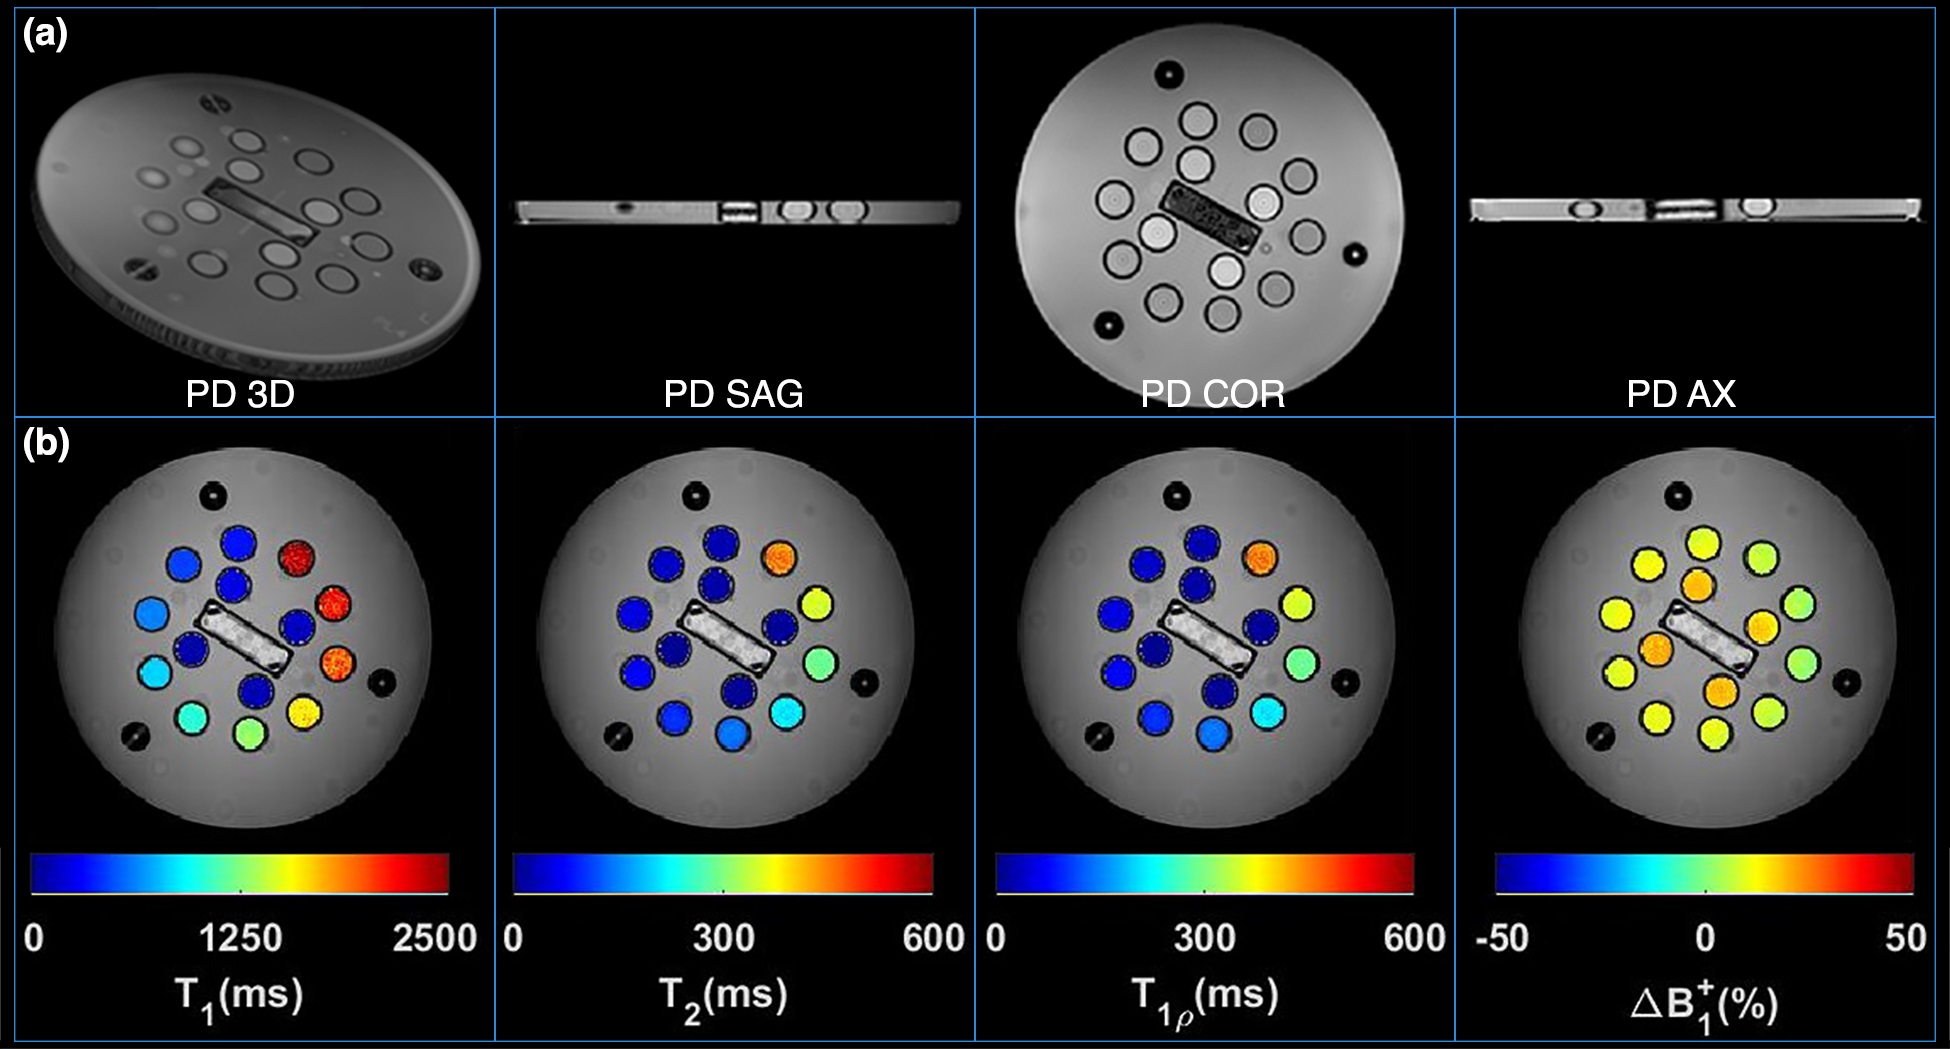
Figure 2. (a) Representative
volumetric and multi-plane PD images (b) representative T1, T2, and T1ρ and B1+
maps of the model NIST/ISMRM system phantom.

Figure 3.
Regression and Bland-Altman plots indicate good agreement between our 3D
proposed MRF with different shots and the conventional mapping techniques for
(a) T1, (b) T2, and (c) T1ρ estimation. Increasing the shots will improve the
accuracy at the cost of increased scan time.
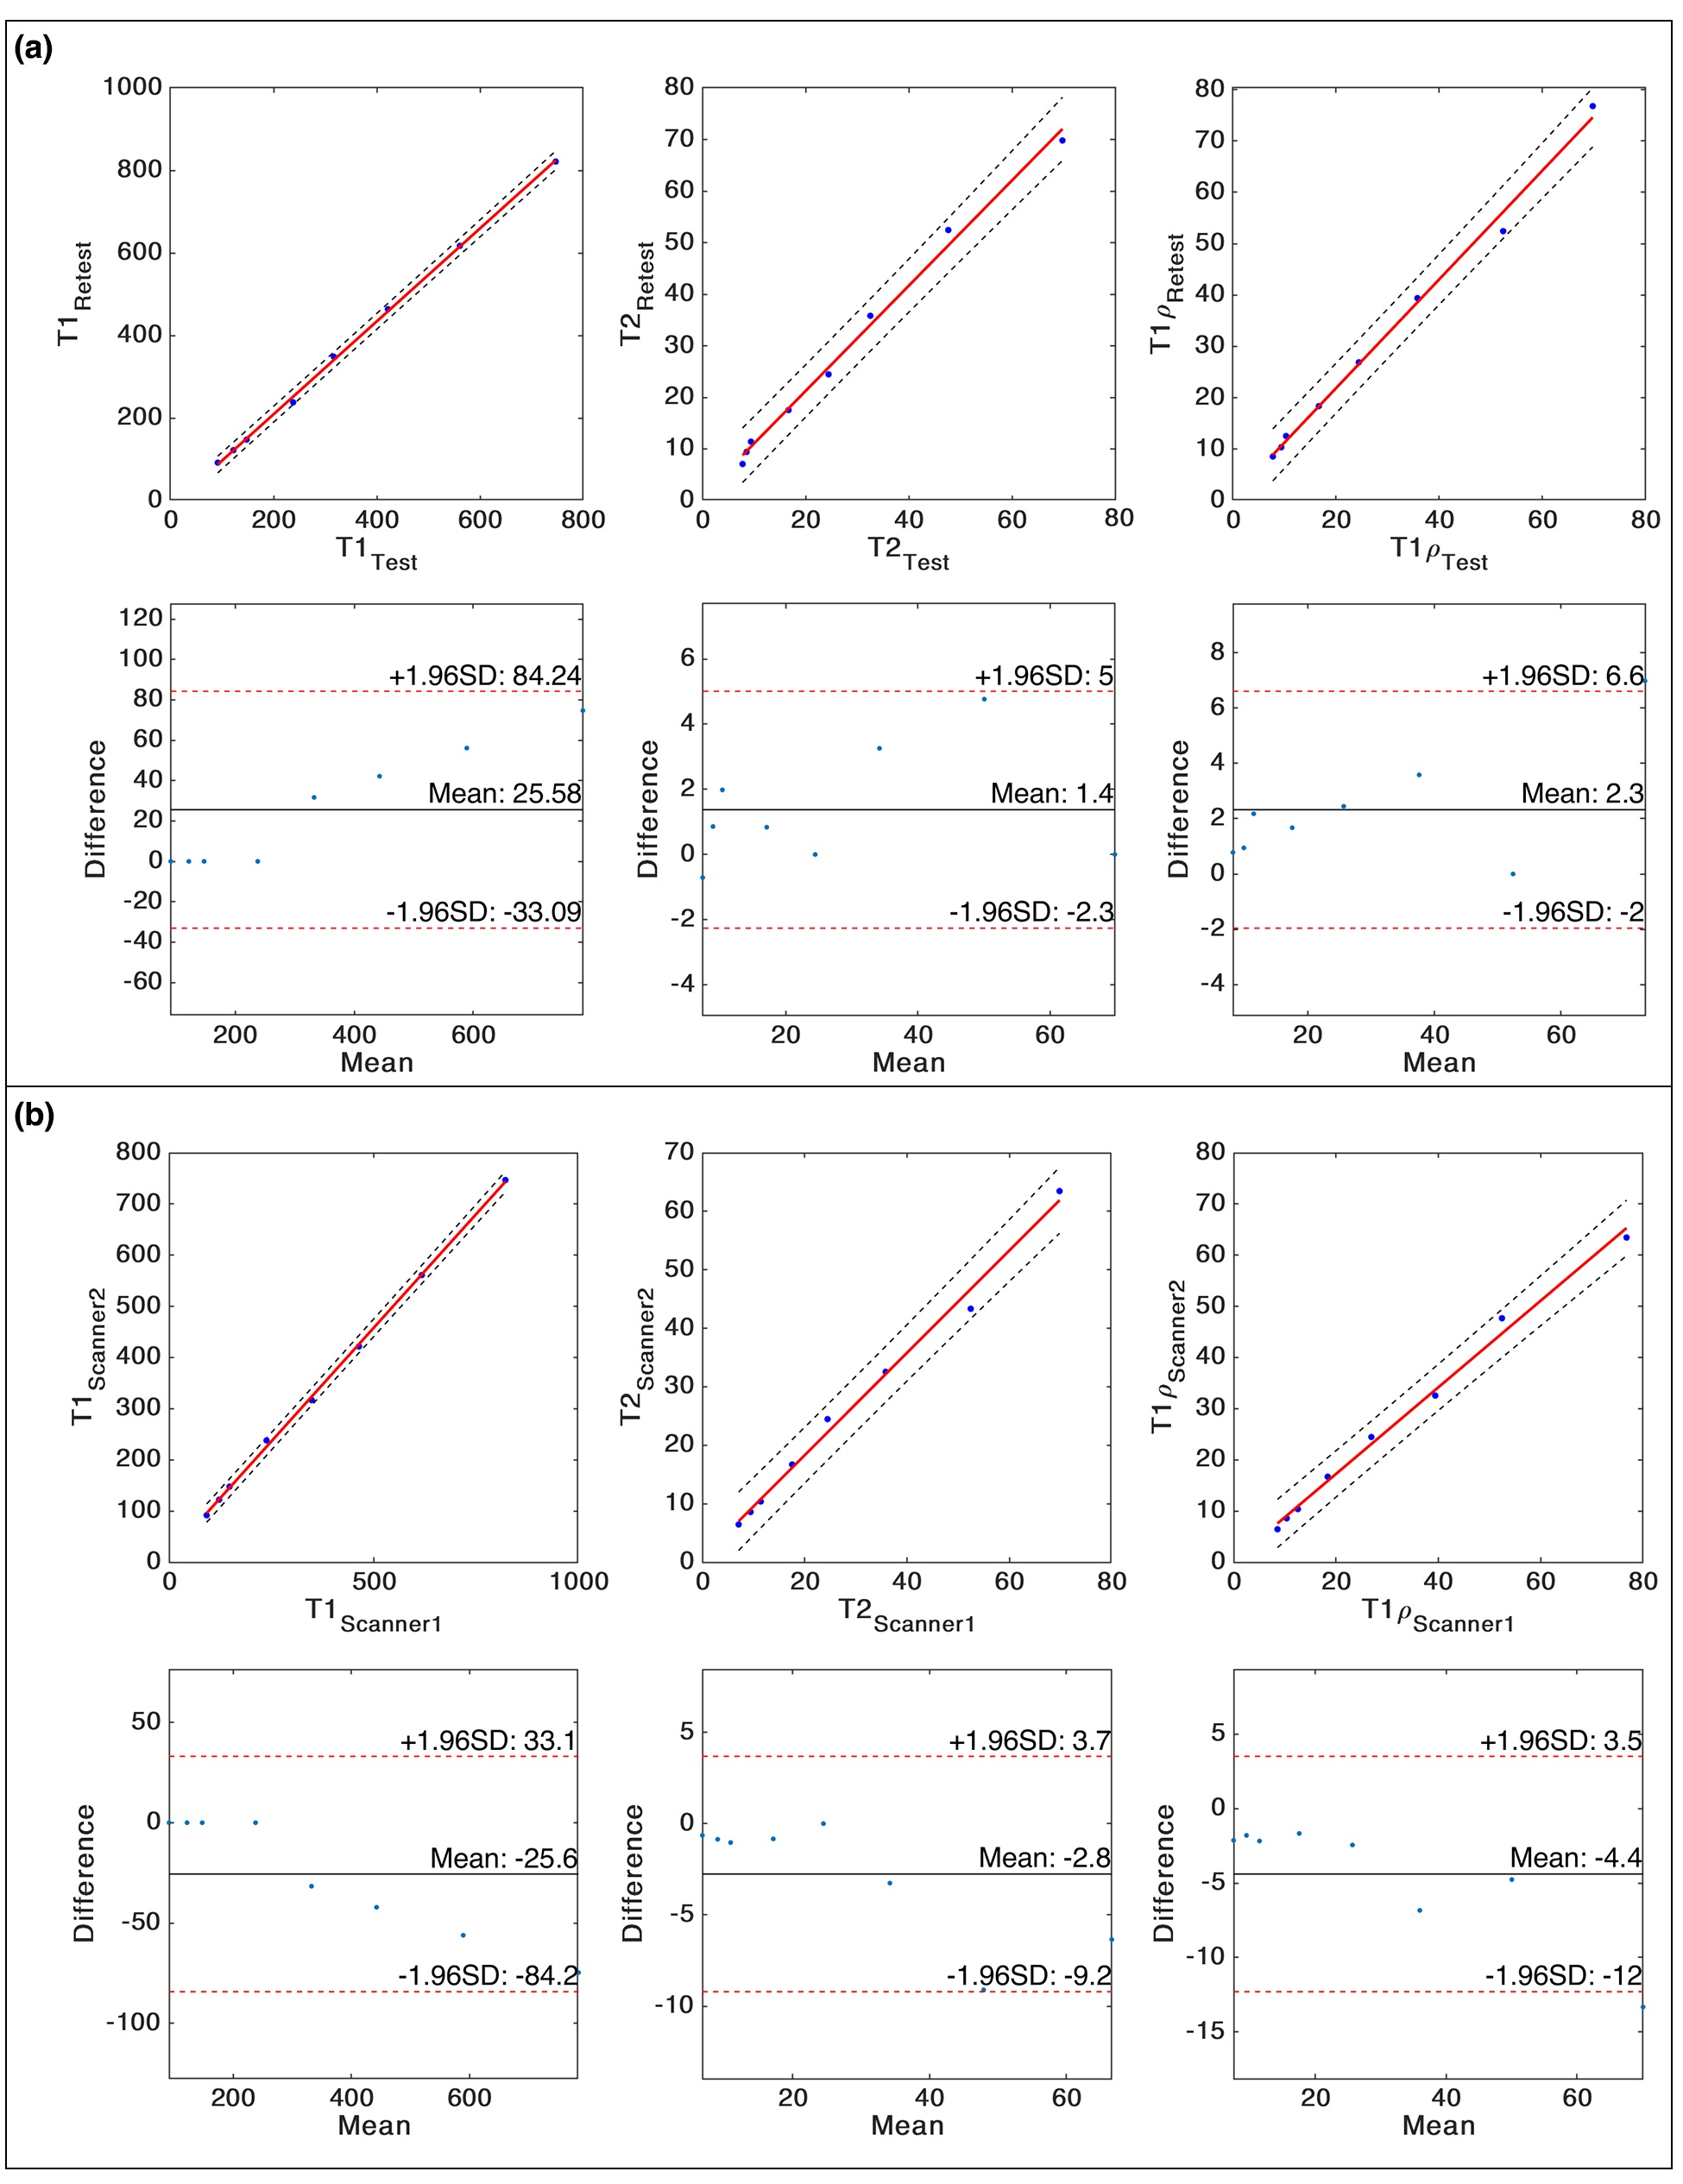
Figure 4. Regression and Bland-Altman
plots show excellent (a) reproducibility and (b) repeatability of the proposed
3D-MRF technique for T1, T2, and T1ρ estimation.
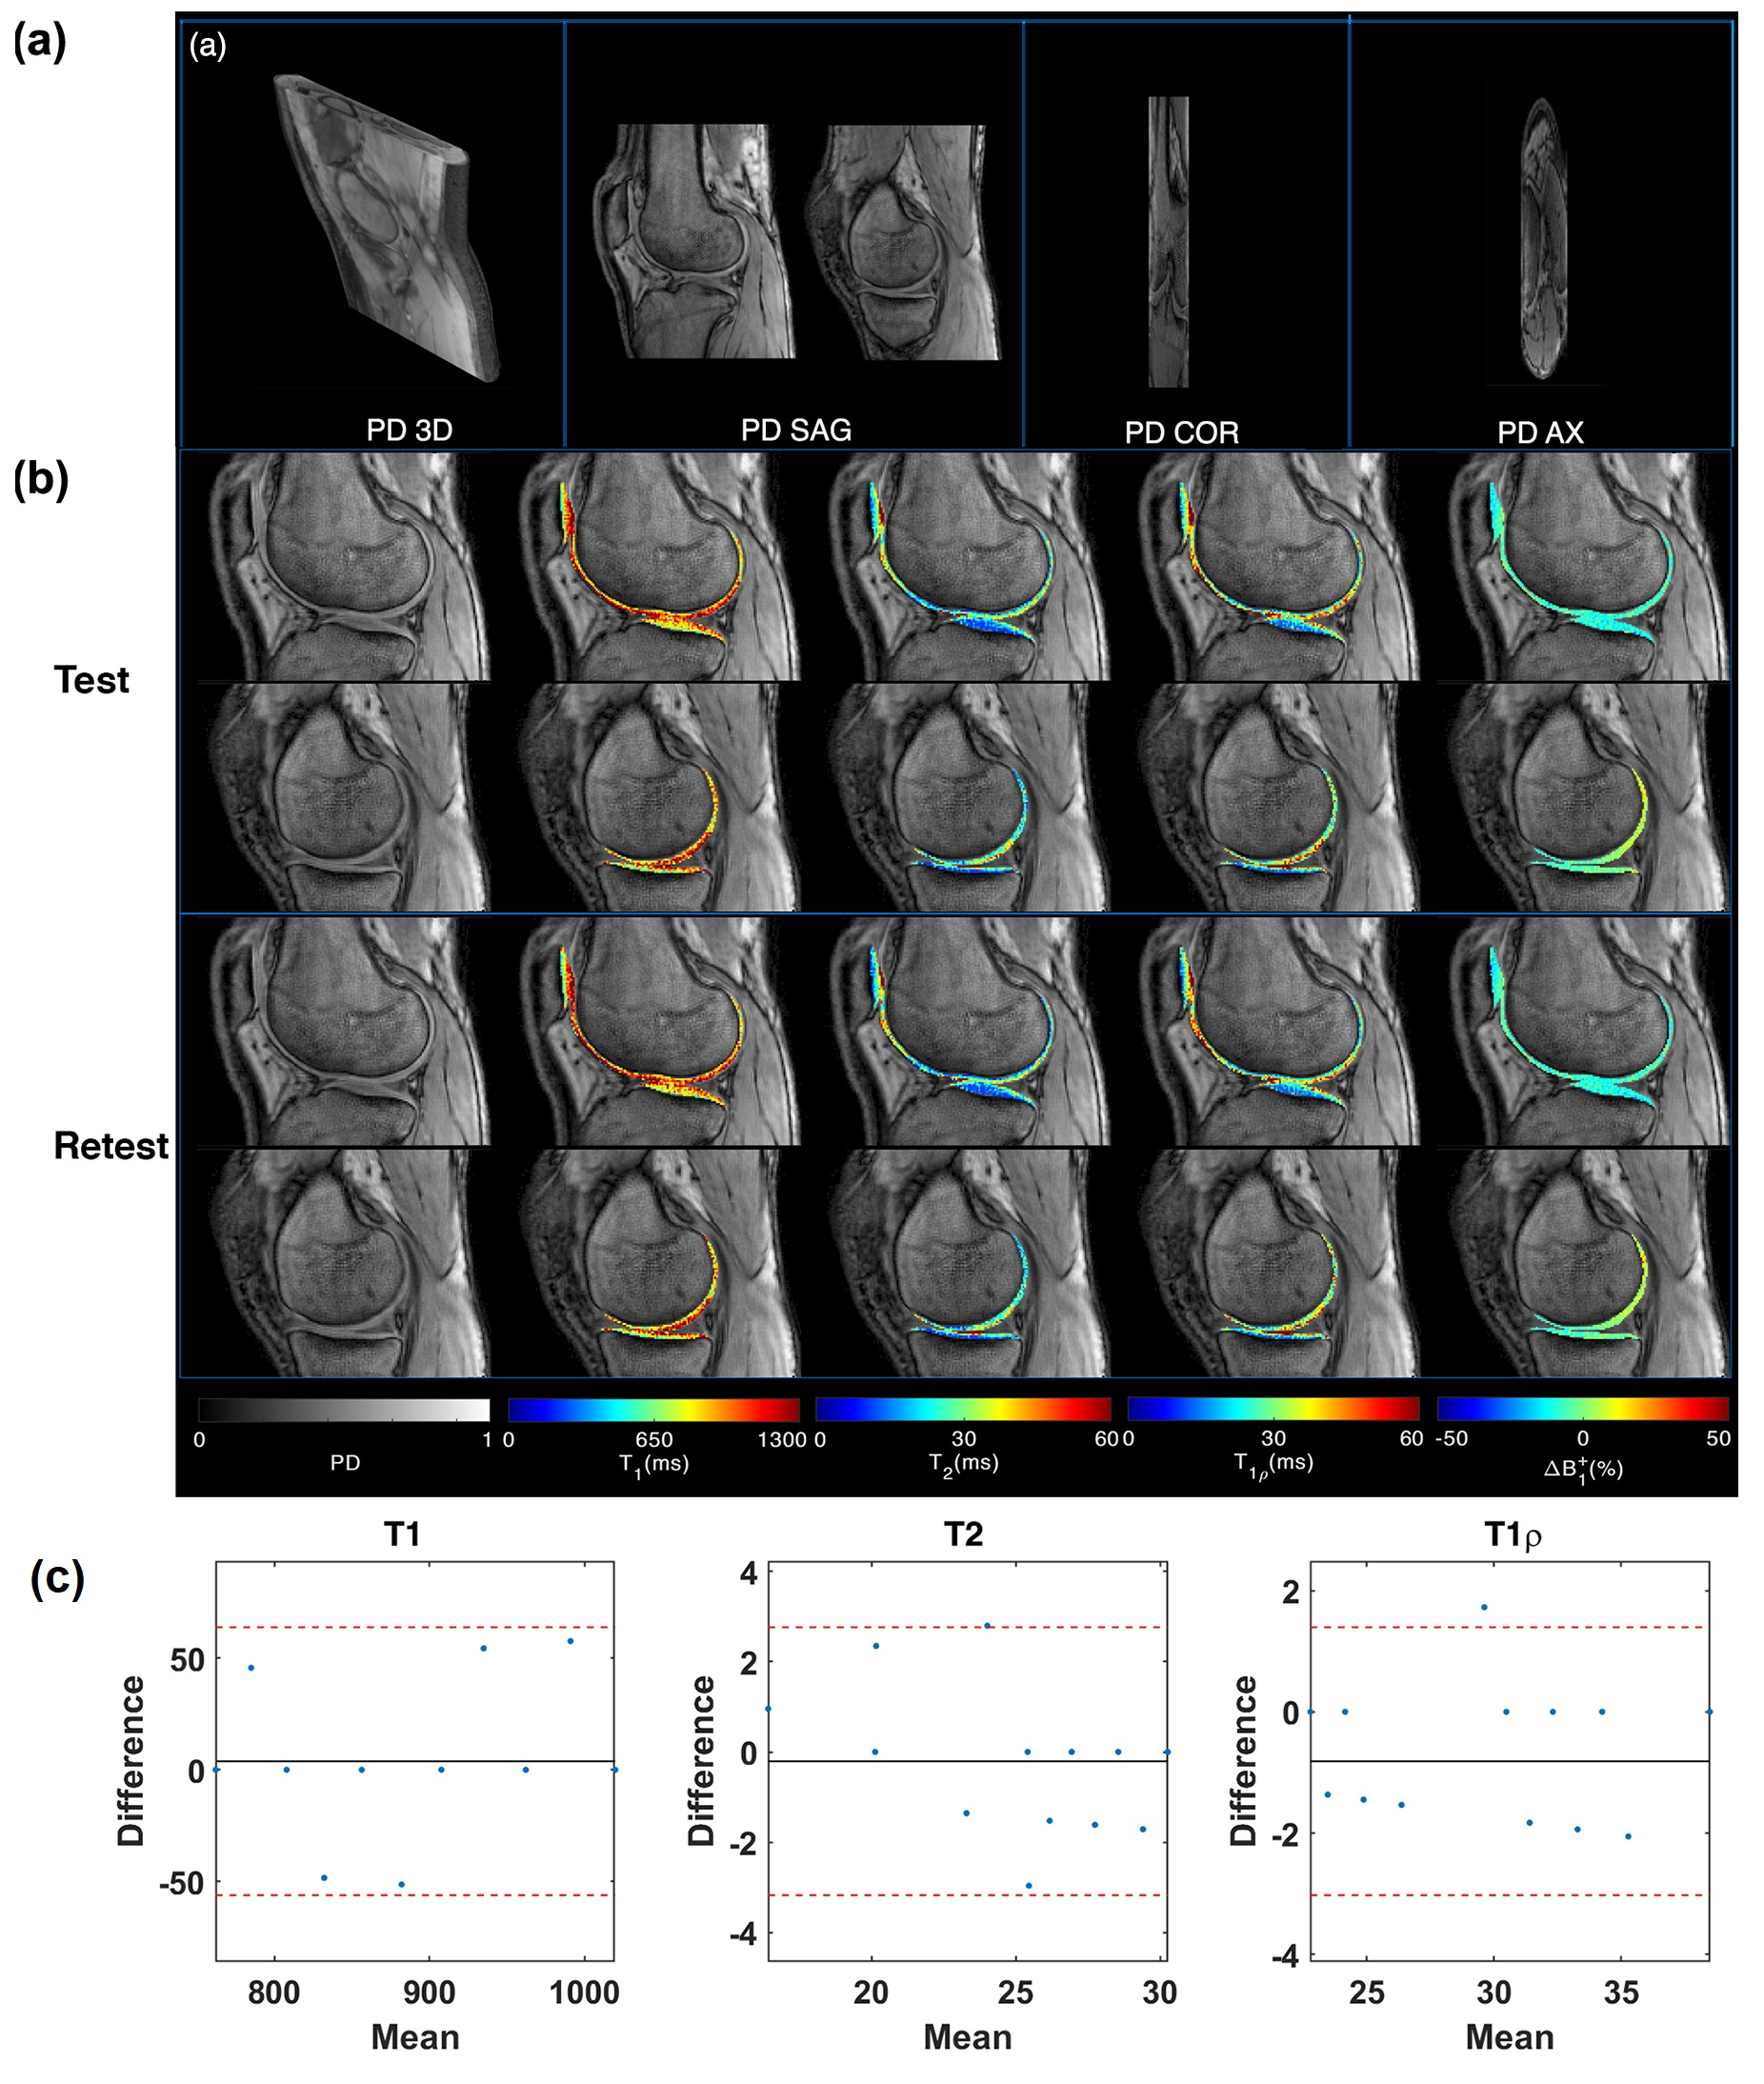
Figure 5. (a) Representative
volumetric and multi-plane PD images. (b) Representative test-retest knee MRF maps (c)
Bland- Altman plots show good agreement between two tests.
DOI: https://doi.org/10.58530/2022/0535