0532
Quantitative Assessment of Whole Knee Joint Using a New Phase Modulated Ultrashort Echo Time Adiabatic T1rho (PM-UTE-AdiabT1rho) Sequence1Radiology, University of California, San Diego, San Diego, CA, United States, 2GE Healthcare, San Diego, CA, United States, 3Radiology Service, Veterans Affairs San Diego Healthcare System, San Diego, CA, United States
Synopsis
Adiabatic T1rho (AdiabT1rho) is much less sensitive to the magic angle effect compared to the regular continuous wave T1rho (CW-T1rho). In this study we developed a novel phase modulated ultrashort echo time adiabatic T1rho (PM-UTE-AdiabT1rho) sequence for quantitative assessment of both short and long T2 tissue components in the knee joint, including cartilage, meniscus, ligaments, tendons, and muscle, on a clinical 3T scanner. Our results showed excellent single exponential fitting for all the major tissue components in both ex vivo and in vivo normal knee joints.
Introduction
Spin lattice relaxation in the rotating frame (T1rho) has been recognized as a sensitive MR imaging biomarker of proteoglycan in the musculoskeletal (MSK) system (1,2). However, regular continuous wave T1rho (CW-T1rho) is very sensitive to the magic angle effect for highly anisotropic tissues such as cartilage, meniscus, ligament, and tendon (3,4). CW-T1rho values may more than double when the tissue fiber orientation changes from 0º to 55º relative to the B0 field (4,5). Magic angle-induced CW-T1rho changes can be much greater than those induced by tissue degeneration (5). Recently, studies have shown that adiabatic T1rho (AdiabT1rho) is comparatively much less sensitive to the magic angle effect (6-8). In this study, we developed a novel phase modulated ultrashort echo time adiabatic T1rho (PM-UTE-AdiabT1rho) sequence for quantitative assessment of all major knee joint tissue components. To investigate the feasibility of clinical translation for this new PM-UTE-AdiabT1rho sequence, both ex vivo and in vivo knee joints were scanned on a clinical 3T scanner.Methods
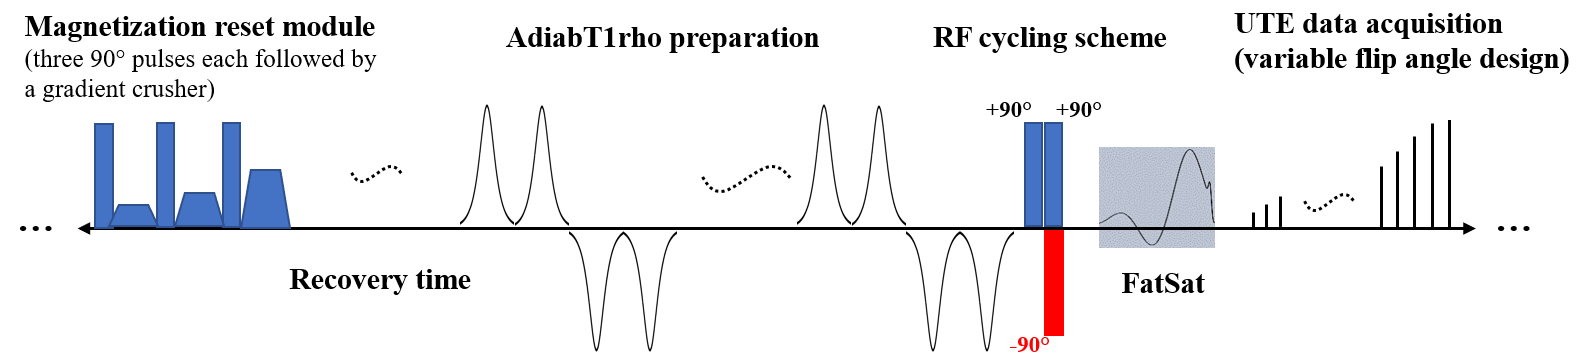
Instead of using a continuous wave radiofrequency (RF) pulse for spin locking, the AdiabT1rho sequence utilizes a train of adiabatic full passage (AFP) pulses to lock the spin in a rotating frame to generate T1rho contrast (6,7). Figure 1 shows a diagram of the proposed PM-UTE-AdiabT1rho sequence which includes six major features: 1) a magnetization reset module to generate a constant magnetization recovery, 2) a train of AFP pulses, 3) an RF cycling or phase modulation scheme (i.e., the RF phase of the second 90º pulse alternates by 180º in the adjacent repetition times (TRs)) to remove T1 dependence in T1rho quantification, 4) a fat saturation module between the T1rho preparation and acquisition blocks, 5) a variable flip angle (VFA) technique to reduce signal variation along the multiple data acquisition spokes and improve the signal-to-noise ratio (SNR) performance, and 6) a 3D UTE sequence for data acquisition with an efficient Cones trajectory scheme. The final images are obtained from the difference between the acquisitions with two different RF cycling phases. The magnetization reset, RF phase modulation, and VFA design features have been successfully applied to the widely used 3D MAPSS-T1hro sequence (9).Three normal knee joint specimens (aged 51±5 years, two males, one female) and four healthy knee joints from four volunteers (aged 35±2 years, three males, one female) were scanned. Informed consent was obtained from all volunteers in accordance with the Institutional Review Board. The sequence parameters were: 1) ex vivo knee joint scan (room temperature): spin locking time (TSL)=0, 12.1, 24.2, 36.3, 48.4, 72.6, and 96.9ms, field of view (FOV)=15×15mm2, matrix=256×256, slice number=40, slice thickness=2mm, repetition time (TR)/echo time (TE)=6/0.032ms, magnetization recovery time=330ms, number of spokes per preparation=65, excitation flip angle (FA) range=10º to 60º, and total scan time=24.5min; 2) in vivo knee joint scan: TSL=0, 12.1, 24.2, 36.3, 48.4, 72.6 and 96.9ms, FOV=15×15mm2, matrix=256×256, slice number=32, slice thickness=3mm, TR/TE=6/0.032ms, magnetization recovery time=330ms, number of spokes per preparation=75, excitation FA range: 10º to 60º, and total scan time=15min. Single exponential fitting was performed for the PM-UTE-AdiabT1rho images with seven different TSLs.
Results and Discussion
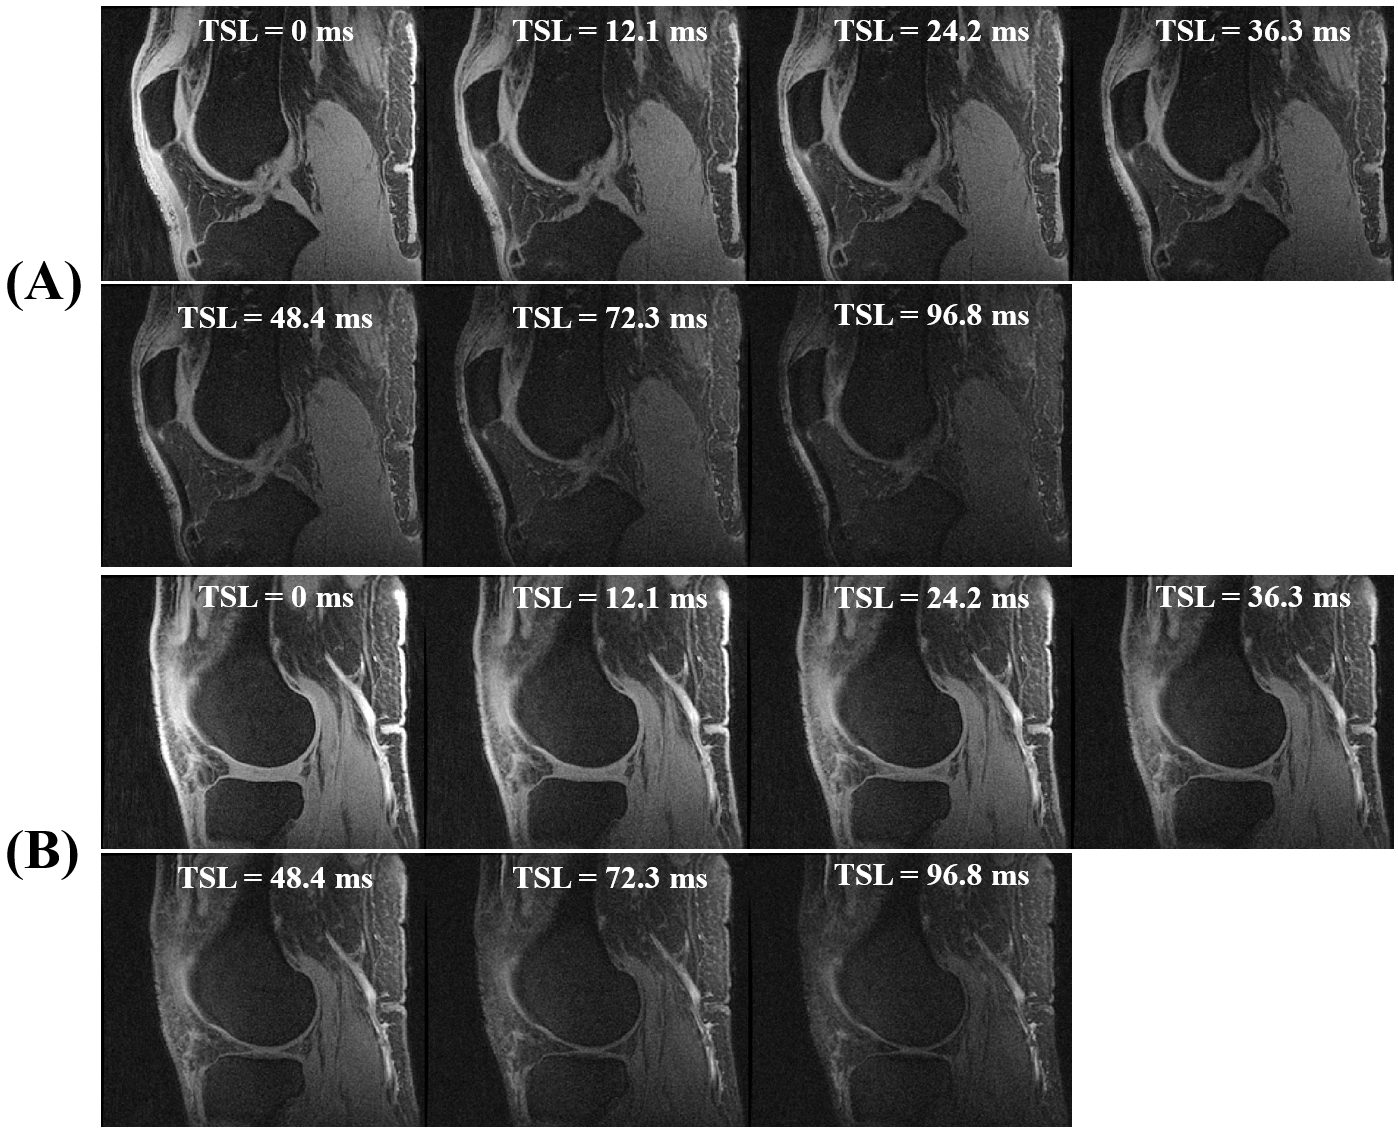
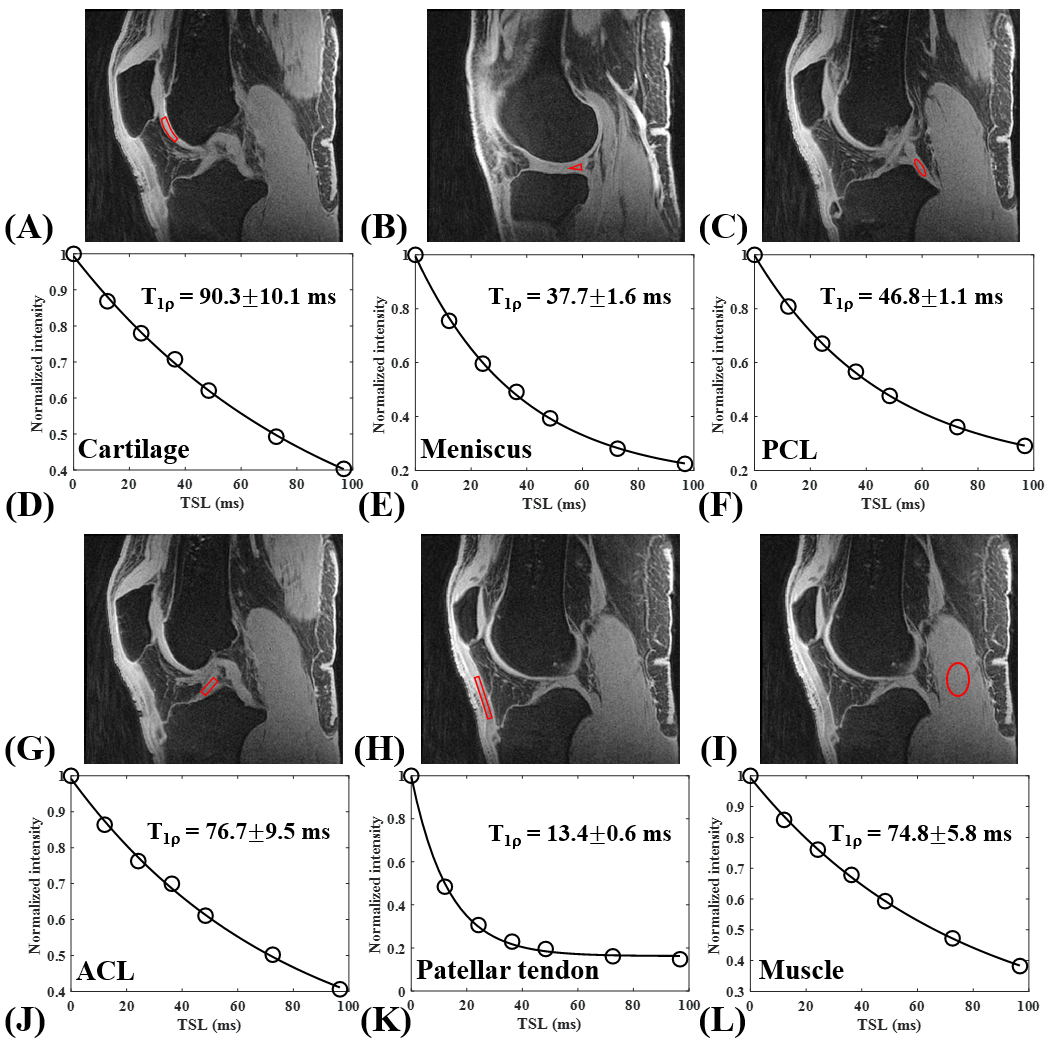
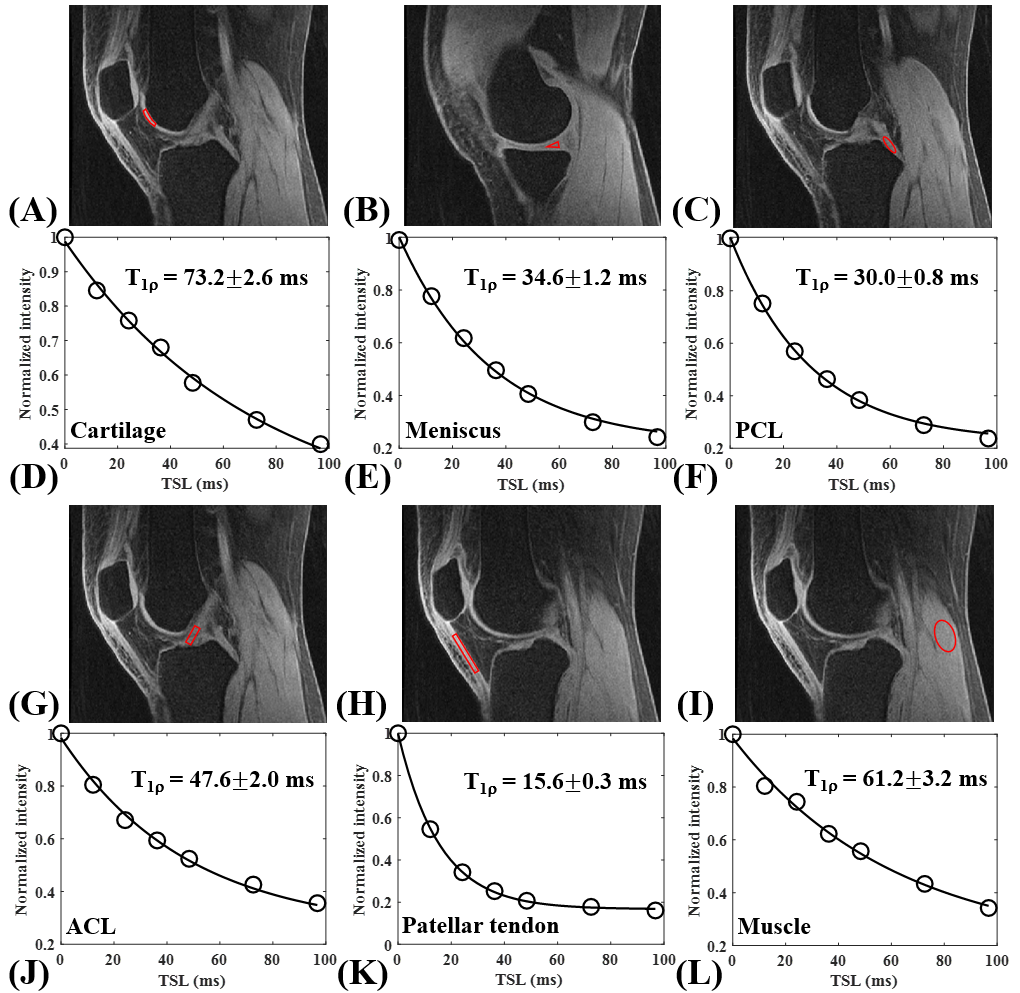
Figure 2 shows the representative PM-UTE-AdiabT1rho images from two different slices of a knee joint specimen. It is found that both short and long T2 tissue signals can be detected by this new sequence for the first three to four TSLs. Fat was efficiently suppressed in all images.As can been seen in Figure 3, excellent single exponential fitting was achieved for all the major knee tissue components including femoral cartilage, meniscus, posterior cruciate ligament (PCL), anterior cruciate ligament (ACL), patellar tendon, and muscle. The AdiabT1rho values of these tissues were 90.3±10.1, 37.7±1.6, 46.8±1.1, 76.7±9.5, 13.4±0.6, and 74.8±5.8 ms, respectively. Similarly in the in vivo study, excellent single exponential fitting was achieved for all the major knee tissue components (Figure 4). The AdiabT1rho values of femoral cartilage, meniscus, PCL, ACL, patellar tendon, and muscle are 73.2±2.6, 34.6±1.2, 30.0±0.8, 47.6±2.0, 15.6±0.3, and 61.2±3.2 ms, respectively.
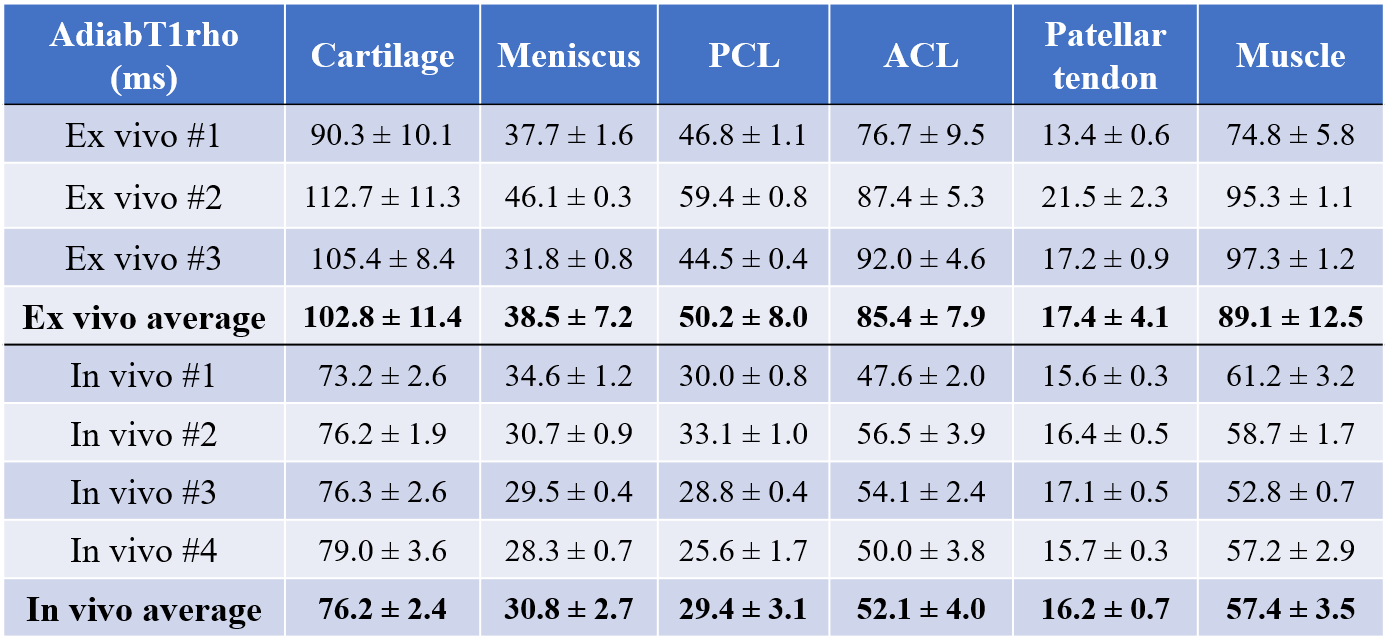
Table 1 summarizes all the AdiabT1rho measurements for both ex vivo and in vivo knee joints. The average AdiabT1rho values of femoral cartilage, meniscus, PCL, ACL, patellar tendon, and muscle for the four healthy knee joints were 102.8±11.4, 38.5±7.2, 50.2±8.0, 85.4±7.9, 17.4±4.1, and 89.1±12.5 ms, respectively. The average AdiabT1rho values of femoral cartilage, meniscus, PCL, ACL, patellar tendon, and muscle for the four healthy knee joints were 76.2±2.4, 30.8±2.7, 29.4±3.1, 52.1±4.0, 16.2±0.7, and 57.4±3.5 ms, respectively. It is not surprising that the in vivo measurements were generally lower than the ex vivo measurements due to the temperature difference.
Conclusion
The newly proposed PM-UTE-AdiabT1rho sequence allows comprehensive quantitative evaluation of all the major tissue components in the knee joint, demonstrating its potential in future clinical studies of osteoarthritis.Acknowledgements
The authors acknowledge grant support from NIH (R01AR062581, R01AR068987, R01AR075825, R01AR078877, and R21AR075851), VA Clinical Science and Rehabilitation Research and Development Services (Merit Awards I01CX001388 and I01RX002604), and GE Healthcare.References
1. Duvvuri U, Reddy R, Patel SD, Kaufman JH, Kneeland JB, Leigh JS. T1rho-elaxation in articular cartilage: effects of enzymatic degradation. Magn Reson Med 1997;38:863-867.
2. Regatte RR, Akella SVS, Lonner JH, Kneeland JB, Reddy R. T1q relaxation mapping in human osteoarthritis (OA) cartilage: comparison of T1q with T2. J Magn Reson Imaging 2006;23:547-553.
3. Du J, Chiang AJ, Chung CB, Statum S, Znamirowski R, Takahashi A, Bydder GM. Orientational analysis of the Achilles tendon and enthesis using an ultrashort echo time spectroscopic imaging sequence. MRI 2010;28: 178-184.
4. Du J, Statum S, Znamirowski R, Bydder GM, Chung CB. Ultrashort TE T1ρ magic angle imaging. Magn Reson Med 2013; 69: 682-687.
5. Shao H, Pauli C, Li S, Ma Y, Tadros AS, Kavanaugh A, Chang EY, Tang G, Du J. Magic angle effect plays a major role in both T1rho and T2 relaxation in articular cartilage. Osteoarthritis and cartilage 2017;25(12):2022-30.
6. Hänninen N, Rautiainen J, Rieppo L, Saarakkala S, Nissi MJ. Orientation anisotropy of quantitative MRI relaxation parameters in ordered tissue. Scientific reports 2017; 9:7(1):1-1.
7. Ma YJ, Carl M, Searleman A, Lu X, Chang EY, Du J. 3D adiabatic T1ρ prepared ultrashort echo time cones sequence for whole knee imaging. Magn Reson Med 2018;80(4):1429-39.
8. Wu M, Ma YJ, Kasibhatla A, Chen M, Jang H, Jerban S, Chang EY, Du J. Convincing evidence for magic angle less‐sensitive quantitative T1ρ imaging of articular cartilage using the 3D ultrashort echo time cones adiabatic T1ρ (3D UTE cones‐AdiabT1ρ) sequence. Magn Reson Med 2020;84(5):2551-60.
9. Li X, Han ET, Busse RF, Majumdar S. In vivo T1ρ mapping in cartilage using 3D magnetization‐prepared angle‐modulated partitioned k‐space spoiled gradient echo snapshots (3D MAPSS). Magn Reson Med 2008;59(2):298-307.
Figures