0531
Geometric and clinical evaluation of deep learning-based segmentation of individual lower limb muscles from patients with neuropathies1Aix Marseille Univ, CNRS, CRMBM, UMR 7339, Marseille, France, 2Aix Marseille Univ, Université de Toulon, CNRS, LIS, Marseille, France, 3APHM, Hopital Universitaire Timone, CEMEREM, Marseille, France, 4Centre de référence des maladies neuromusculaires et de la SLA, Marseille, France
Synopsis
Quantification of Fat Fraction (FF) in individual lower limb muscles of patients with neuromuscular disorders relies on segmentation. Few studies have indicated that Fully Convolutional Networks (FCNs) can provide reliable automatic segmentations to replace manual tasks. However, their sensitivity to fat infiltration has never been accurately assessed. Four FCN were benchmarked for the segmentation of 114 thigh and 108 calf images (1788 muscles) with FF up to 60%. HRNet was the only network that didn't show any segmentation failures. DSC obtained was comparable to other networks. The FF values calculated from the automatic (FFa) and manual (FFm) segmentations were consistent.
Introduction
MRI is an imaging modality which can be used to visualize and quantify (Dixon imaging) fat infiltration in individual muscles neuropathic patients. However the quantification of fat infiltration requires the segmentation of individual muscles 1. Given that manual segmentation is a time-consuming and subjective task, fully automatic segmentation methods would be of high interest. Multiple methods have been developed so far based on active contours and multi-atlas 2. They have generally provided acceptable results in control subjects but fat infiltration is clearly a burden for segmentation efficiency. So far, semi-automatic methods 3 have dealt with the effects of fat infiltration. However, in the case of a fully automatic segmentation performed by deep learning, this question has not been appropriately investigated.A wide variety of FCNs have been developed and U-Net has been largely used in the most recent papers 4–7. The reliability of these methods was only estimated on the basis of geometrical validation. In addition, the sensitivity to fat infiltration was assessed only by characterizing the infiltration with a qualitative score (Mercuri score) 8. Quantification of fat infiltration using FCN-based segmentation was successfully performed for muscles with a very light fat infiltration, i.e. 15% but the robustness with respect to a more severe infiltration 7 has not been assessed.
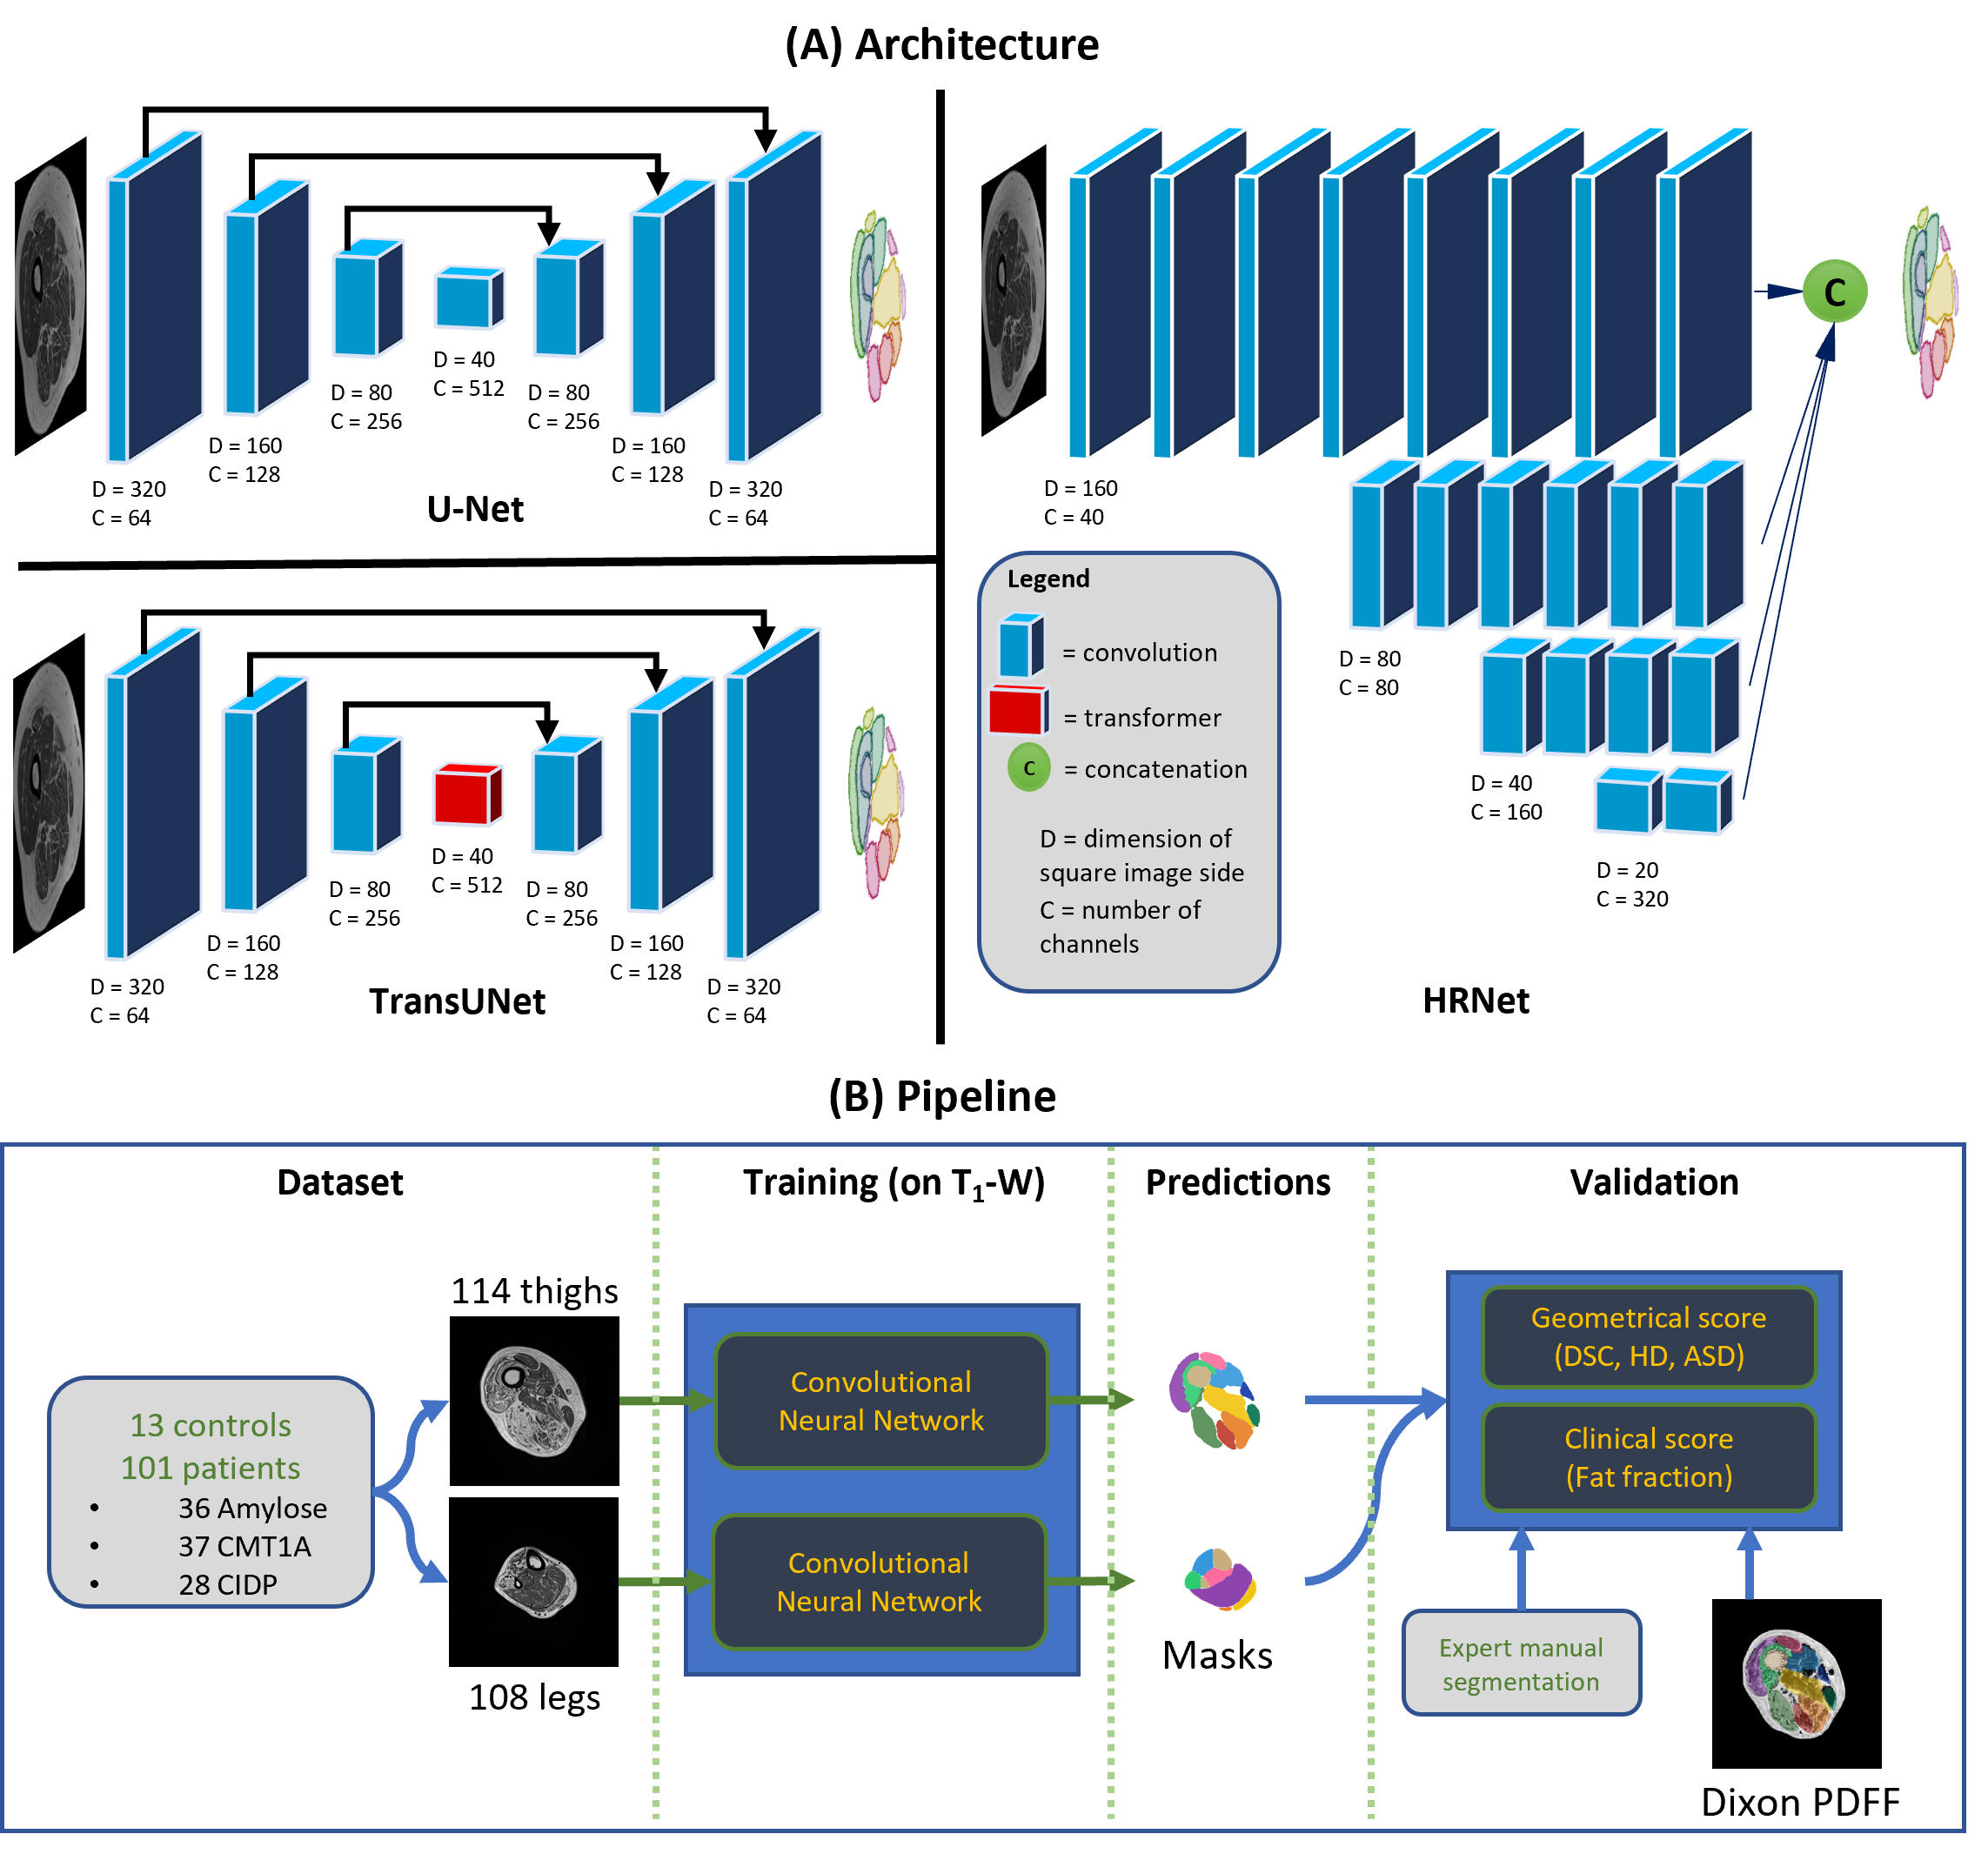
The aim of the present study was to compare the efficiency of several state-of-the-art 2D and 3D FCNs for the segmentation of individual muscles in MR images recorded in patients with neuromuscular disorders and showing a wide range of fatty infiltration. 2D and 3D U-Net were chosen as standard FCNs. A transformer attention module is part of the TransUNet with the aim of improving the receptive field of U-Net 9. HR-Net is a network allowing to keep the original resolution across layers thereby facilitating the prediction reconstruction 10.
The efficiency of each network was assessed on the basis of geometric metrics for each individual muscle. In addition automatically estimated FFa provided by each CNN were compared with manually estimated FFm.
Methods
The MRI dataset consisted of 222 MRIs: 114 thighs and 108 legs (13 controls, 101 neuropathic patients). Fat fraction ranged from 0.1 to 60%. Each volumetric image size was 320x320x20 so as to keep the native resolution i.e. 0.6875x0.6875x10 cm.The most popular FCN for the segmentation of medical images is U-Net which is commonly used with 2D images. Three network architectures were chosen to compensate for the shortcomings of U-Net (Fig.1) : i) TransUNet uses self-attention mechanisms (Transformer) with a U-Net backbone to enlarge the receptive field of the network. Indeed, convolution kernels only take into account the direct neighborhood of a given pixel, preventing the modeling of long-range dependencies in the image; ii) HR-Net is a CNN specifically developed to keep a high resolution throughout the processing thereby avoiding significant loss of information during oversampling; iii) U-Net 3D is an adaptation of the original U-Net developed by implementing 3D convolutions that allow processing of the entire volume rather than each slice independently. The goal was to use the relationship between slices in a volume to better estimate segmentations.
The geometric evaluation of the networks was done using Dice Similarity Coefficient (DSC), Hausdorff Distance (HD), Average Surface Distance (ASD). The rates of unsegmented muscles and outliers was added since networks can occasionally fail to detect a muscle. The robustness of the best network has been evaluated according to the fat infiltration. The difference between FF from automatic and manual masks (respectively FFa and FFm) was also evaluated to validate the quantification reliability.
Results
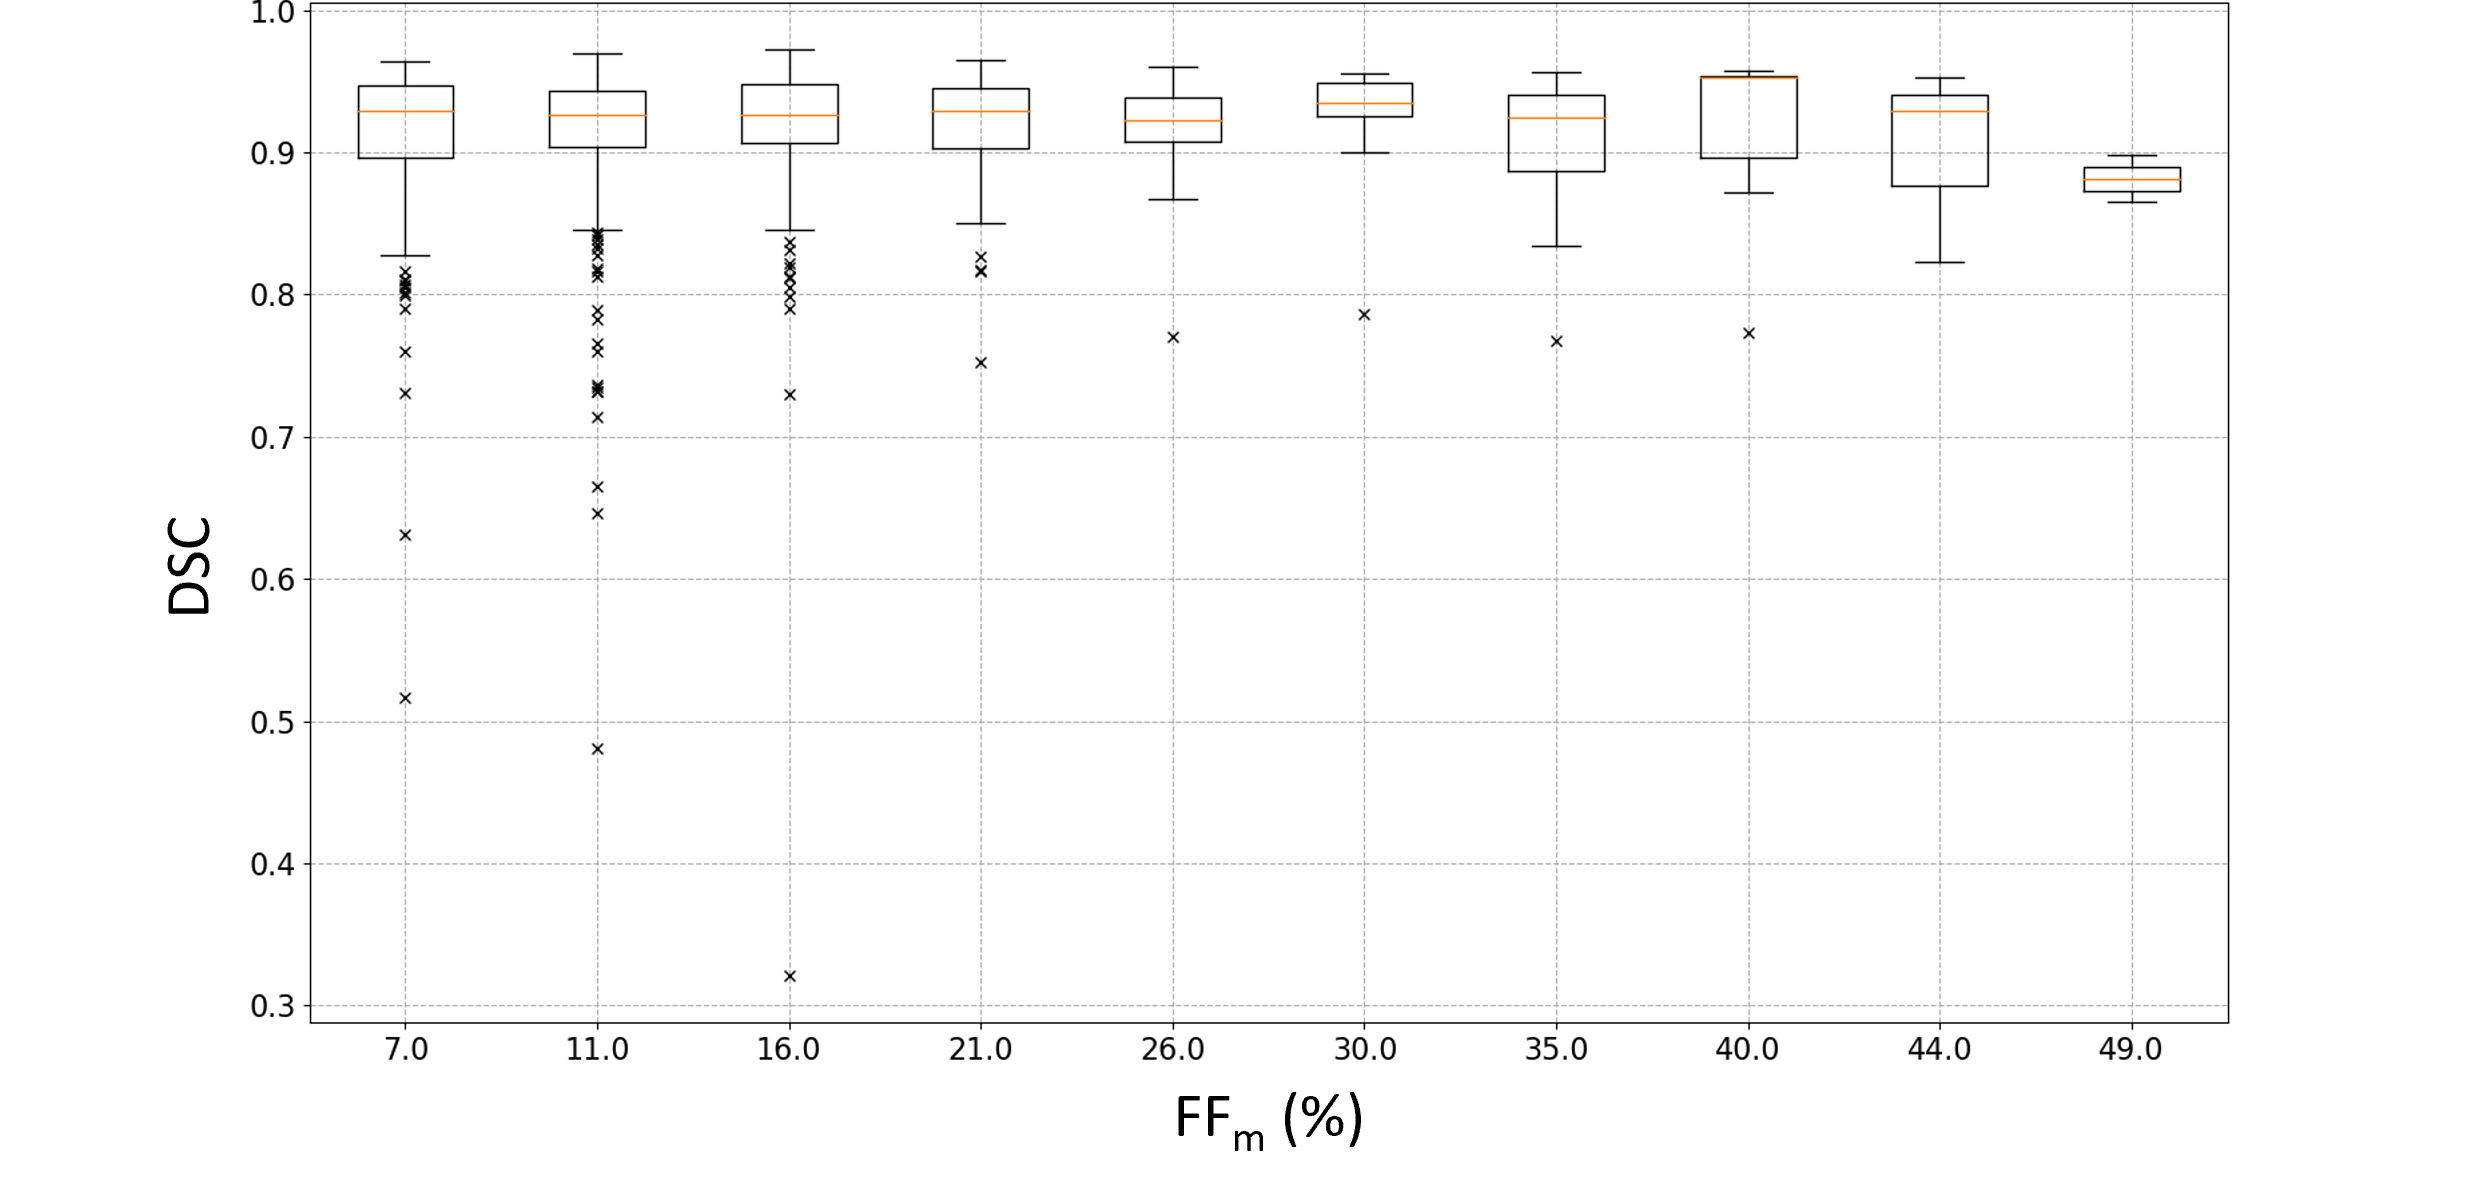
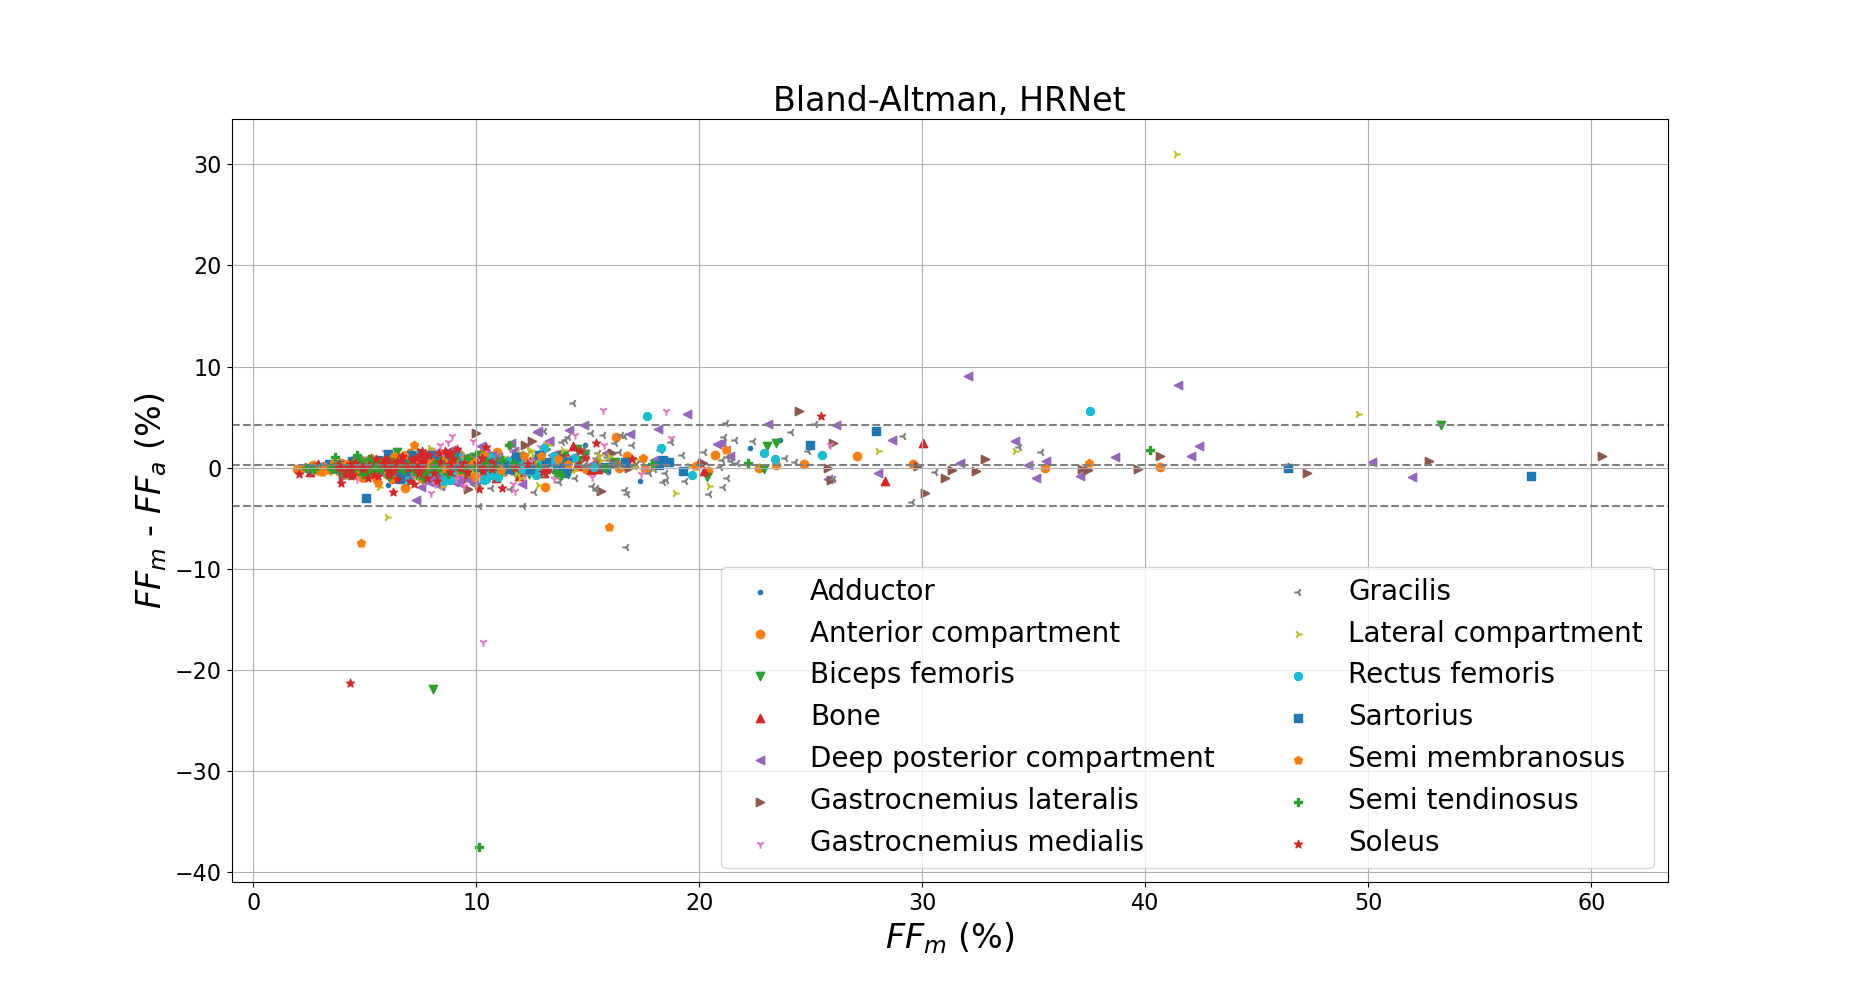
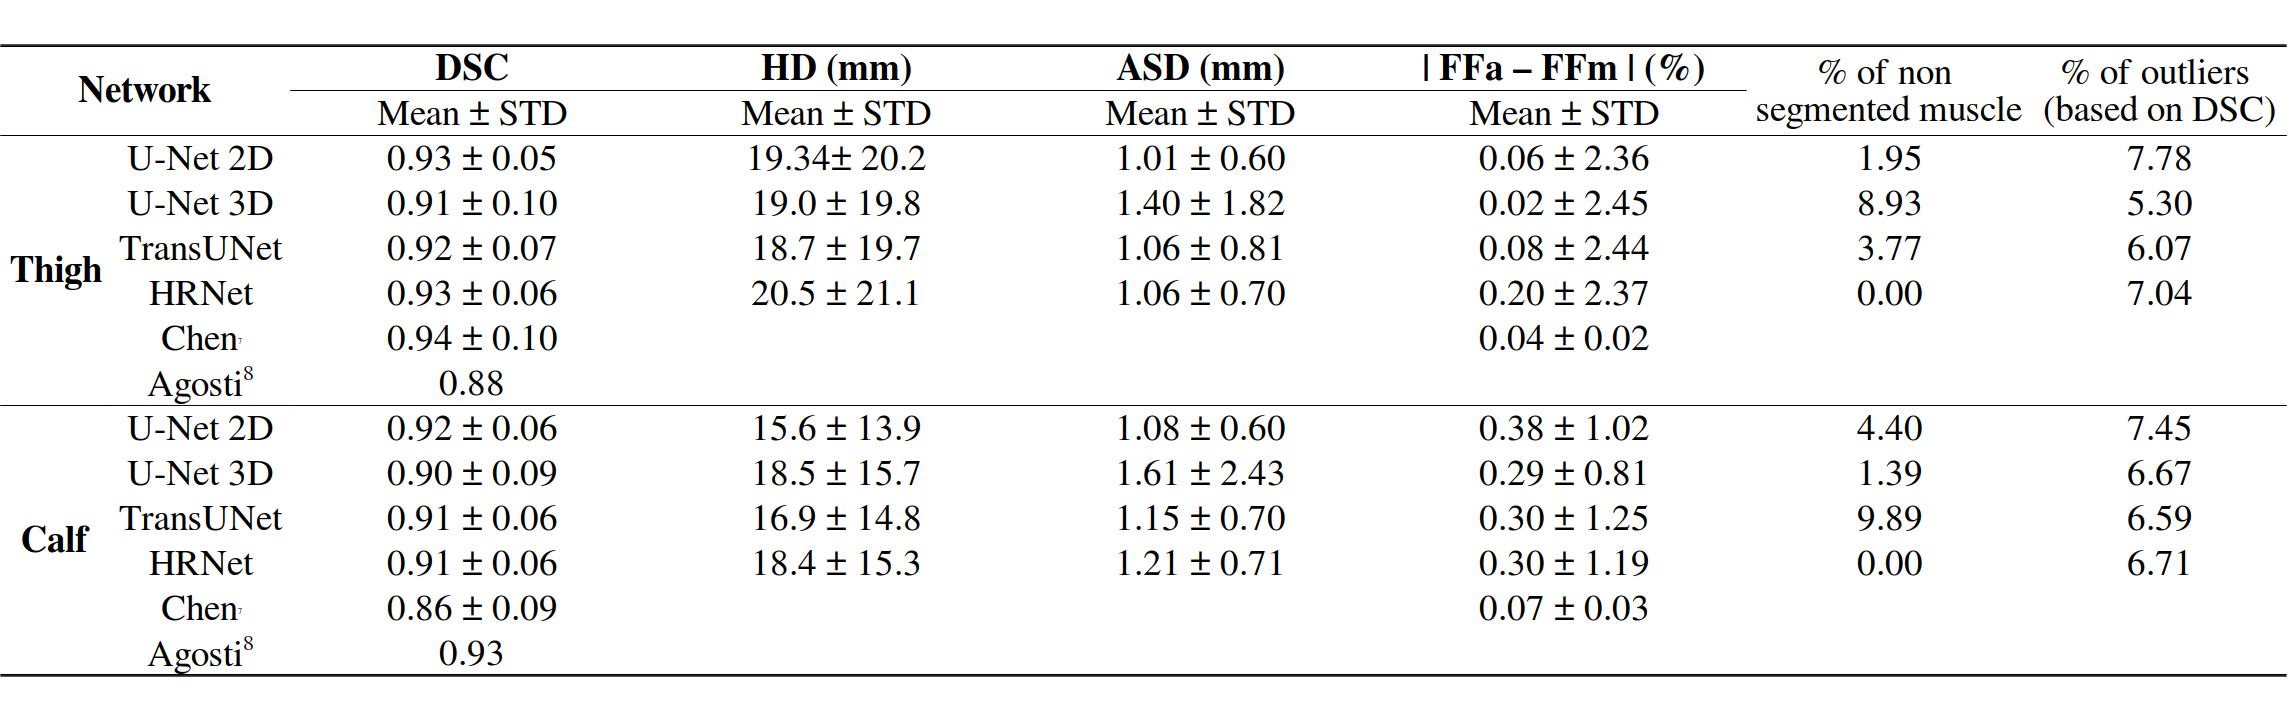
The geometric metrics i.e. DSC, ASD and HD illustrated a comparative efficiency of the four CNNs (Fig.2). HR-Net had no unsegmented muscle unlike the other networks with unsegmented rates ranging from 2 to 9% (Fig.2). Furthermore, the HRNet-based segmentation accuracy was good regardless the fat infiltration (Fig.3). About 6% of the values from HRNet are outliers caused by artifacts on the extreme slices, this rate remains reasonable since the average difference between FFm and FFa was 0.24±2.05% (Fig.4). This result is higher than that obtained with the other networks since HRNet identified more muscles, especially the most difficult cases to segment. Scores from other networks are presented in a summary table (Fig.5) together with the corresponding results found in the two most recent studies 7,8.Discussion
The DSC (0.91-0.93) and ASD (1.1-1.2 mm) values obtained with HRNet were comparable to the literature and showed no null segmentation. Although HD values were quite high (19 mm), we failed to identify a significant impact on fat quantification mainly because errors were relatively rare so that the influence on the FF values averaged over a large number of pixels was small. The difference between FFm and FFa was larger than what has been reported in the literature (0.05%). It should be kept in mind that FFs values in our database reached 60% while they peaked at 15% in other studies. In that respect, one could expect a more difficult segmentation task and higher error scores. Our results clearly illustrate that HRNet can be used robustly for MR images segmentation showing large fat infiltration with an acceptable bias, i.e., 0.24±2.05%.Acknowledgements
We would like to thank Amira Trabelsi, Camille Noël, Joachim Bas, Etienne Fortanier, Clémence Durelle, Giovanni Corazza, Emmanuelle Salort-Campana, Beynaz Ansari, Farzad Fatehi for their expert segmentations and Shiliang Liu for his help on the implementation of the networks.References
1. Morrow, J. M. et al. MRI biomarker assessment of neuromuscular disease progression: A prospective observational cohort study. The Lancet Neurology 15, 65–77 (2016).
2. Ogier, A. C., Hostin, M.-A., Bellemare, M.-E. & Bendahan, D. Overview of MR image segmentation strategies in neuromuscular disorders.
3. Ogier, A., Sdika, M., Foure, A., le Troter, A. & Bendahan, D. Individual muscle segmentation in MR images: A 3D propagation through 2D non-linear registration approaches. Proceedings of the Annual International Conference of the IEEE Engineering in Medicine and Biology Society, EMBS 317–320 (2017) doi:10.1109/EMBC.2017.8036826.
4. Ronneberger, O., Fischer, P. & Brox, T. U-Net: Convolutional Networks for Biomedical Image Segmentation. 1–8.
5. Guo, Z. et al. Fully Automated 3D Segmentation of MR-Imaged Calf Muscle Compartments: Neighborhood Relationship Enhanced Fully Convolutional Network. (2020).
6. Rohm, M. et al. 3D Automated Segmentation of Lower Leg Muscles Using Machine Learning on a Heterogeneous Dataset. Diagnostics 11, 1747 (2021).
7. Chen, Y., Moiseev, D., Kong, W. Y., Bezanovski, A. & Li, J. Automation of Quantifying Axonal Loss in Patients with Peripheral Neuropathies through Deep Learning Derived Muscle Fat Fraction. Journal of Magnetic Resonance Imaging (2021) doi:10.1002/jmri.27508.
8. Agosti, A. et al. Deep learning for automatic segmentation of thigh and leg muscles. Magnetic Resonance Materials in Physics, Biology and Medicine (2021) doi:10.1007/s10334-021-00967-4.
9. Chen, J. et al. TransUNet: Transformers Make Strong Encoders for Medical Image Segmentation. (2021).
10. Sun, K. et al. High-Resolution Representations for Labeling Pixels and Regions. (2019).
Figures