0529
The Relative Contribution of the Vascular Architecture and Reactivity to the BOLD signal Formation1Radiology department, Center for Image Sciences, UMC Utrecht, Utrecht, Netherlands, 2Spinoza Center for Neuroimaging, Amsterdam, Netherlands
Synopsis
In this study, we investigate the vascular contribution to the BOLD signal by comparing purely non-neuronal-related changes in the BOLD signal induced by gas manipulations with neuronal-related hemodynamic changes in the BOLD signal for different vascular compartments. Different vascular compartments were targeted by employing gradient-echo and spin-echo in combination with cortical depth estimations and pial vein segmentations. Our findings suggest that the increase in macro-vascular baseline venous blood volume (CBVv0) is the main contributor to the large GE-BOLD signal increase towards the pial surface and that normalization for this CBVv0-dependence is possible using a hyperoxia breathing task.
Introduction
The Blood-Oxygen-Level-Dependent (BOLD) signal1,2 reflects neuronal activity indirectly via changes in local venous oxygen saturation regulated by neurovascular coupling; changes in local cerebral blood flow and volume in response to neuronal activity. This complicates the interpretation of the BOLD signal as a direct representation of neuronal activity since it may also reflects signals having vascular origins. This confounding influence increases when measuring at the laminar scale; particularly since vascular architecture and density change across cortical depth3-5. Therefore, quantifying the contribution of different vascular compartments to the BOLD signal is crucial. We estimate the contributions of pial veins, intra-cortical veins, and micro-vessels with respect to cerebrovascular reactivity (CVR) and venous blood volume capacity (CBVv0). The hemodynamic response functions (HRF) were estimated following brief visual stimulations, while non-neuronal hemodynamic changes were induced by CO2 and O2 administration. The different vascular compartments were targeted by employing spin-echo (SE)-BOLD, whose sensitivity is weighted predominantly to the capillaries, and gradient-echo (GE)-BOLD, which is sensitive to all vessel sizes6,7. A hyperoxia normalization method is proposed to correct for CBVv0.Methods
Scan Protocol: Six healthy volunteers participated in a 7T fMRI session, while performing a hypercapnic (+3, +5, +8, and +10mmHg PetCO2) and hyperoxic (+350mmHg PetO2) breathing task using a RespirActTM device combined with brief visual stimuli (black/white random orientation patterns on a grey background of 0.2s duration, ISI: 3-20s) (Fig.1.). Functional volumes were acquired with GE-EPI (voxel size=1.0mm3, TR/TE=850/27ms, FA =50°, and FOV=7x128x128mm) and SE-EPI (voxel size=1.5mm3, TR/TE=850/50ms, FA=130°, and FOV=7.5x190x190mm) covering the early visual areas using two 16-channel high-density surface coils.Cortical depth estimates: Cortical laminae (top, middle, deep) were segmented from T1-weighted scans (Fig.2.c) using LayNii8. Pial veins were segmented from T2*-weighted anatomical volumes based on their dark appearance and susceptibility difference using two tools, BrainCharter9 and Nighres10, which worked complementary (Fig.2.a,d). These pial veins and laminae were linearly warped to functional space giving a probability for each cortical depth level to be present in each voxel (Fig.2.e.).
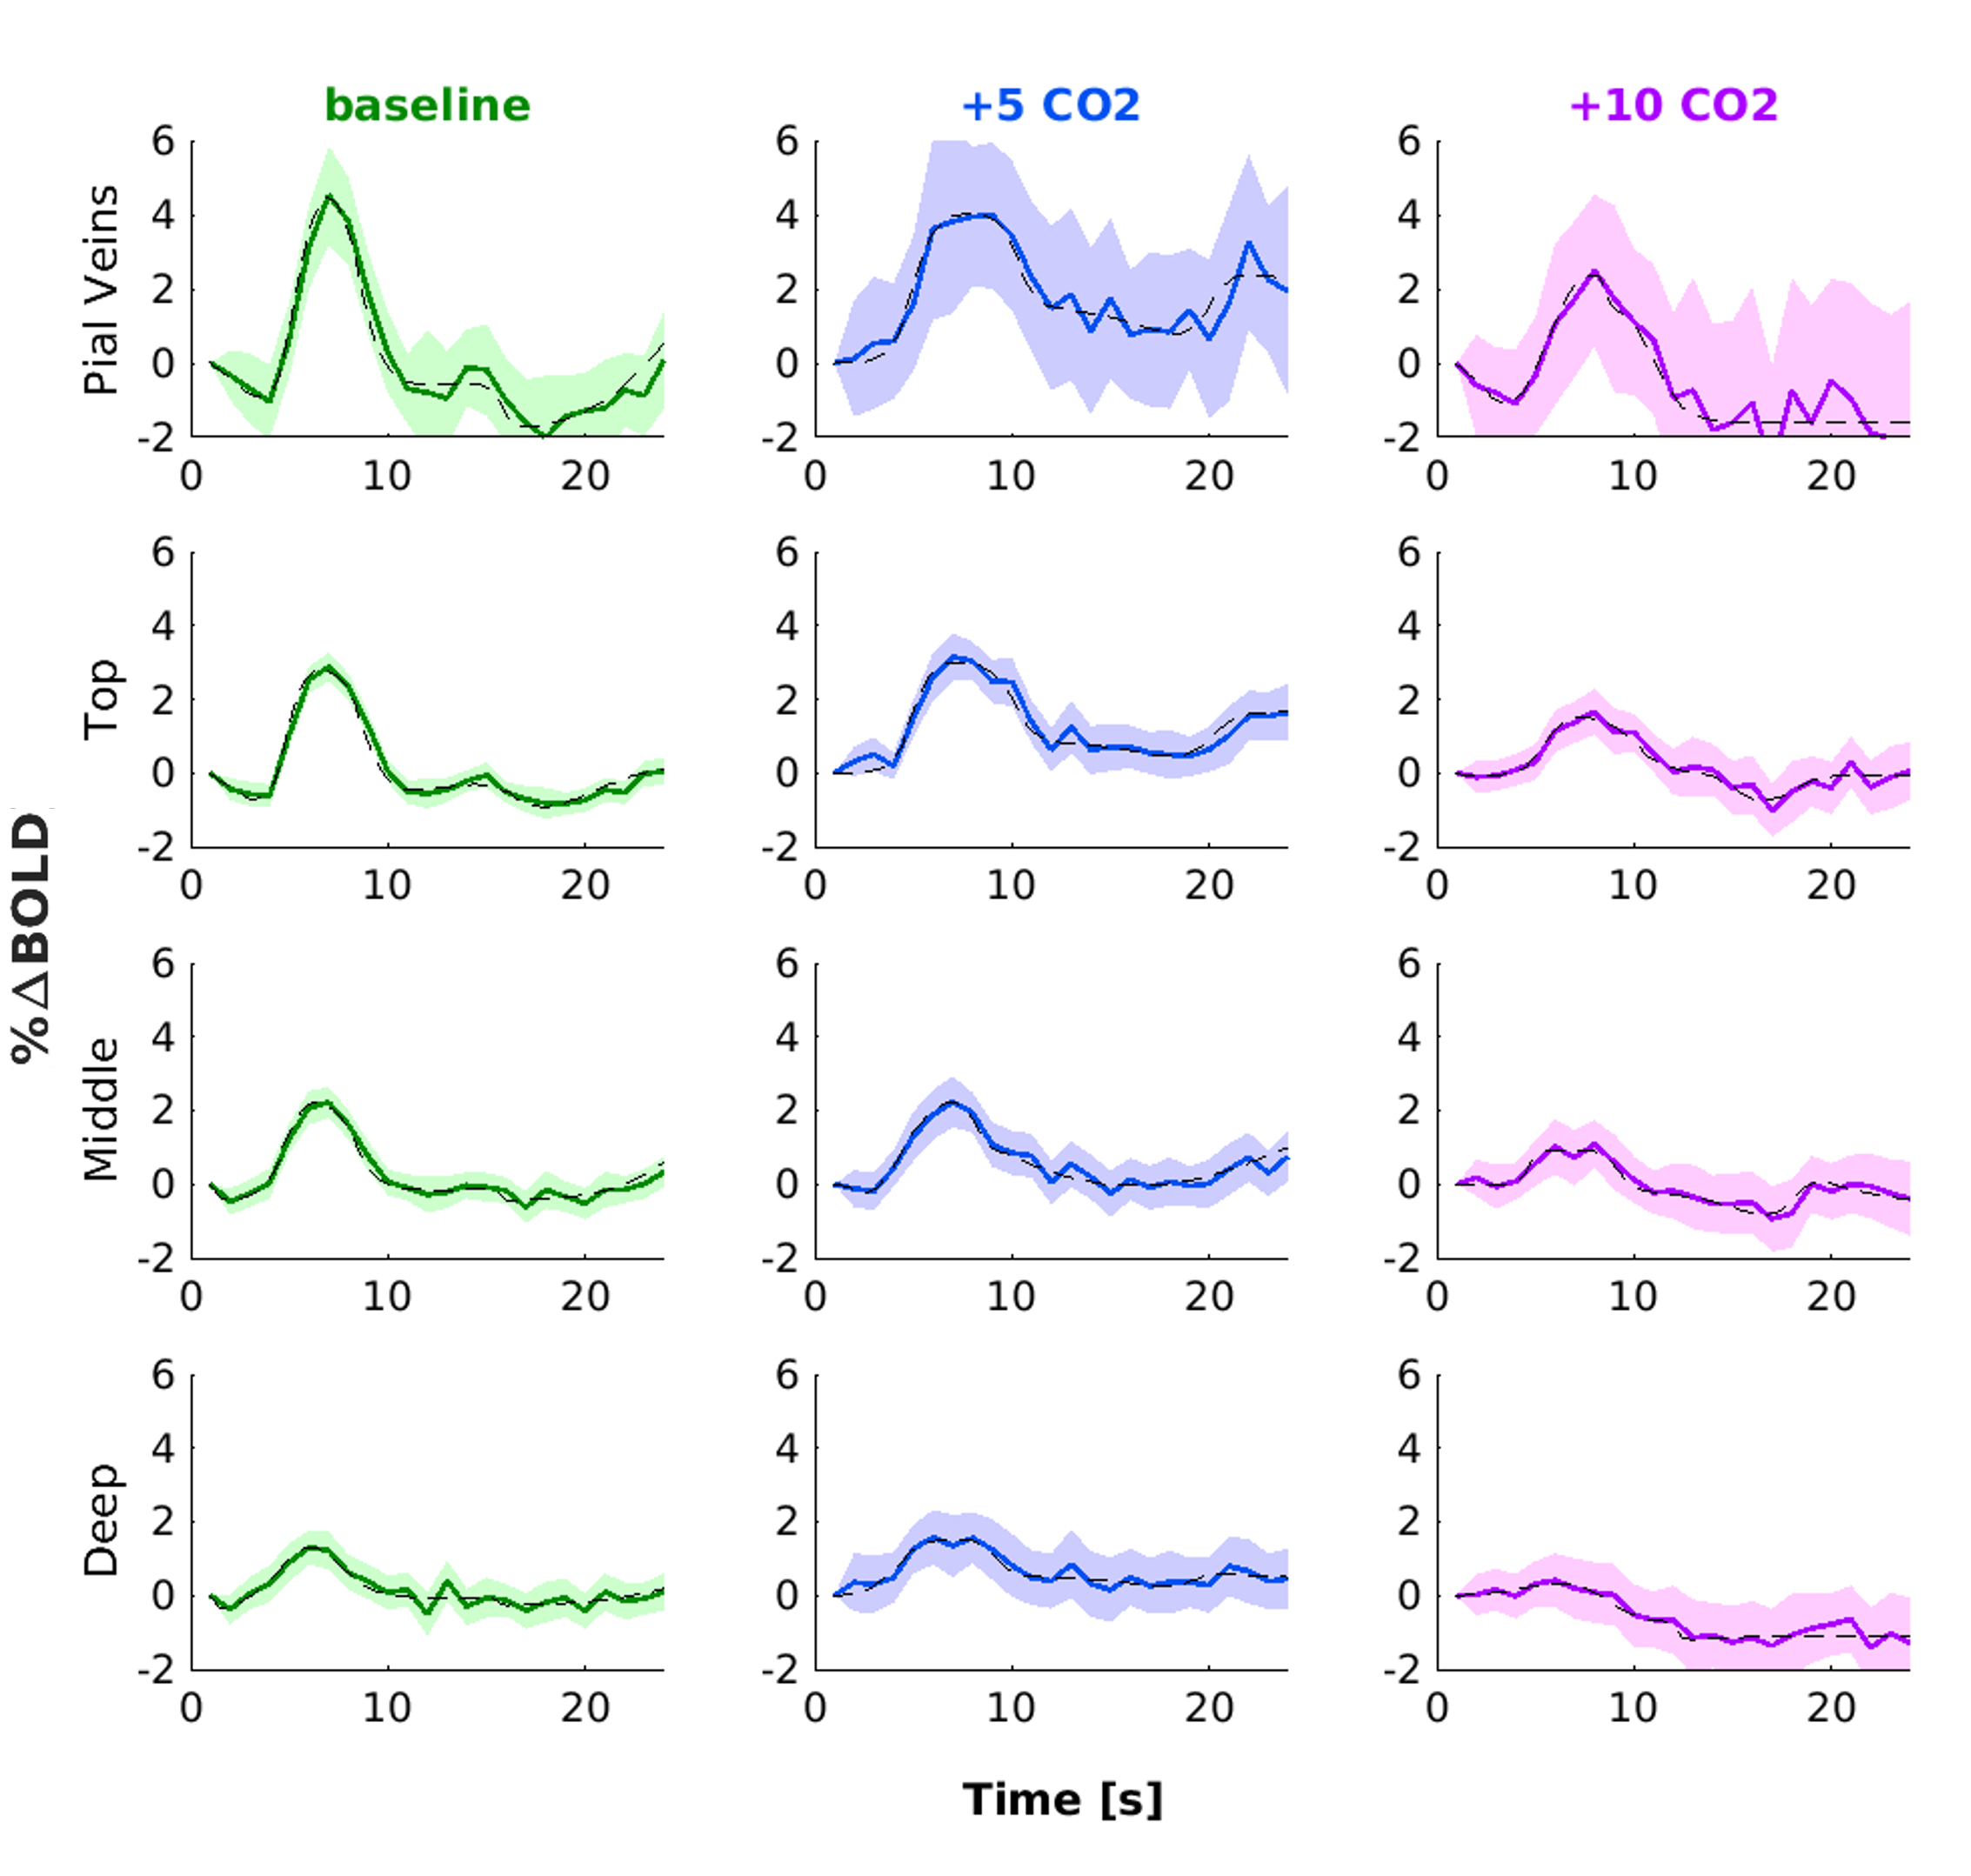
Functional analysis: A General Linear Model was used to obtain estimates of the percent BOLD signal increase following hyperoxia and hypercapnia, using the end-tidal gas traces (∆PetCO2) as regressors. The estimated weights correspond with the O2-response (CVRo2) and CVRco2 in %∆BOLD/mmHg. Subsequently, the HRF curves were estimated with a Finite Impulse Response11-13. These HRFs were quantified with the amplitude and time-to-peak (TTP). The estimated HRF amplitudes were divided by the amplitude of the CVRo2 to account for CBVv0 dependence14 in the BOLD signal and extract the neuronal component of the HRF15-17.
Results
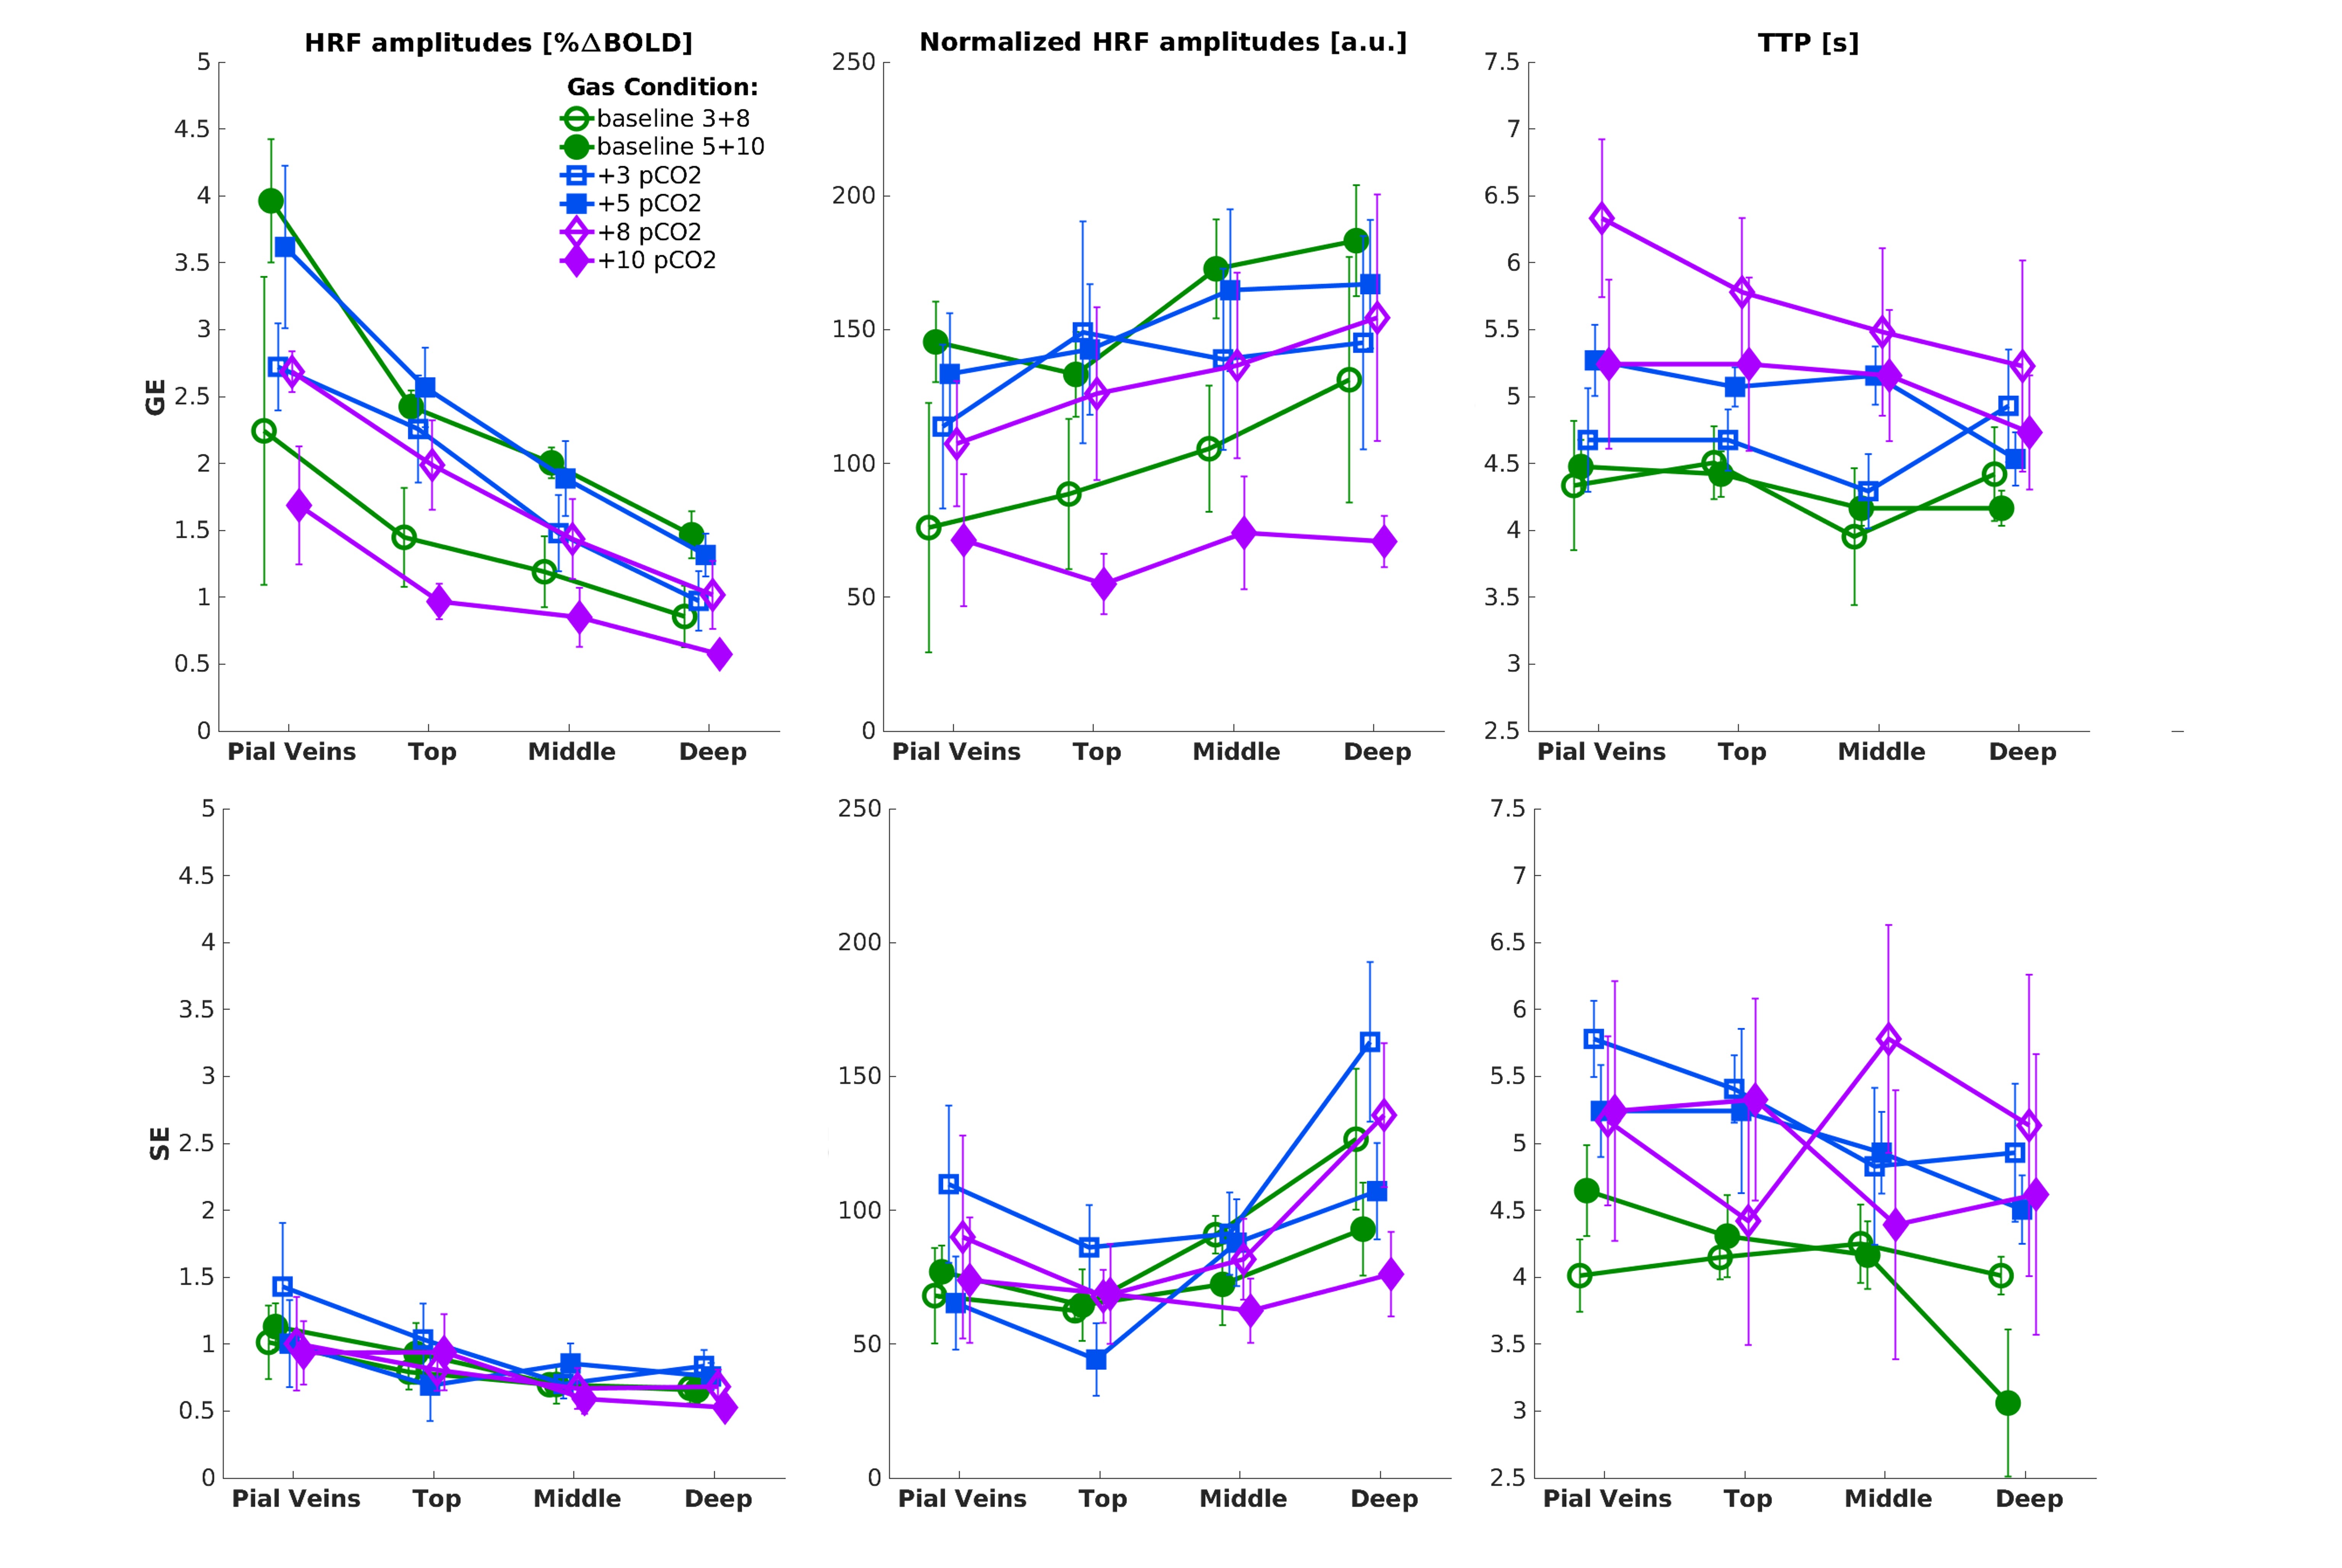
We found that the magnitude of CVRo2 was higher for GE (mean=0.017, se=0.002) compared to SE (mean=0.010, se=1e-4) with increasing difference from deeper laminae to top laminae and pial veins (F(1,5)=13.2, p=0.014). Additionally, a linear increase in CVRo2 towards the pial surface was observed for GE (z=-7.8, pHolm<0.001) and SE (z=-2.8, pHolm=0.006). A similar trend was observed for CVRco2 for GE (z=-7.8, pHolm<0.001), but not for SE (z=-1.6, pHolm<0.15). For the estimated HRFs to the visual task, we found larger HRF amplitudes for GE (mean=2.05, se=0.18) in comparison with SE (mean=0.91, se=0.8) (F(1,5)=40.7, p=0.001). HRF amplitudes are linearly increasing towards the pial surface for GE (z=-8.3, pHolm<0.001) but not for SE (z=-1.7, pHolm=0.096). The CBVv0 normalized HRF amplitudes showed no difference between sequences (F(1,5)=6.0, p=0.056), but an inverse relationship across cortical depth was found; decreasing from deeper laminae towards the pial surface (z=3.1, pHolm=0.005). No difference was observed in TTP between scan sequence (F(1,4)=0.21, p=0.67) nor across cortical depth (F(3,15)=2.44, p=0.105).Discussion
We investigated the contribution of micro-vessels, intra-cortical veins, and pial veins on the BOLD signal formation during visual stimulation and different breathing tasks. We found an increase in relative macro-vascular CBVv0 from deeper laminae to top laminae and pial veins, as measured by the GE-CVRo2 compared with SE-CVRo2 (Fig.4.). Hypercapnia mainly affected the macro-vasculature and to a lesser extent the capillaries, as seen by the CVRco2 (Fig.4.), suggesting that vessel reactivity is proportional to vessel size or composition.The well-known GE HRF amplitude increase towards the pial surface was observed17-19, and was extended in this study with the pial veins, which displayed an even more prominent increase (Fig.5.). Drainage effects could be another factor contributing to this HRF amplitude increase. However, in this study, no significant differences in TTP (Fig.5.) were observed between sequences nor across cortical depth suggesting that the CBVv0 was the main contributor to the GE-BOLD HRF amplitude which is consistent with recently published models20. No difference in normalized HRF amplitude was found between GE and SE (Fig.5.). This implies that the CBVv0 contribution of the macro-vasculature is reduced, and the signal changes rather reflect the visual task, making the CBVv0-normalization preferable for investigation of brain metabolism.
Conclusion
We found that the BOLD signal from the macro-vasculature, as measured with GE-BOLD, is affected by CBVv0 as we observed a linear HRF amplitude increase from deeper laminae to top laminae and pial veins, which coincides with an increase in CVRo2. In contrast, the SE-BOLD contained limited purely vascular contributions. Therefore, the BOLD signal caused by the micro-vasculature predominantly reflects neuronal processes. Normalization of GE-BOLD signals by CBVv0 yields a similar laminar profile as SE-BOLD.Acknowledgements
This work was supported by the National Institute of Mental Health of the National Institutes of Health under award number R01MH111417.References
[1] S. Ogawa, T.-M. Lee, A. R. Kay, and D. W. Tank, “Brain magnetic resonance imaging with contrast dependent on blood oxygenation,” proceedings of the National Academy of Sciences, vol. 87, no. 24, pp. 9868–9872, 1990.
[2] K. K. Kwong, J. W. Belliveau, D. A. Chesler, I. E. Goldberg, R. M. Weisskoff, B. P. Poncelet, D. N. Kennedy, B. E. Hoppel, M. S. Cohen, and R. Turner, “Dynamic magnetic resonance imaging of human brain activity during primary sensory stimulation.,” Proceedings of the National Academy of Sciences, vol. 89, no. 12, pp. 5675–5679, 1992.
[3] H. M. Duvernoy, S. Delon, and J. Vannson, “Cortical blood vessels of the human brain,” Brain research bulletin, vol. 7, no. 5, pp. 519–579, 1981.
[4] F. Reina-De La Torre, A. Rodriguez-Baeza, and J. Sahuquillo-Barris, “Morphological characteristics and distribution pattern of the arterial vessels in human cerebral cortex: a scanning electron microscope study,” The Anatomical Record: An Official Publication of the American Association of Anatomists, vol. 251, no. 1, pp. 87–96, 1998.
[5] H. Duvernoy, S. Delon, and J. Vannson, “The vascularization of the human cerebellar cortex,” Brain research bulletin, vol. 11, no. 4, pp. 419–480, 1983.
[6] J. Budde, G. Shajan, M. Zaitsev, K. Scheffler, and R. Pohmann, “Functional mri in human subjects with gradient-echo and spin-echo epi at 9.4 t,” Magnetic resonance in medicine, vol. 71, no. 1, pp. 209–218, 2014.
[7] T. Q. Duong, E. Yacoub, G. Adriany, X. Hu, K. Uˇgurbil, and S.- G. Kim, “Microvascular bold contribution at 4 and 7 t in the human brain: gradient-echo and spin-echo fmri with suppression of blood effects,” Magnetic Resonance in Medicine: An Official Journal of the International Society for Magnetic Resonance in Medicine, vol. 49, no. 6, pp. 1019–1027, 2003.
[8] L. R. Huber, B. A. Poser, P. A. Bandettini, K. Arora, K. Wagstyl, S. Cho, J. Goense, N. Nothnagel, A. T. Morgan, J. Van Den Hurk, et al., “Laynii: a software suite for layer-fmri,” NeuroImage, vol. 237, p. 118091, 2021.
[9] M. Bernier, S. C. Cunnane, and K. Whittingstall, “The morphology of the human cerebrovascular system,” Human brain mapping, vol. 39, no. 12, pp. 4962–4975, 2018.
[10] J. M. Huntenburg, C. J. Steele, and P.-L. Bazin, “Nighres: processing tools for high-resolution neuroimaging,” GigaScience, vol. 7, no. 7, p. giy082, 2018.
[11] C. Goutte, F. A. Nielsen, and K. Hansen, “Modeling the hemodynamic response in fmri using smooth fir filters,” IEEE transactions on medical imaging, vol. 19, no. 12, pp. 1188–1201, 2000.
[12] G. H. Glover, “Deconvolution of impulse response in event-related bold fmri1,” Neuroimage, vol. 9, no. 4, pp. 416–429, 1999.
[13] B. Bai, P. Kantor, and A. Shokoufandeh, “Effectiveness of the finite impulse response model in content-based fmri image retrieval,” in International Conference on Medical Image Computing and Computer-Assisted Intervention, pp. 742–750, Springer, 2007.
[14] P. A. Bandettini and E. C. Wong, “Effects of biophysical and physiologic parameters on brain activation-induced r2* and r2 changes: simulations using a deterministic diffusion model,” International Journal of Imaging Systems and Technology, vol. 6, no. 2-3, pp. 133–152, 1995.
[15] D. Bulte, P. Chiarelli, R. Wise, and P. Jezzard, “Measurement of cerebral blood volume in humans using hyperoxic mri contrast,” Journal of Magnetic Resonance Imaging: An Official Journal of the International Society for Magnetic Resonance in Medicine, vol. 26, no. 4, pp. 894– 899, 2007.
[16] P. A. Chiarelli, D. P. Bulte, R. Wise, D. Gallichan, and P. Jezzard, “A calibration method for quantitative bold fmri based on hyperoxia,” Neuroimage, vol. 37, no. 3, pp. 808–820, 2007.
[17] J. R. Polimeni, B. Fischl, D. N. Greve, and L. L.Wald, “Laminar analysis of 7 t bold using an imposed spatial activation pattern in human v1,” Neuroimage, vol. 52, no. 4, pp. 1334–1346, 2010.
[18] C. J. Gauthier, C. Madjar, F. B. Tancredi, B. Stefanovic, and R. D. Hoge, “Elimination of visually evoked bold responses during carbogen inhalation: implications for calibrated mri,” Neuroimage, vol. 54, no. 2, pp. 1001–1011, 2011.
[19] J. C. Siero, N. F. Ramsey, H. Hoogduin, D. W. Klomp, P. R. Luijten, and N. Petridou, “Bold specificity and dynamics evaluated in humans at7 t: comparing gradient-echo and spin-echo hemodynamic responses,” PLoS One, vol. 8, no. 1, p. e54560, 2013.
[20] M. Havlicek and K. Uluda˘g, “A dynamical model of the laminar bold response,” NeuroImage, vol. 204, p. 116209, 2020.
Figures
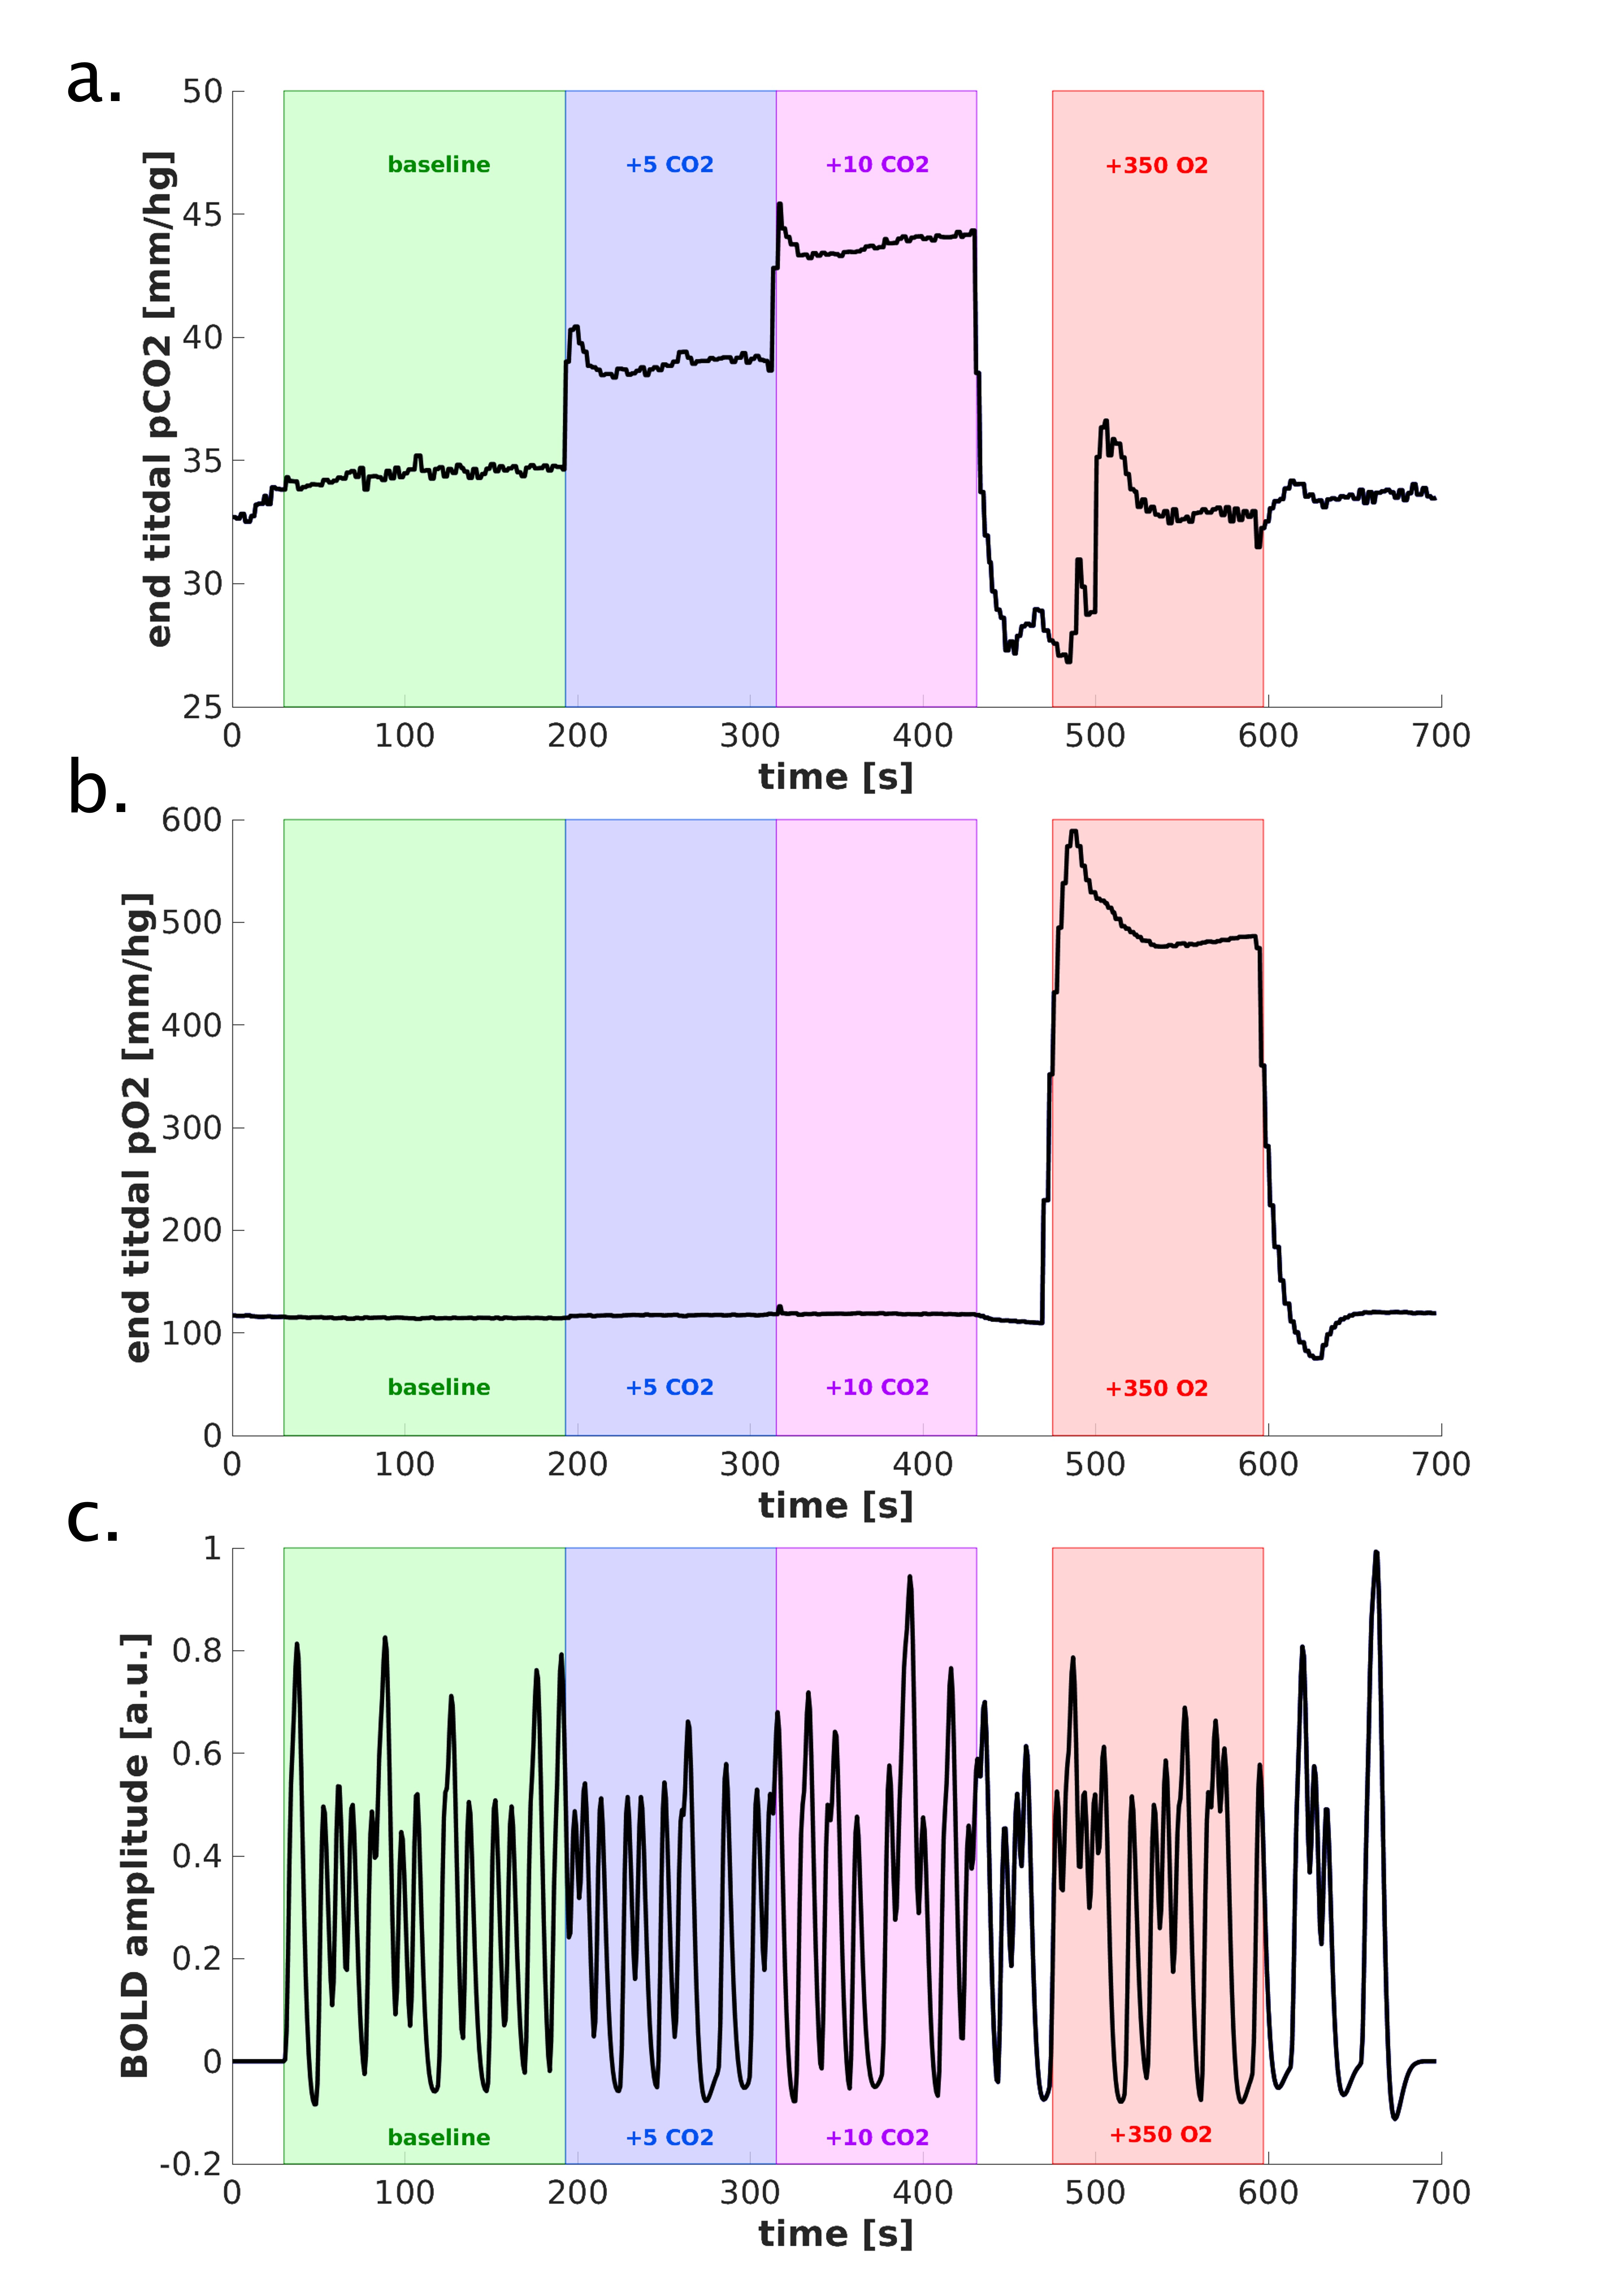
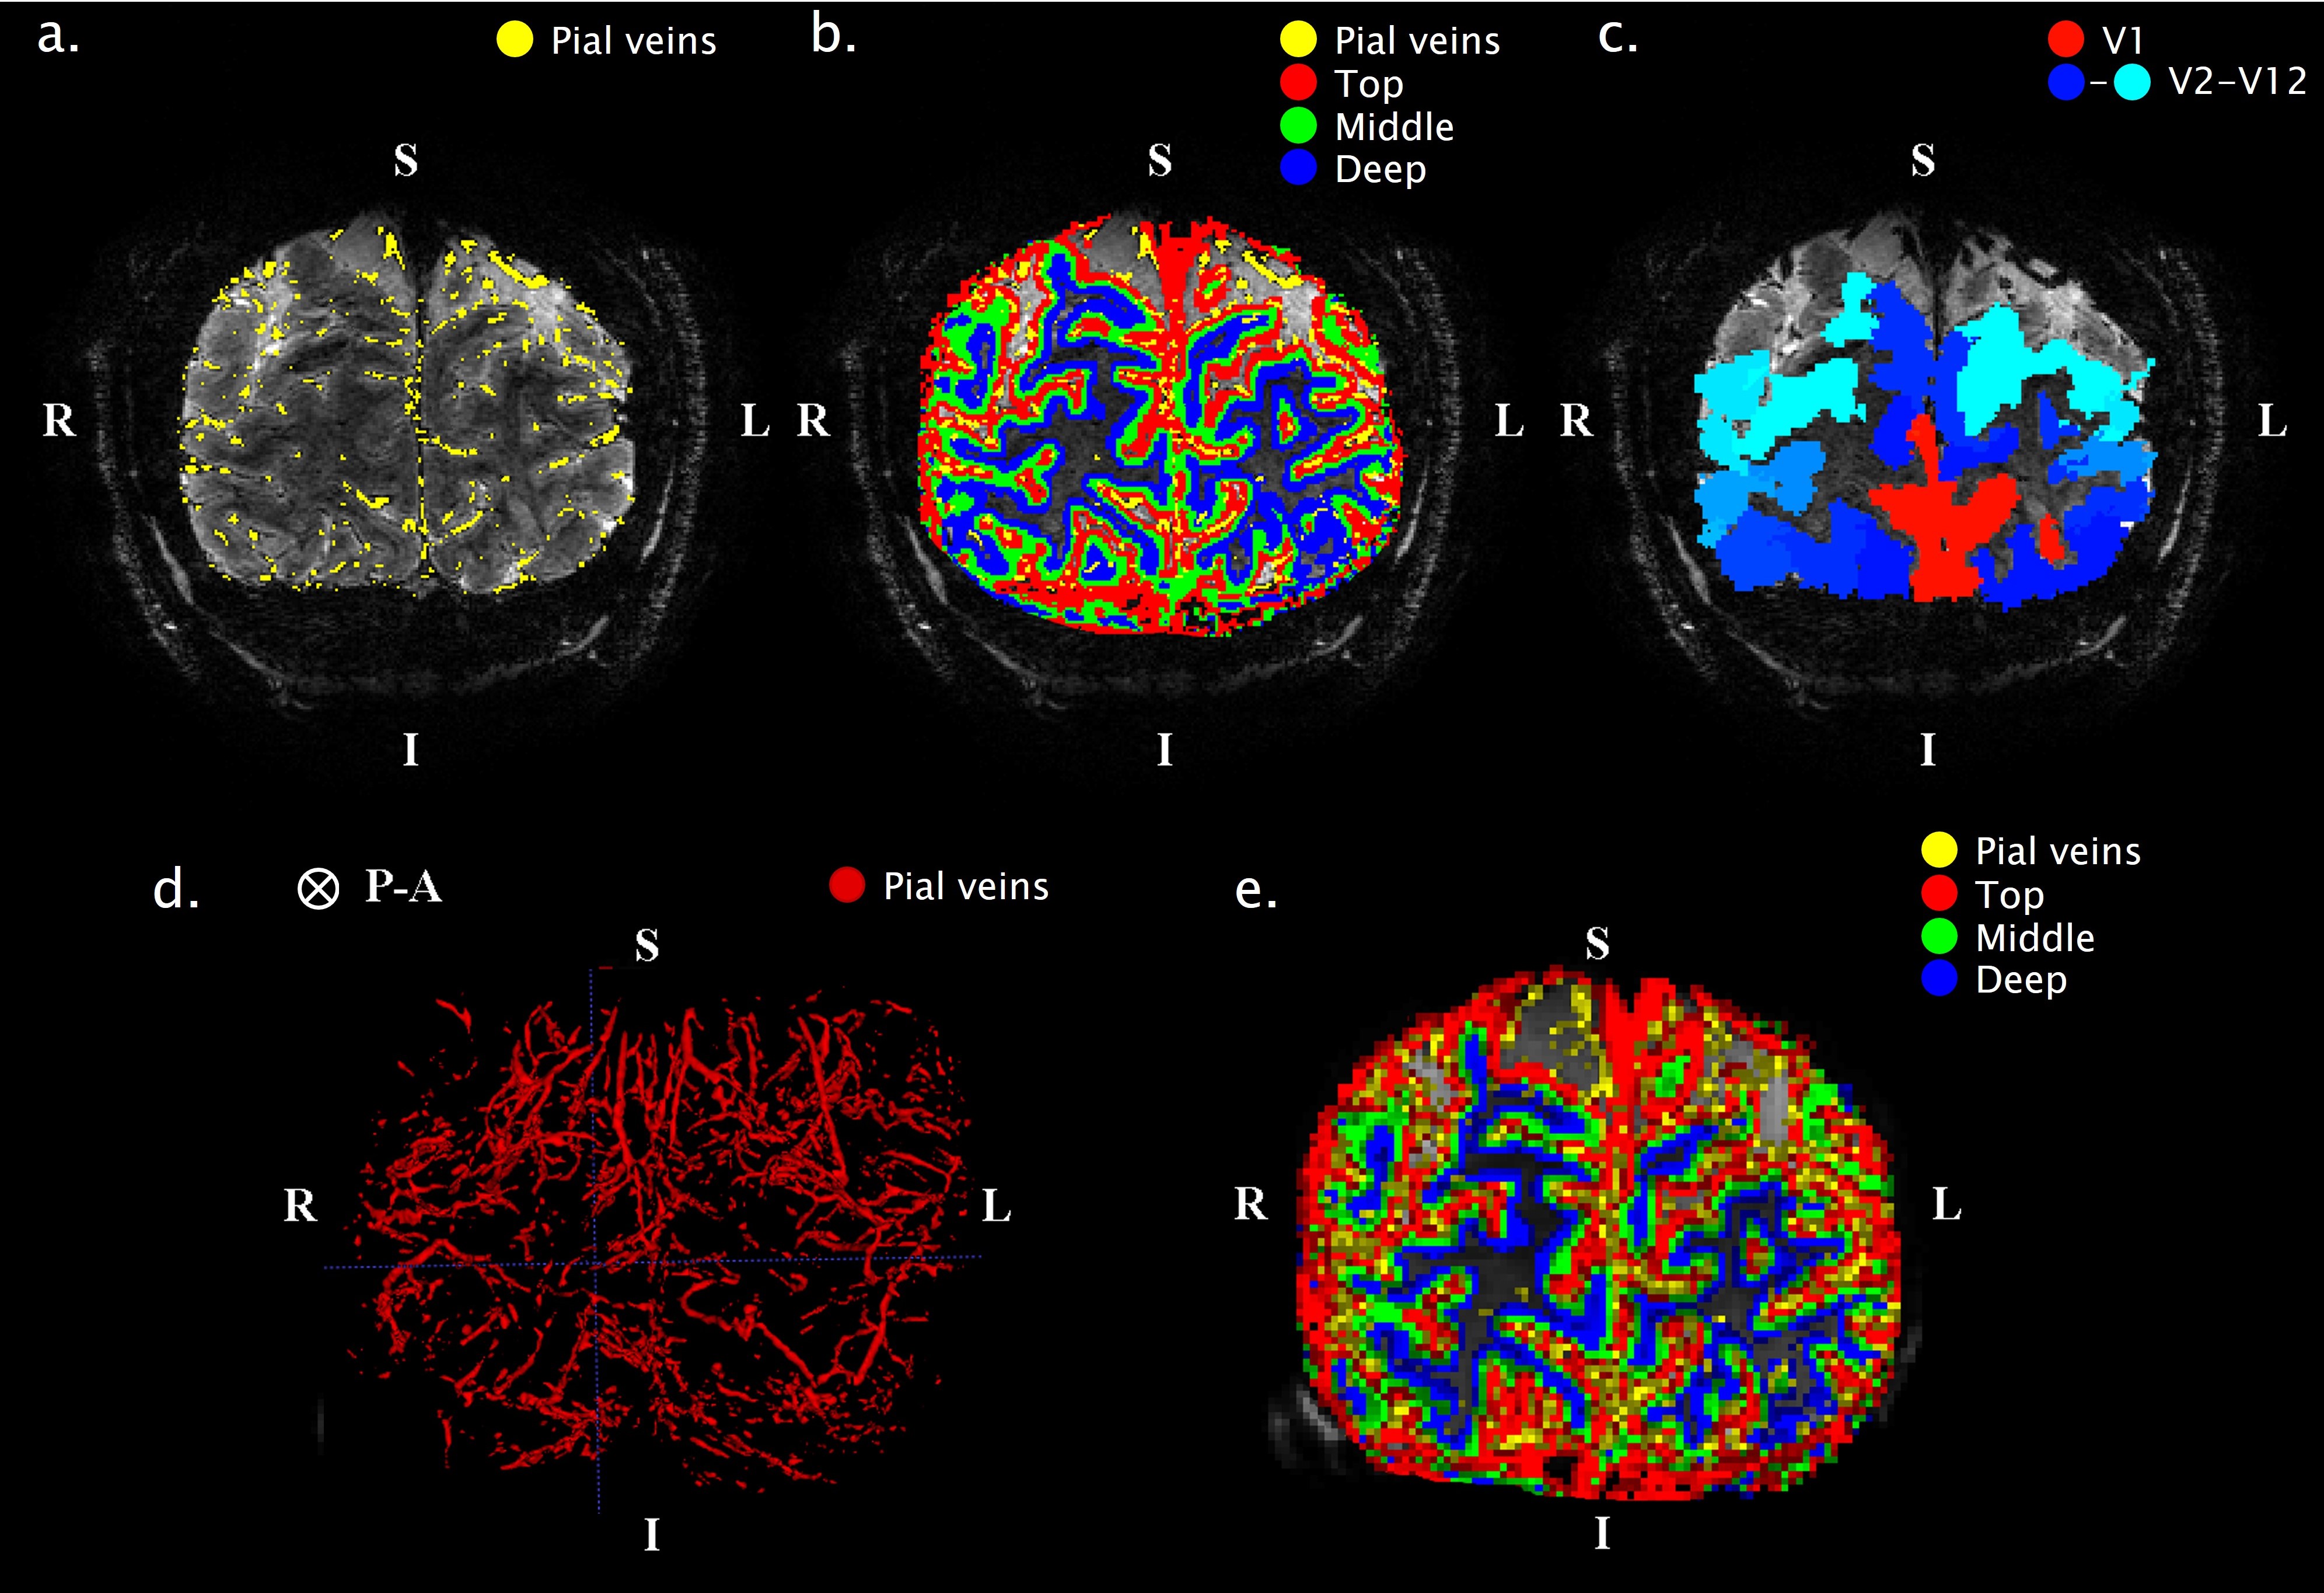
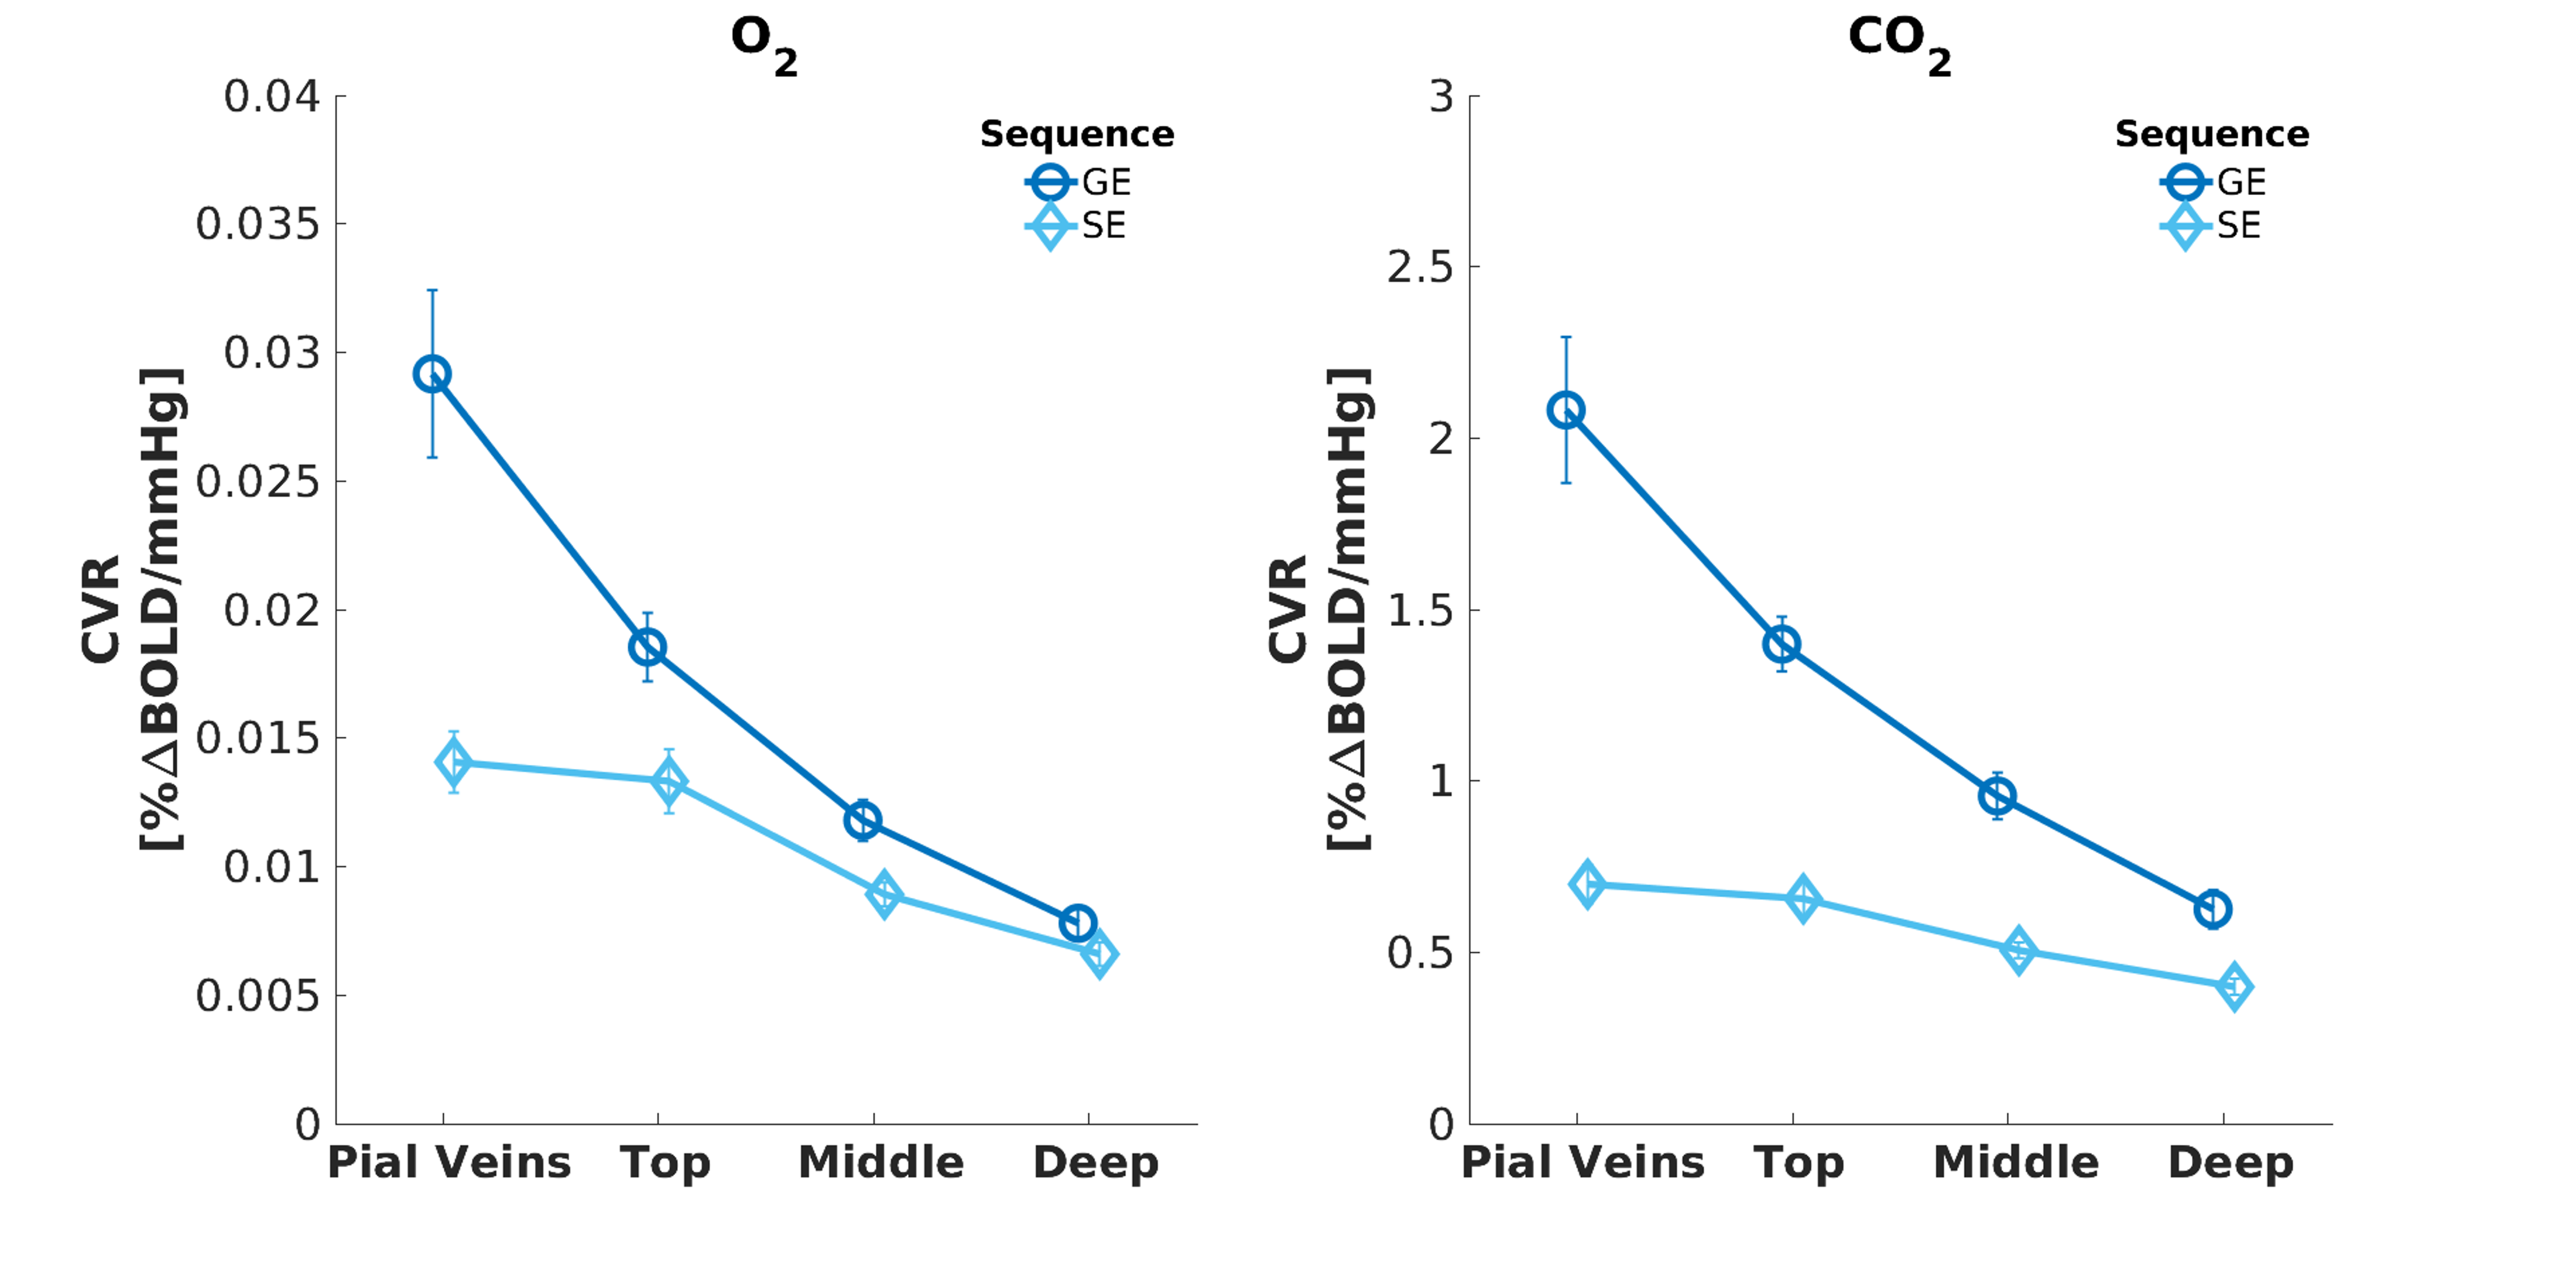
Fig. 3. Mean CVR to O2* (left panel) and CO2 (right panel) breathing tasks acquired with GE (dark blue) and SE (light blue). The error bars refer to the standard error of the mean (SEM) across participants. *Reactivity to O2 is strictly no vascular reactivity.