0528
Negative BOLD closely follows neuronal suppression in superior colliculus1Champalimaud Research, Champalimaud Centre for the Unknown, Lisbon PT, Lisbon, Portugal
Synopsis
The underlying sources of negative BOLD responses (NBRs) are still debated. Here, we show rat superior colliculus (SC) NBRs associated with visual stimulation at short inter-stimulus intervals (ISIs) along with decreases in power of local field potentials and multi-unit activity signals measured in this region. This hints to neuronal suppression, possibly due to impossibility of complete excitability recovery upon short ISIs, associated with NBRs. Moreover, both NBRs and electrophysiological power time profiles reveal one peak after stimulus started and another when it ceased, highlighting the SC nature of detecting "brightness changes" when individual flashes are no longer perceivable.
Introduction
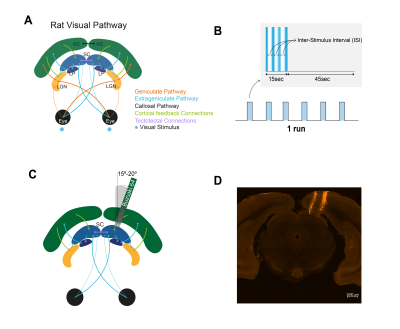
Positive BOLD Responses (PBRS) typically correlate well with increases in local field potentials (LFPs) and multi-unit activity (MUA) signals1,2. By contrast, the biological underpinnings of Negative BOLD Responses (NBRs) remain debated3-9, with hypotheses ranging from vascular “blood stealing” to neuronal inhibition. Here, functional MRI (fMRI) and electrophysiology were performed upon rat visual stimulation (Fig.1A) to investigate the origins of NBRs. Superior colliculus (SC) is known to suffer strong signal suppression upon increasing stimulus frequency, which we hypothesized should lead to strong NBRs. Furthermore, we investigated the fine structure in the NBRs, as SC neurons respond to onset/offsets of light stimulus10-13.Methods
Animal experiments were preapproved by institutional and national authorities and were carried out according to European Directive 2010/63.Adult Long Evans rats were sedated with medetomidine while temperature and respiration rate were monitored.
Stimulation: A blue LED (𝜆=470nm) was used for binocular stimulation with inter-stimulus intervals (ISIs) of 990, 56 and 30ms. The stimulation paradigm is shown in Fig.1B.
MRI: A 9.4T BioSpec scanner (Bruker, Germany) with an 86mm quadrature resonator for transmittance and a 4-element array cryoprobe14-15 (Bruker, Switzerland) for signal reception was used. fMRI was acquired at 95%O2 with a SE-EPI sequence (TRslow/TRfast=1500/500ms; TE=40ms; FOV=18x16.1mm2, resolution=268x268μm2, slice thickness=1.5mm, tacq=6m45s).
Electrophysiology: A NeuroNexus Buzsaki 64 channel probe (8 shanks) was stained with DiI (for post-hoc histological validation) and inserted at a 15-20° angle through the cortex (Fig.1C-D) until reaching the superficial layers of the right SC. Recordings were performed using the OpenEphys software (fsampling=30 kHz).
Data Analysis:
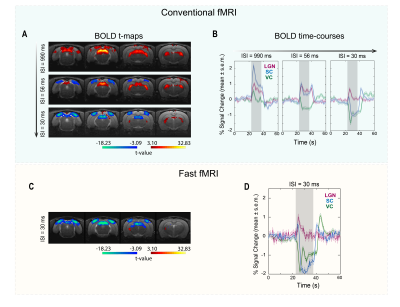
- fMRI: Data were pre-processed with manual outlier identification and correction; slice-timing correction; small spatial smoothing (3D Gaussian kernel, FWHM=0.268mm isotropic); mean volume realignment and co-registration to a T2-weighted anatomical reference. An HRF peaking at 1s was convolved with the paradigm. A minimum significance level of 0.001 (FDR-corrected) with a minimum cluster size of 20 voxels were used. Time-courses were calculated by manually drawing atlas-based16 ROIs (Fig.2B and 2D) and detrending individual runs with a 5th-order polynomial fit to resting periods.
- Electrophysiology: A notch filter (50, 100 and 150Hz) was applied to electrophysiological signals and the power spectral density was estimated every 2Hz by Welch’s periodogram, applying a 1s sliding window with 50% overlap. The area under the LFP (0.1-150Hz) and MUA (300-3000Hz) frequency bands for the three most medial shanks (where the strongest responses were concentrated) was taken along time for power calculation.
Results
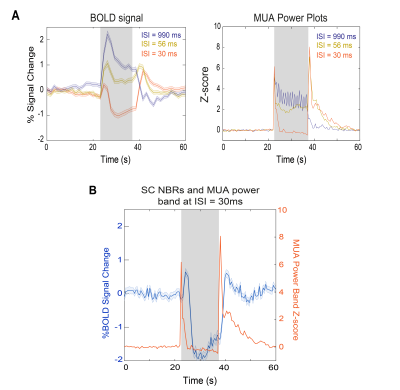
SC BOLD responses for different ISIs are shown in Fig.2. At long ISI, strong PBRs are evident in all visual pathway junctions. However, as the ISI decreases, the t-maps (Fig.2A) evidence strong NBRs, first cortical (ISI=56ms) and then in SC (ISI=30ms). When the SC shape of BOLD response is examined (Fig.2B) a dramatic modulation becomes apparent, with two strong positive peaks surrounding a decreasing (and increasingly negative) BOLD signal. To further assess the BOLD signal dynamics, a fast fMRI acquisition (Fig.2C-D) was acquired. While the t-maps of this fast acquisition (Fig.2C) closely resemble the maps of the conventional fMRI acquisition, the dynamics become clearer, evidencing a PBR peak ~2s after stimulus started, followed by a ~1.5% negative BOLD amplitude and the second PBR peak, ~3.5s after stimulus cessation (Fig.2D). To investigate the origins of these dynamics, we performed electrophysiology recordings under similar conditions. Two LFP median traces from one representative animal (Fig.3A-B) show at long ISIs, strong individual flash-induced LFP oscillations, while at shorter ISIs, strong oscillations are evident only at the temporal “edges” of the stimulation period (highlighted in Fig.3B). LFP and MUA frequency power plots (Fig.3C) corroborate the appearance of two sudden power increases at the beginning and after the end of stimulation. We then directly compared the BOLD modulations and MUA power plots (Fig.4). Close similarities in the shape of the responses are evident: whilst at short ISIs a two-peak profile is present in both curves at the edges of stimulation period (fast fMRI acquisition shows BOLD peaks delayed from measured power peaks by 1.5-2s); during stimulation, NBRs negative deflection is concurrent with strong MUA power reductions.Discussion
We report PBR-NBR transitions in SC with decreasing ISI, which, to our knowledge, is the first observation of its kind for a subcortical structure in rodents. Importantly, the LFP/MUA power plots clearly track the PBR-NBR transition with power decreases measured at the NBRs regime suggesting a close relationship between neuronal suppression and the decrease in BOLD signal (larger negative values). The measured short-ISI power reduction is consistent with the observed “response habituation” phenomenon reported where decreased SC responses were associated with incomplete excitability recovery17-19. As 50% of superficial SC cells are GABAergic17-21 this effect could rely on intrinsic inhibitory mechanisms. Furthermore, the two flanking peaks in SC are corroborated by the electrophysiological results, and can likely be ascribed to sharp onset/offset signals10-13 when individual flashes are no longer perceivable and only brightness changes are encoded in SC.Conclusions
SC NBRs at short ISI regime agree with LFP/MUA frequency bands power reduction. The two flanking peaks are likely strong ON/OFF responses, which should be considered when modelling BOLD signals. Overall, local neuronal suppression appears to be associated with measured SC NBRs.Acknowledgements
The first and second authors contributed equally to the presented work.
The authors would like to thank Francisca Fernandes for the help in fMRI data analysis.
References
[1] Goense, Jozien BM, and Nikos K. Logothetis. "Neurophysiology of the BOLD fMRI signal in awake monkeys." Current Biology 18.9 (2008): 631-640;
[2] Logothetis, Nikos K., et al. "Neurophysiological investigation of the basis of the fMRI signal." nature 412.6843 (2001): 150-157;
[3] Sten, Sebastian, et al. "Neural inhibition can explain negative BOLD responses: A mechanistic modelling and fMRI study." NeuroImage 158 (2017): 219-231;
[4] Northoff, Georg, et al. "GABA concentrations in the human anterior cingulate cortex predict negative BOLD responses in fMRI." Nature neuroscience 10.12 (2007): 1515;
[5] Shmuel, Amir, et al. "Negative functional MRI response correlates with decreases in neuronal activity in monkey visual area V1." Nature neuroscience 9.4 (2006): 569;
[6] Harel, Noam, et al. "Origin of negative blood oxygenation level—dependent fMRI signals." Journal of cerebral blood flow & metabolism 22.8 (2002): 908-917;
[7] Schridde, Ulrich, et al. "Negative BOLD with large increases in neuronal activity." Cerebral cortex 18.8 (2007): 1814-1827;
[8] Bailey, Christopher J., et al. "Analysis of time and space invariance of BOLD responses in the rat visual system." Cerebral cortex 23.1 (2013): 210-222;
[9] Goense, Jozien, Hellmut Merkle, and Nikos K. Logothetis. "High-resolution fMRI reveals laminar differences in neurovascular coupling between positive and negative BOLD responses." Neuron 76.3 (2012): 629-639;
[10] Seabrook, Tania A., et al. "Architecture, function, and assembly of the mouse visual system." Annual review of neuroscience 40 (2017): 499-538;
[11] Cang, Jianhua, et al. "Visual function, organization, and development of the mouse superior colliculus." Annual review of vision science 4 (2018): 239-262;
[12] De Franceschi, Gioia, and Samuel G. Solomon. "Visual response properties of neurons in the superficial layers of the superior colliculus of awake mouse." The Journal of physiology 596.24 (2018): 6307-6332;
[13] Bytautiene, Juntaute, and Gytis Baranauskas. "Rat superior colliculus neurons respond to large visual stimuli flashed outside the classical receptive field." PloS one 12.4 (2017): e0174409;
[14] Niendorf, Thoralf, et al. "Advancing cardiovascular, neurovascular and renal magnetic resonance imaging in small rodents using cryogenic radiofrequency coil technology." Frontiers in pharmacology 6 (2015): 255;
[15] Baltes, Christof, et al. "Micro MRI of the mouse brain using a novel 400 MHz cryogenic quadrature RF probe." NMR in Biomedicine: An International Journal Devoted to the Development and Application of Magnetic Resonance In vivo22.8 (2009): 834-842;
[16] Paxinos, George, and Charles Watson. The rat brain in stereotaxic coordinates: hard cover edition. Elsevier, 2006;
[17] Binns KE, Salt TE. Different roles for GABAA and GABAB receptors in visual processing in the rat superior colliculus. J Physiol. 1997;504 ( Pt 3)(Pt 3):629-639. doi:10.1111/j.1469-7793.1997.629bd.x;
[18] Dyer, Robert S., and Zoltan Annau. "Flash evoked potentials from rat superior colliculus." Pharmacology Biochemistry and Behavior 6.4 (1977): 453-459;
[19] Todorov, Mihail I., et al. "Retino‐cortical stimulus frequency‐dependent gamma coupling: evidence and functional implications of oscillatory potentials." Physiological reports4.19 (2016): e12986;
[20] Binns, K. E., and T. E. Salt. "Excitatory amino acid receptors modulate habituation of the response to visual stimulation in the cat superior colliculus." Visual neuroscience 12.3 (1995): 563-571;
[21] Okada, Yasuhiro. "Distribution of γ-aminobutyric acid (GABA) in the layers of superior colliculus of the rabbit." Brain Research 75.2 (1974): 362-365.
Figures


