0527
Functional activities detected in the olfactory bulb and associated olfactory regions in the human brain using T2-prepared BOLD fMRI at 7T1Neurosection, Division of MRI Research, Russell H. Morgan Department of Radiology and Radiological Science, Johns Hopkins University School of Medicine, Baltimore, MD, United States, 2F.M. Kirby Research Center for Functional Brain Imaging, Kennedy Krieger Institute, Baltimore, MD, United States, 3Department of Neurology, Johns Hopkins University School of Medicine, Baltimore, MD, United States, 4Department of Biomedical Engineering, Johns Hopkins University School of Medicine, Baltimore, MD, United States, 5Department of Psychiatry and Behavioral Sciences, Johns Hopkins University School of Medicine, Baltimore, MD, United States, 6Department of Radiology, Johns Hopkins University School of Medicine, Baltimore, MD, United States
Synopsis
Conventional EPI-based BOLD fMRI can be challenging in olfaction related brain regions, such as the olfactory bulb (OB), mainly due to the large susceptibility artifacts. To date, few studies have demonstrated successful fMRI in the human OB. T2-prepared (T2prep) BOLD fMRI is an alternative approach developed especially for reducing such susceptibility artifacts. Here, olfactory fMRI was performed at 7T in 14 healthy participants. T2prep-BOLD showed greater functional sensitivity than GRE-EPI-BOLD in the OB and associated olfactory regions. Habituation effects and a bi-phasic pattern of fMRI signal changes were observed using T2prep-BOLD, which showed a good intra-subject reproducibility.
Introduction
Olfactory deficits have emerged as an early risk factor in many brain diseases[1-3] and aging[4]. BOLD-fMRI using conventional EPI based sequences can be challenging in brain regions important for olfactory processing, such as the olfactory bulb and orbitofrontal cortex, mainly due to the signal dropout and distortion artifacts caused by large susceptibility effects. To date, few studies have demonstrated successful fMRI in the olfactory bulb in humans. T2-prepared (T2prep) BOLD-fMRI[5] is an alternative approach developed especially for performing fMRI in regions affected by large susceptibility artifacts. In this study, functional activation in olfactory-eloquent brain regions, especially the OB, was assessed using T2prep-BOLD-fMRI.Methods
Olfactory fMRI scans were performed at 7T in 14 healthy participants (47±11yo, 8 females). All participants had normal olfactory function as assessed by the University of Pennsylvania Smell Identification Test (UPSIT) score[6]. The following scans were performed in each participant: a) T2prep-BOLD-fMRI[7]: TR=2000ms, TEprep= 50ms, voxel=1.5x1.5x1.5mm3, 84 slices; b) GRE-EPI-BOLD-fMRI: same resolution and TR, TE=22ms, flip-angle=70o, 33 slices; c) MPRAGE: TR/TI/TE=4500/563/1.81ms, voxel=1x1x1mm3. T2prep-BOLD-fMRI was repeated once within 3-6 weeks to assess its reproducibility.Olfactory paradigm: An enhanced computer-controlled olfactometer[8] was used to deliver the odorants in precisely timed pulses. The olfactory paradigm started with a stimulus-off period of 60s with odorless mineral oil, followed by three blocks of a stimulus-on period of 60s with Phenyl-Ethyl-Alcohol and a stimulus-off period of 120s with odorless mineral oil (total duration 10min). The relatively long stimulation period was chosen to evaluate habituation effects in the olfactory system. All participants were instructed to breathe passively through the nose and avoid sniffing.
Data analysis was performed mainly using the SPM12 software package and Matlab (2017a) routines. Realignment and spatial smoothing (kernel of 4mm) were performed for all fMRI images. An independent-component-analysis (ICA) based denoising approach [9] was performed on the fMRI data using FSL6.0.1, from which components related to motion and physiological noise were removed. Temporal filtering was performed using a low-pass filter with a cut-off frequency of 0.03Hz. The Automated Anatomical Labelling (AAL) atlas[10] was used to identify the primary and secondary olfactory regions in the brain according to the literature[11]. Since the olfactory bulb is not included in the AAL-atlas, it was manually delineated on the MPRAGE images for each participant.
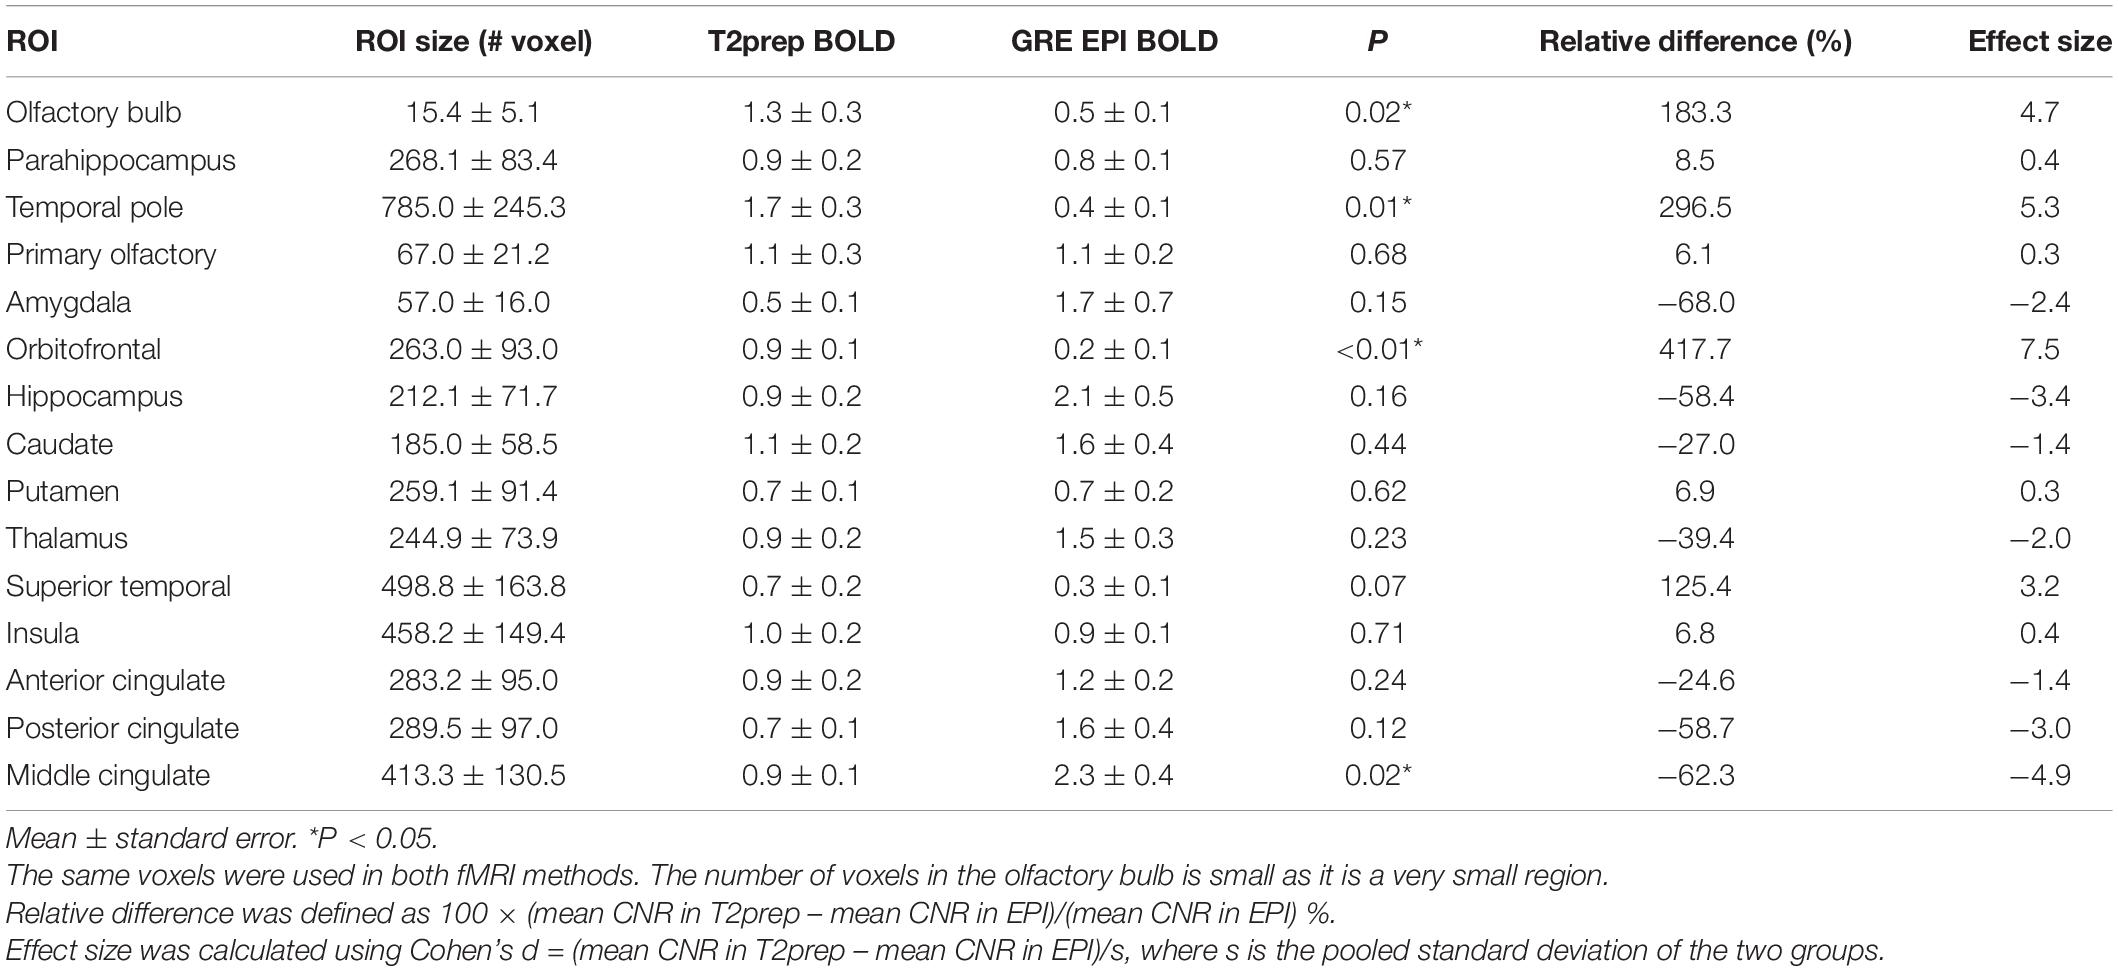
Functional activation during olfactory stimulation in the whole brain was detected using the nonparametric Kolmogorov–Smirnov (KS) two-sample test[12] (adjusted-P<0.01). Compared to the commonly used general linear model (GLM), previous olfactory fMRI studies[11, 13] have shown that the KS statistic may be more suitable for detecting functional activations with strong habituation effects. Relative signal changes (ΔS/S) between the stimulus-on and stimulus-off periods were calculated for each voxel. Note that, due to the transition period following the cessation of stimulus lasting for 50-100% of the stimulus-on period [14, 15], only signals from the second half of the stimulus-off period were included when calculating ΔS/S. Paired t-tests were performed to compare contrast-to-noise ratio (CNR) from GRE-EPI-BOLD and T2prep-BOLD-fMRI. Effect size was estimated with Cohen’s d. One-Way Repeated-Measures Analysis of Variance (ANOVA) was conducted to examine differences of ΔS/S among the three blocks of the olfactory paradigm. All statistical tests were corrected for multiple comparisons by controlling the false-discovery rate (adjusted-P<0.05).
Results
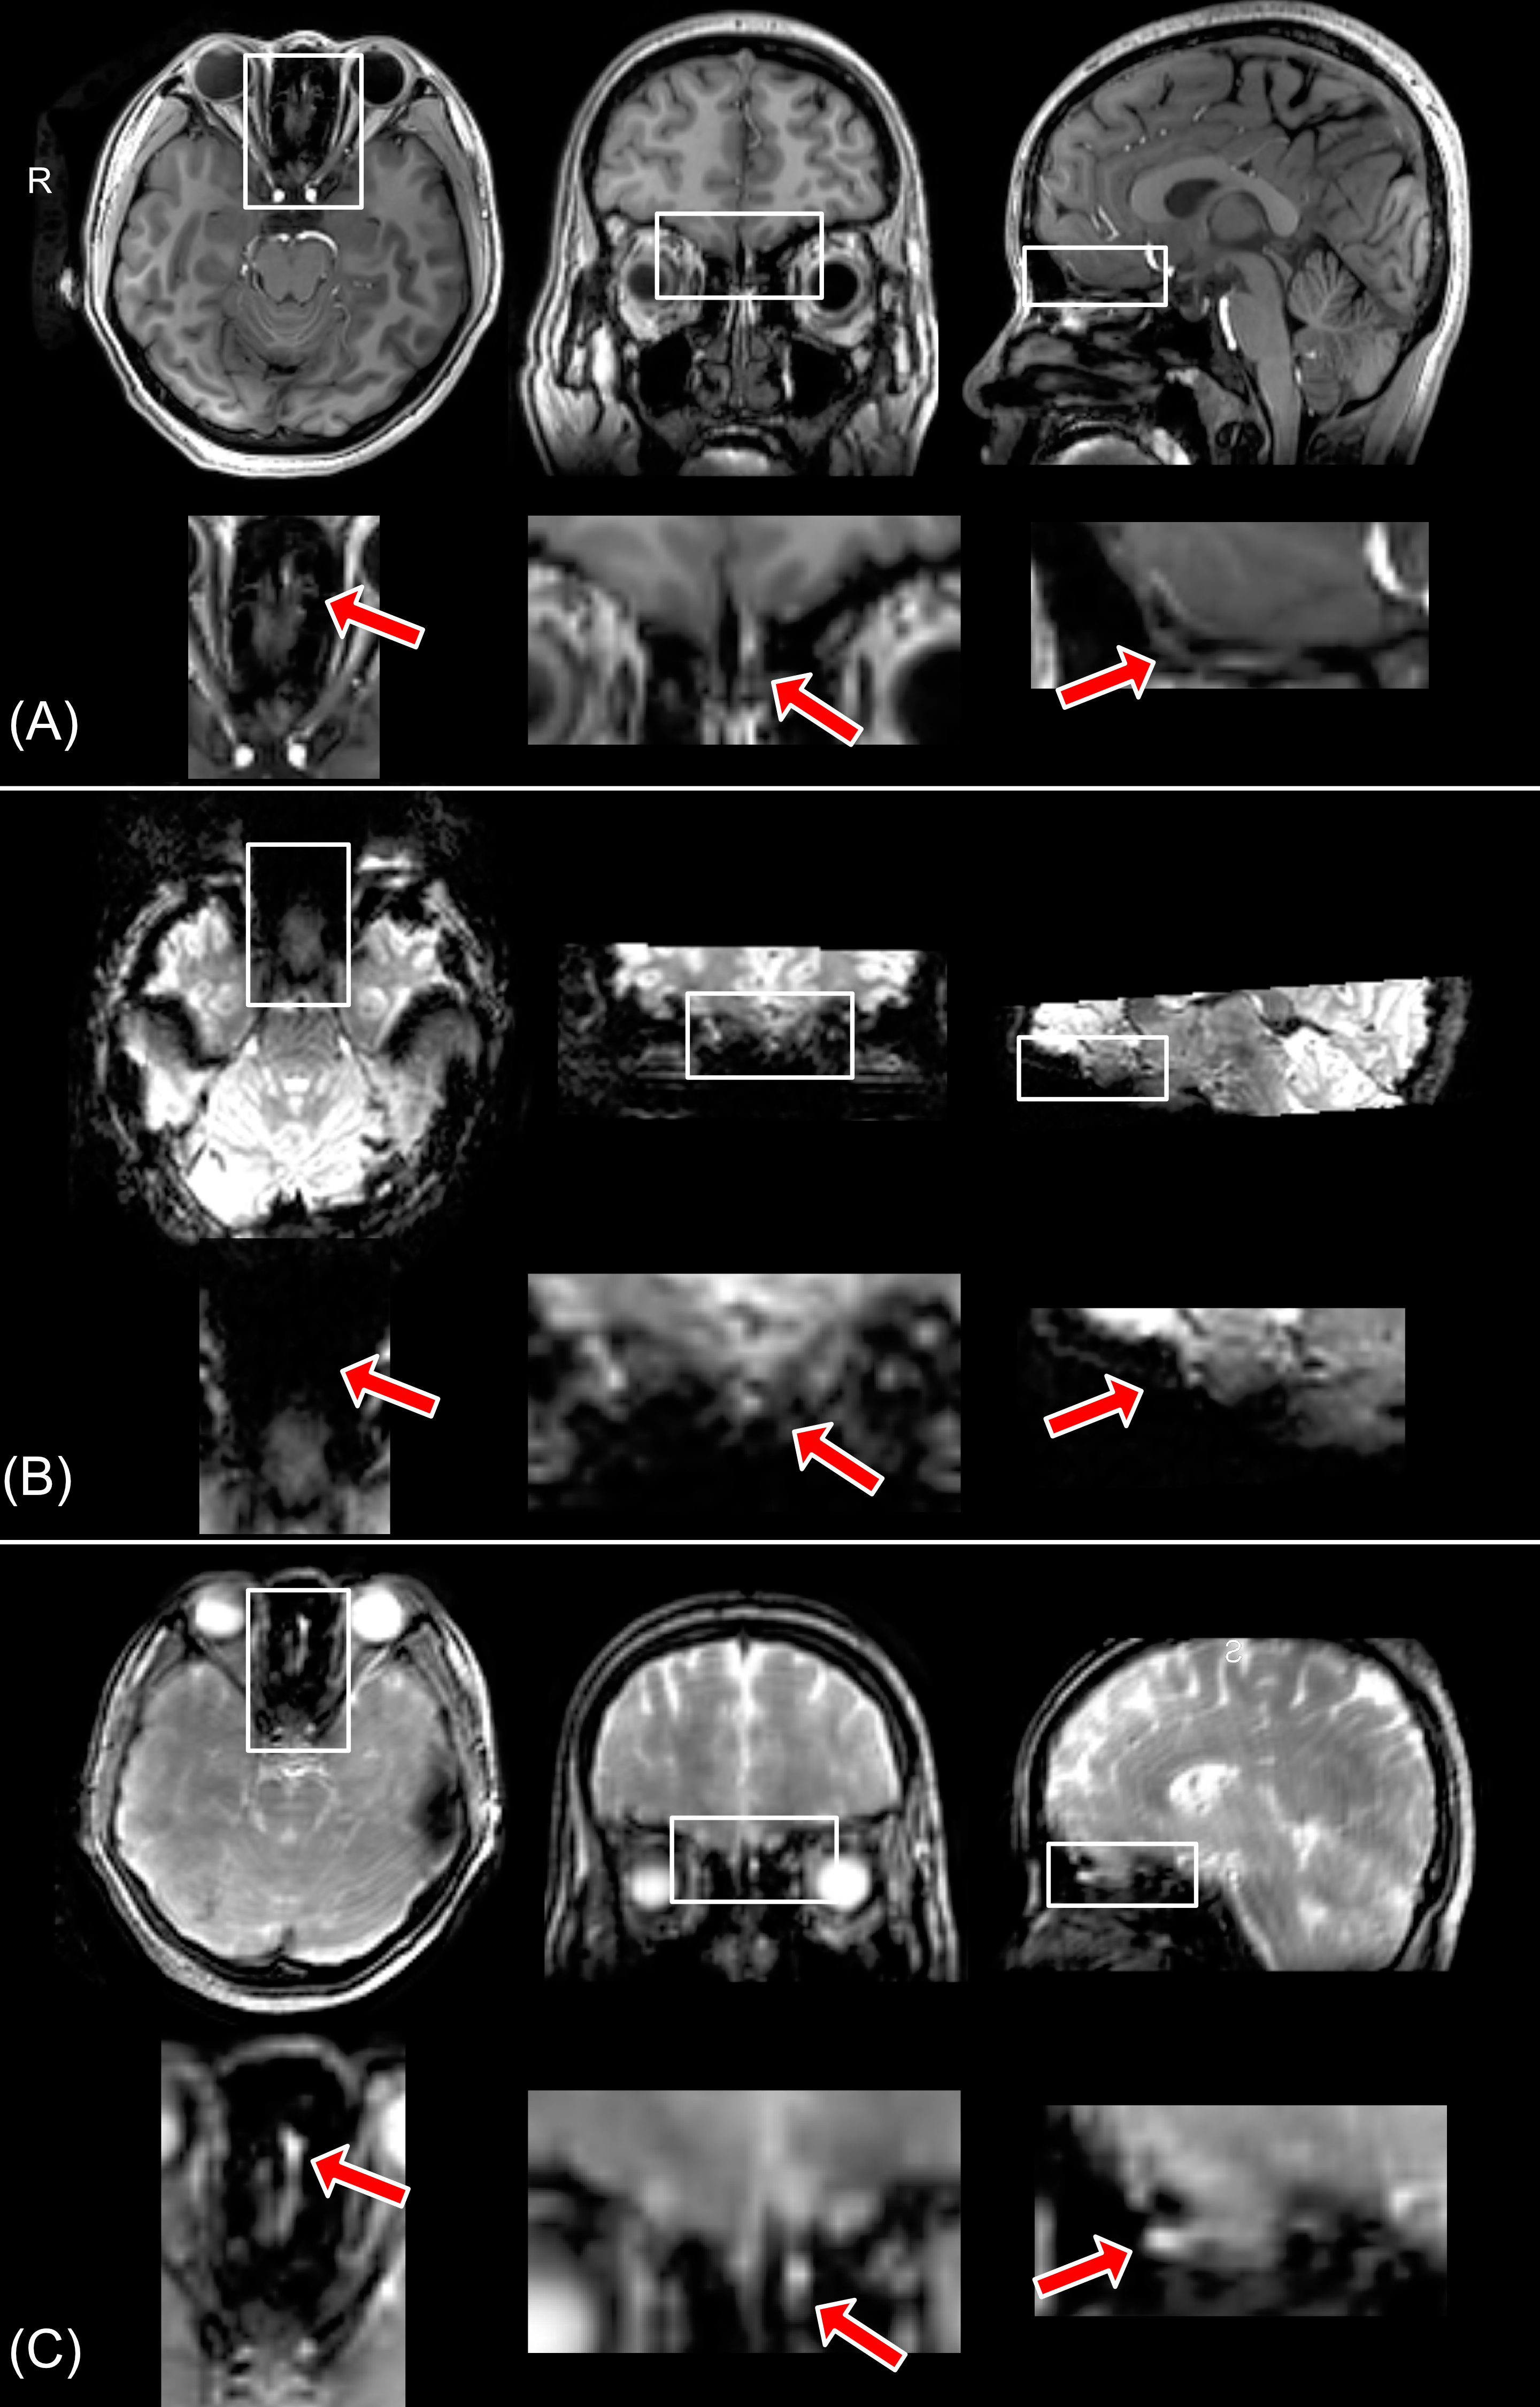
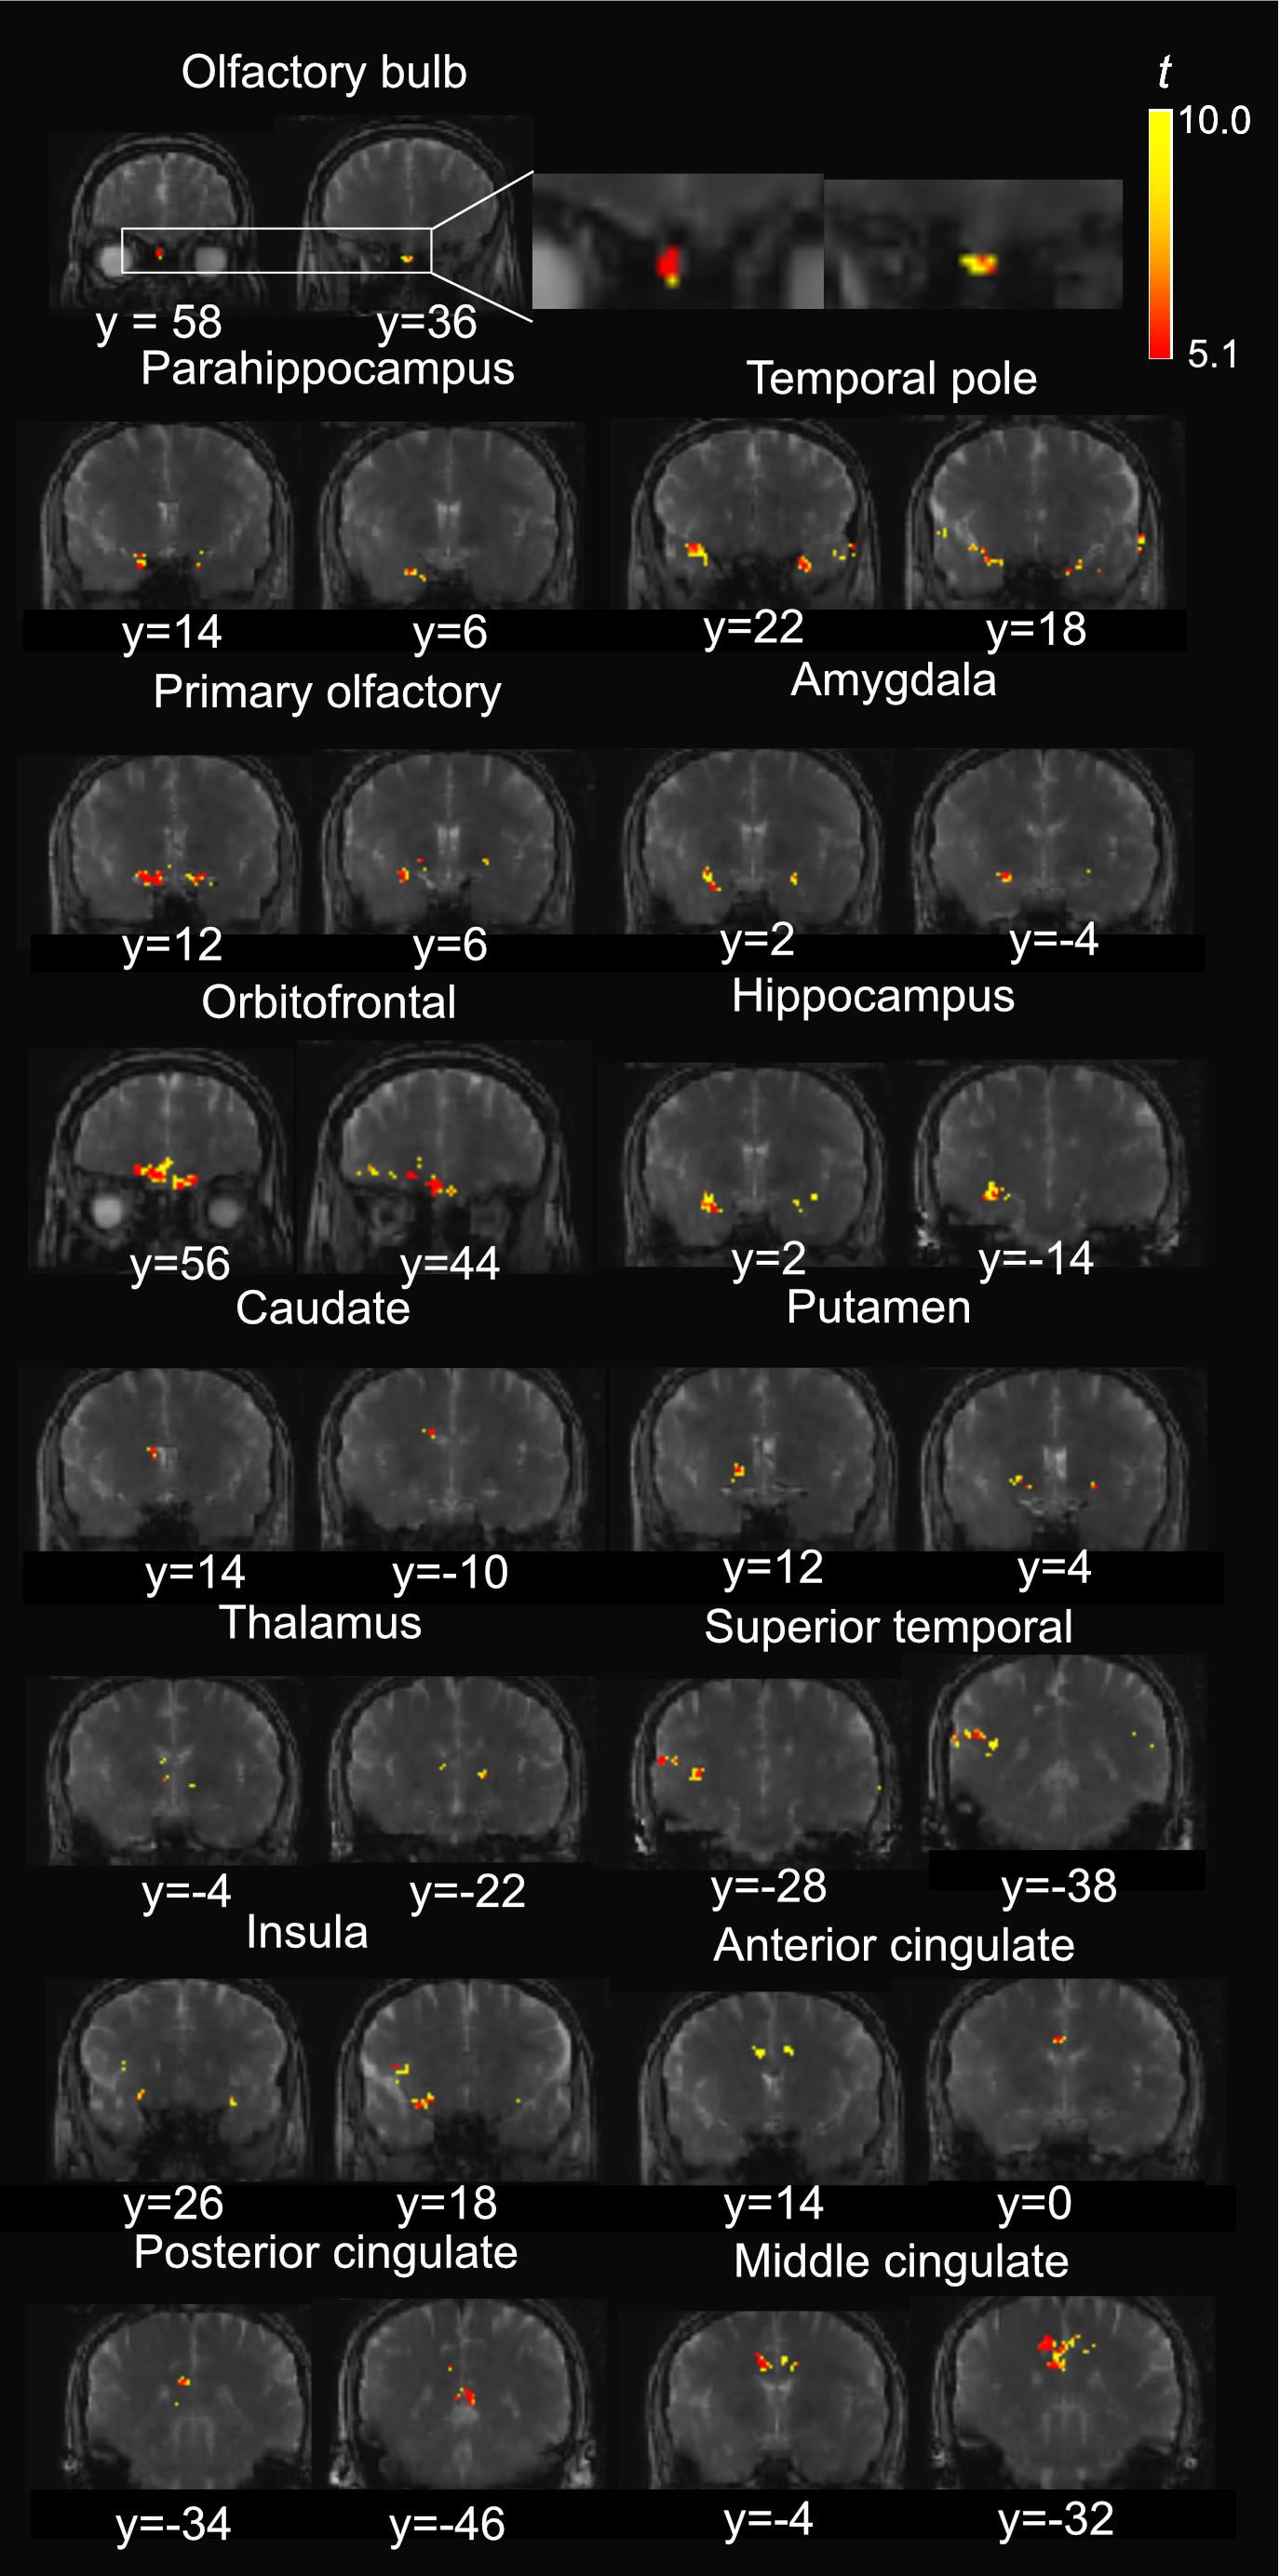
Figure 1 shows the typical image quality of GRE-EPI-BOLD and T2prep-BOLD-fMRI from one subject. Table 1 shows the quantitative CNR results. T2prep showed greater CNR than GRE EPI in the olfactory bulb, orbitofrontal cortex and the temporal pole. Figure 2 shows a representative activation map from one participant. The group averaged time courses of ΔS/S during the paradigm from activated voxels in each region are displayed in Figure 3. Table 2 summarizes the quantitative results (ΔS/S) from activated voxels in each region. As the same olfactory stimulation was repeated for three blocks, ΔS/S from each block was calculated and compared. All regions showed habituation effect that responses in the 2nd and 3rd blocks were reduced compared to the 1st block. Within the 1st block, all regions showed a bi-phasic pattern with two distinct peaks during the first and second halves of the 1st block. T2prep-BOLD-fMRI showed a good intra-subject reproducibility of the spatial locations of the activated clusters (Dice-coefficients 0.88-0.96) and ΔS/S (ICC>0.8), comparable to typical BOLD-fMRI measures reported in previous studies[16].Discussion and Conclusion
We demonstrated that the whole-brain T2prep-BOLD-fMRI technique can detect functional activations in response to olfactory stimulation in primary and secondary olfactory regions in healthy human subjects at 7T. Functional activation was detected using T2prep-BOLD in the olfactory bulb and associated olfactory regions. Habituation effects[17] and a bi-phasic pattern of fMRI signal changes during olfactory stimulation were observed in all regions. These signal characteristics are generally consistent with literature and showed a good intra-subject reproducibility comparable to previous human BOLD fMRI studies. In conclusion, the methodology demonstrated in this study holds promise for future olfactory fMRI studies in the olfactory bulb and other brain regions that suffer from large susceptibility artifacts.Acknowledgements
This project was supported by the Department of Defense (DoD) through the grant PD160104, and the National Institutes of Health through grants from the NINDS (1R01NS108452), the NIA (1R01AG064093), the NIBIB (P41 EB015909) and the NICHD (U54 HD079123). Support was also provided through the Johns Hopkins Clinical Research Scholars Program (KL2TR001077) and the Department of Psychiatry and Behavioral Sciences. Equipment used in the study was manufactured by Philips Healthcare and Whiff LLC. The authors thank the staff in the F.M. Kirby Research Center for Functional Brain Imaging at the Kennedy Krieger Institute and Grace-Anna Chaney from the Department of Psychiatry at the Johns Hopkins School of Medicine for experimental assistance, and Justin and Tom Fitzsimons from the Whiff LLC for olfactometry assistance.References
1. Moberg PJ, Kamath V, Marchetto DM, Calkins ME, Doty RL, Hahn C-G, Borgmann-Winter KE, Kohler CG, Gur RE, Turetsky BI: Meta-Analysis of Olfactory Function in Schizophrenia, First-Degree Family Members, and Youths At-Risk for Psychosis. Schizophrenia Bulletin 2014, 40(1):50-59.
2. Marin C, Vilas D, Langdon C, Alobid I, López-Chacón M, Haehner A, Hummel T, Mullol J: Olfactory Dysfunction in Neurodegenerative Diseases. Current Allergy and Asthma Reports 2018, 18(8):42.
3. Fullard ME, Morley JF, Duda JE: Olfactory Dysfunction as an Early Biomarker in Parkinson’s Disease. Neuroscience Bulletin 2017, 33(5):515-525.
4. Doty RL, Kamath V: The influences of age on olfaction: a review. Frontiers in psychology 2014, 5:20.
5. Hua J, Qin Q, Van Zijl PC, Pekar JJ, Jones CK: Whole-brain three-dimensional T2-weighted BOLD functional magnetic resonance imaging at 7 Tesla. Magnetic Resonance in Medicine 2014, 72(6):1530--1540.
6. Doty RL, Shaman P, Dann M: Development of the University of Pennsylvania Smell Identification Test: a standardized microencapsulated test of olfactory function. Physiol Behav 1984, 32(3):489-502.
7. Miao X, Paez AG, Rajan S, Cao D, Liu D, Pantelyat AY, Rosenthal LI, van Zijl PCM, Bassett SS, Yousem DM et al: Functional Activities Detected in the Olfactory Bulb and Associated Olfactory Regions in the Human Brain Using T2-Prepared BOLD Functional MRI at 7T. Frontiers in Neuroscience 2021, 15(1152).
8. Lundström JN, Gordon AR, Alden EC, Boesveldt S, Albrecht J: Methods for building an inexpensive computer-controlled olfactometer for temporally-precise experiments. International journal of psychophysiology : official journal of the International Organization of Psychophysiology 2010, 78(2):179-189.
9. Salimi-Khorshidi G, Douaud G, Beckmann CF, Glasser MF, Griffanti L, Smith SM: Automatic denoising of functional MRI data: Combining independent component analysis and hierarchical fusion of classifiers. NeuroImage 2014, 90:449-468.
10. Rolls ET, Huang C-C, Lin C-P, Feng J, Joliot M: Automated anatomical labelling atlas 3. NeuroImage 2020, 206:116189.
11. Poellinger A, Thomas R, Lio P, Lee A, Makris N, Rosen BR, Kwong KK: Activation and habituation in olfaction--an fMRI study. Neuroimage 2001, 13(4):547-560.
12. Siegel S, Castellan NJ: Nonparametric Statistics for the Behavioral Sciences: McGraw-Hill; 1988.
13. Sobel N, Prabhakaran V, Zhao Z, Desmond JE, Glover GH, Sullivan EV, Gabrieli JD: Time course of odorant-induced activation in the human primary olfactory cortex. J Neurophysiol 2000, 83(1):537-551.
14. Hua J, Stevens RD, Huang AJ, Pekar JJ, van Zijl PC: Physiological origin for the BOLD poststimulus undershoot in human brain: vascular compliance versus oxygen metabolism. Journal of cerebral blood flow and metabolism : official journal of the International Society of Cerebral Blood Flow and Metabolism 2011, 31(7):1599-1611.
15. van Zijl PC, Hua J, Lu H: The BOLD post-stimulus undershoot, one of the most debated issues in fMRI. Neuroimage 2012, 62(2):1092-1102.
16. Landman BA, Huang AJ, Gifford A, Vikram DS, Lim IA, Farrell JA, Bogovic JA, Hua J, Chen M, Jarso S et al: Multi-parametric neuroimaging reproducibility: a 3-T resource study. Neuroimage 2011, 54(4):2854-2866.
17. Pellegrino R, Sinding C, de Wijk RA, Hummel T: Habituation and adaptation to odors in humans. Physiol Behav 2017, 177:13-19.
Figures