0526
Tracking rapid stimulus-driven BOLD oscillations in the human primary motor cortex and somatosensory cortex1Centre for Advanced Imaging,The University of Queensland, Brisbane, Australia, 2ARC Training Centre for Innovation in Biomedical Imaging Technology, The University of Queensland, Brisbane, Australia, 3Athinoula A. Martinos Center for Biomedical Imaging, Department of Radiology, Harvard Medical School, Massachusetts General Hospital, Charlestown, MA, United States, 4Division of Health Sciences and Technology, Massachusetts Institute of Technology, Cambridge, MA, United States
Synopsis
We investigated the observable frequency range of stimulus-driven BOLD oscillations in human M1 and S1. Experimental results showed that BOLD response oscillations up to 0.50 Hz can be measured in individual subjects. The responses were substantially higher than predicted using the canonical HRF model. Despite their
Introduction
The canonical hemodynamic response function (HRF) predicts that rapidly oscillating stimuli lead to a vanishingly small BOLD fMRI response. However, Lewis et al.1 reported that unexpectedly high frequency stimulus-driven neural oscillations can be detected in human visual cortex. It is well known that the temporal characteristics of the HRF differ significantly across the brain2, therefore the observable range of frequencies may vary between cortical areas. Although close in proximity, the primary motor cortex (M1) and somatosensory cortex (S1) have markedly different angio-architecture3. In this study, we investigated the observable frequency range of BOLD responses in human M1 and S1 driven by finger flexion task.Methods
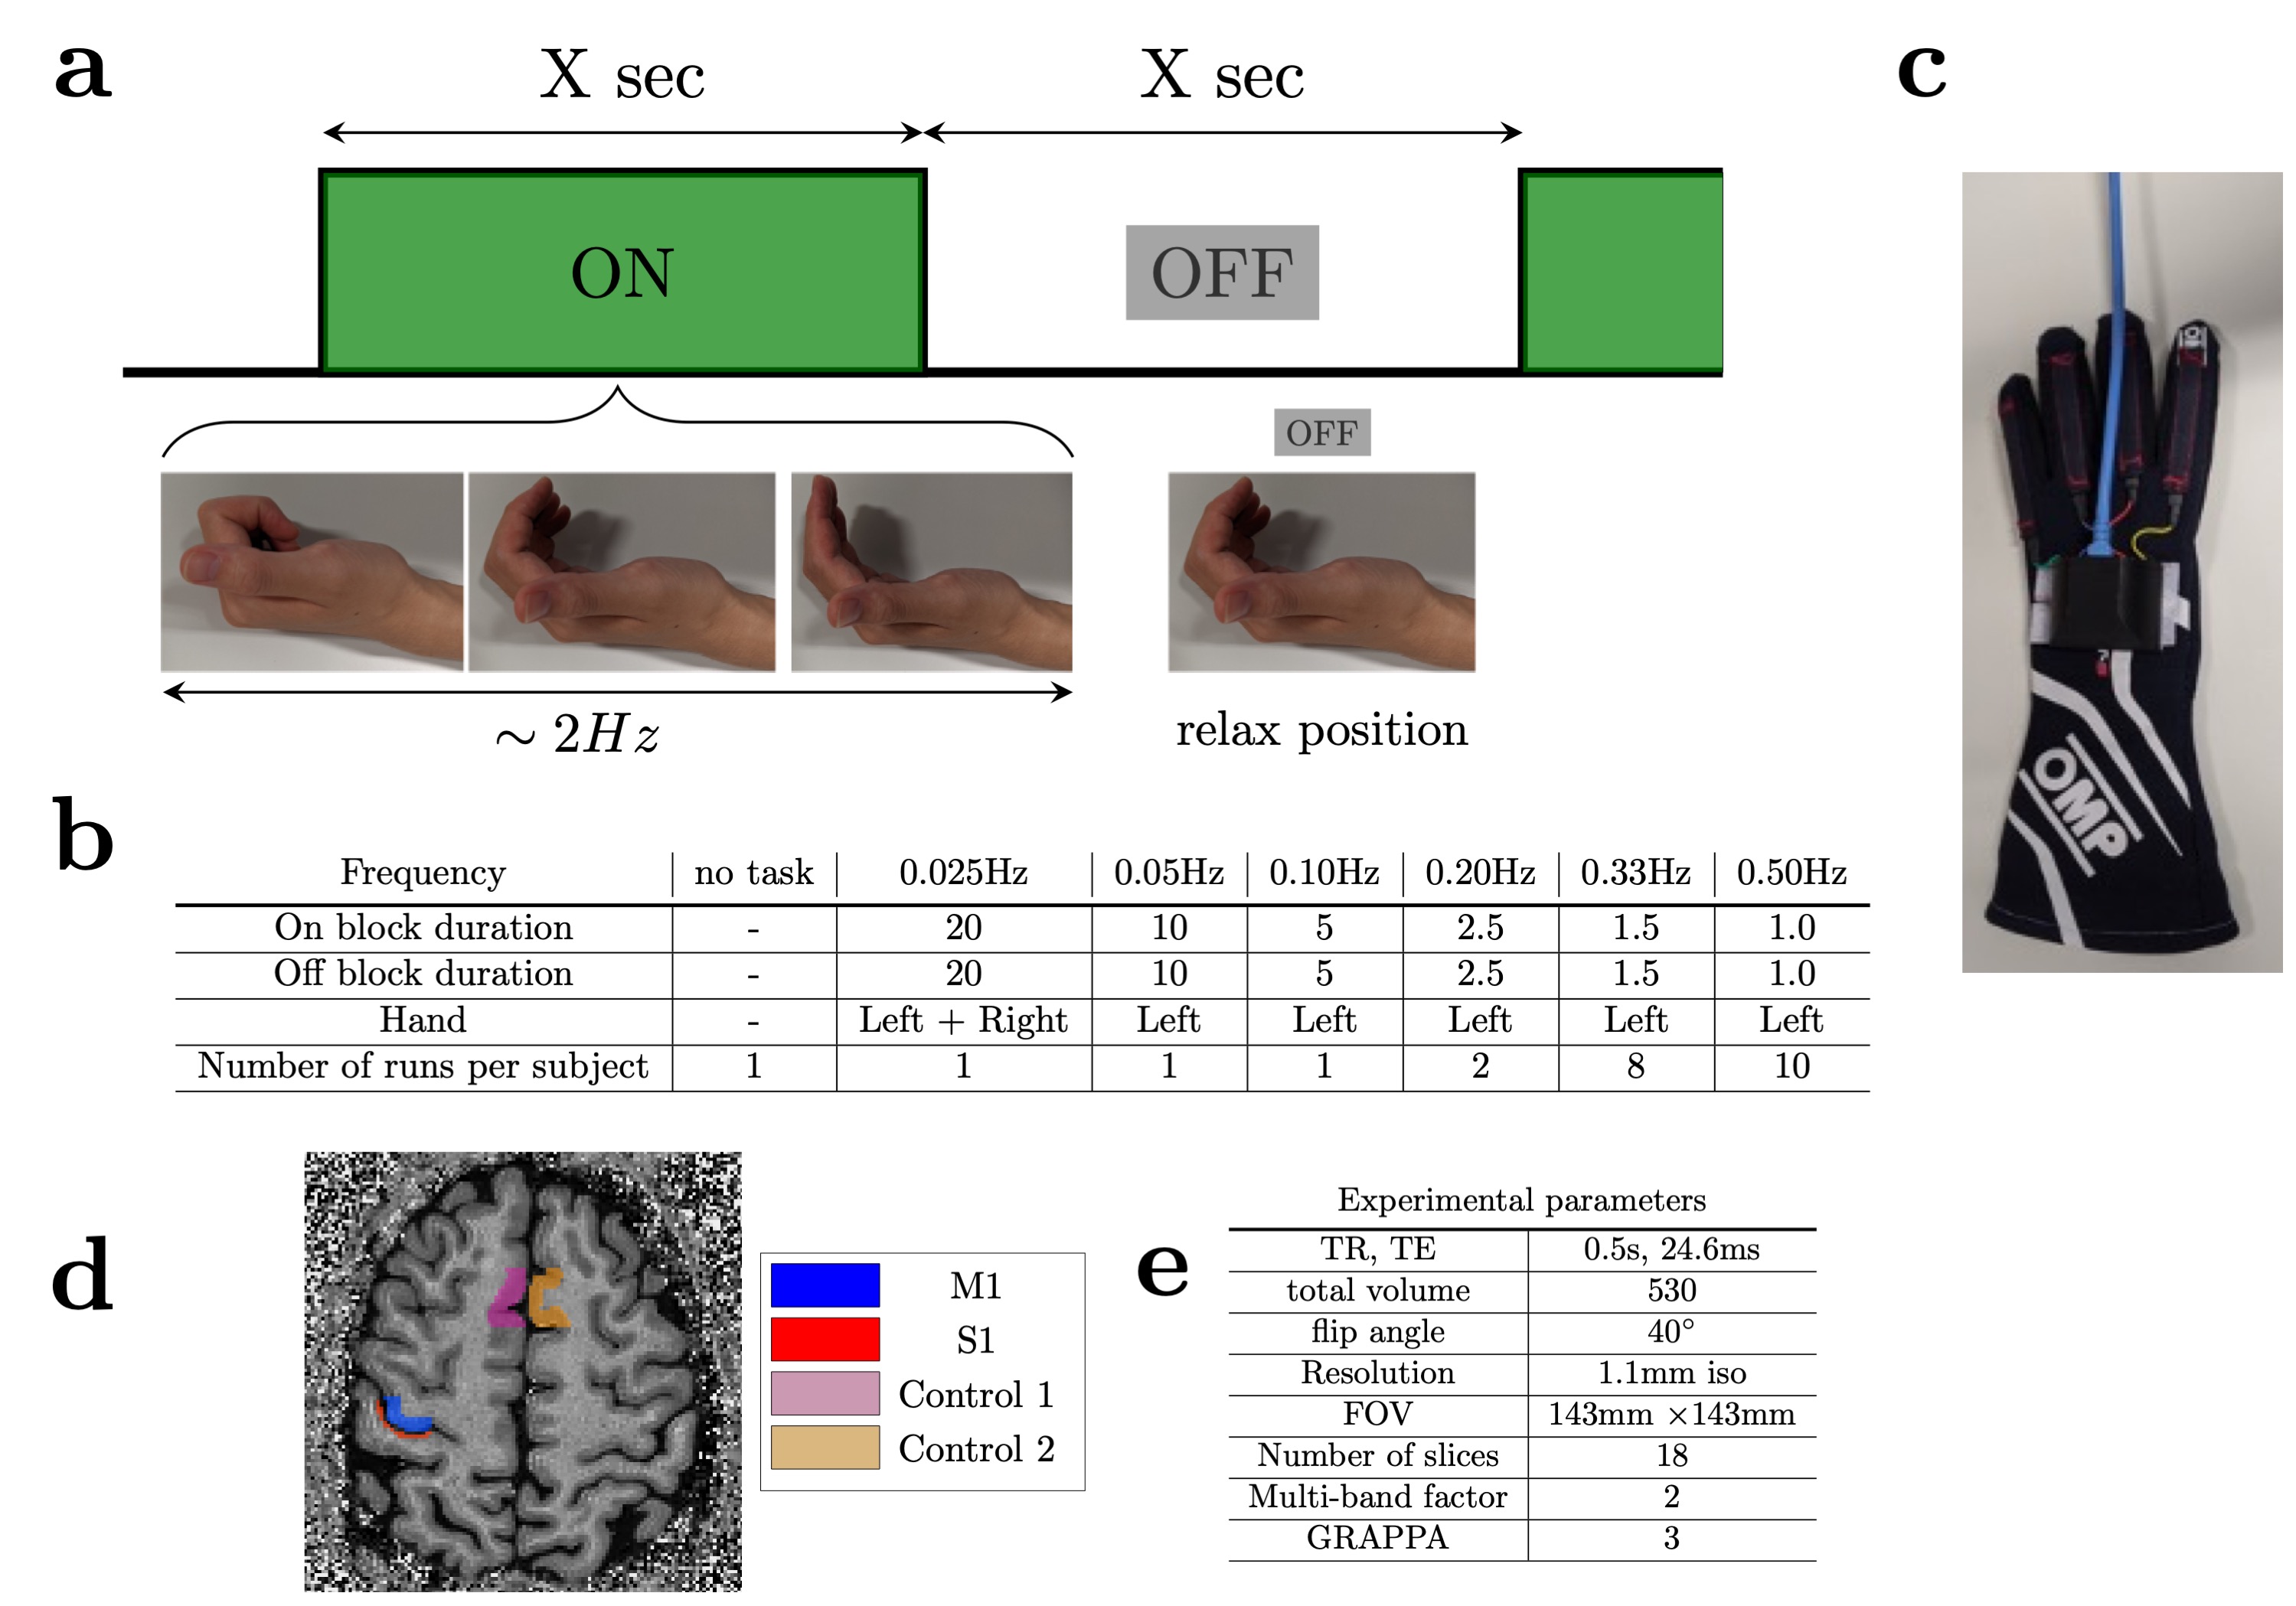
Five healthy volunteers were scanned on a 7T scanner (Magnetom Plus, Siemens Healthcare, Erlangen, Germany) using a 32-channel head coil. The study was approved by the local human research ethics committee in accordance with national guidelines.A distortion-matched T1-EPI sequence was used as an anatomical reference4. FMRI data were collected using the CMRR 2D-GRE-EPI sequence5. A block paradigm was used for all fMRI experiments. The duration of the ‘on’ and ‘off’ blocks was changed in different runs to evoke neuronal oscillations at 0.025, 0.05, 0.10, 0.20, 0.33, and 0.50Hz. Visual cues indicated the start of ‘on’ and ’off’ blocks of equal duration (Fig.1a). During ‘on’ blocks subjects periodically flexed and extended their fingers at ~2Hz6. During ‘off’ blocks the hand remained in a relaxed position (mid flexion). Every scan started with 25s of rest. A custom-made dataglove was used to record hand motion during the scan7.
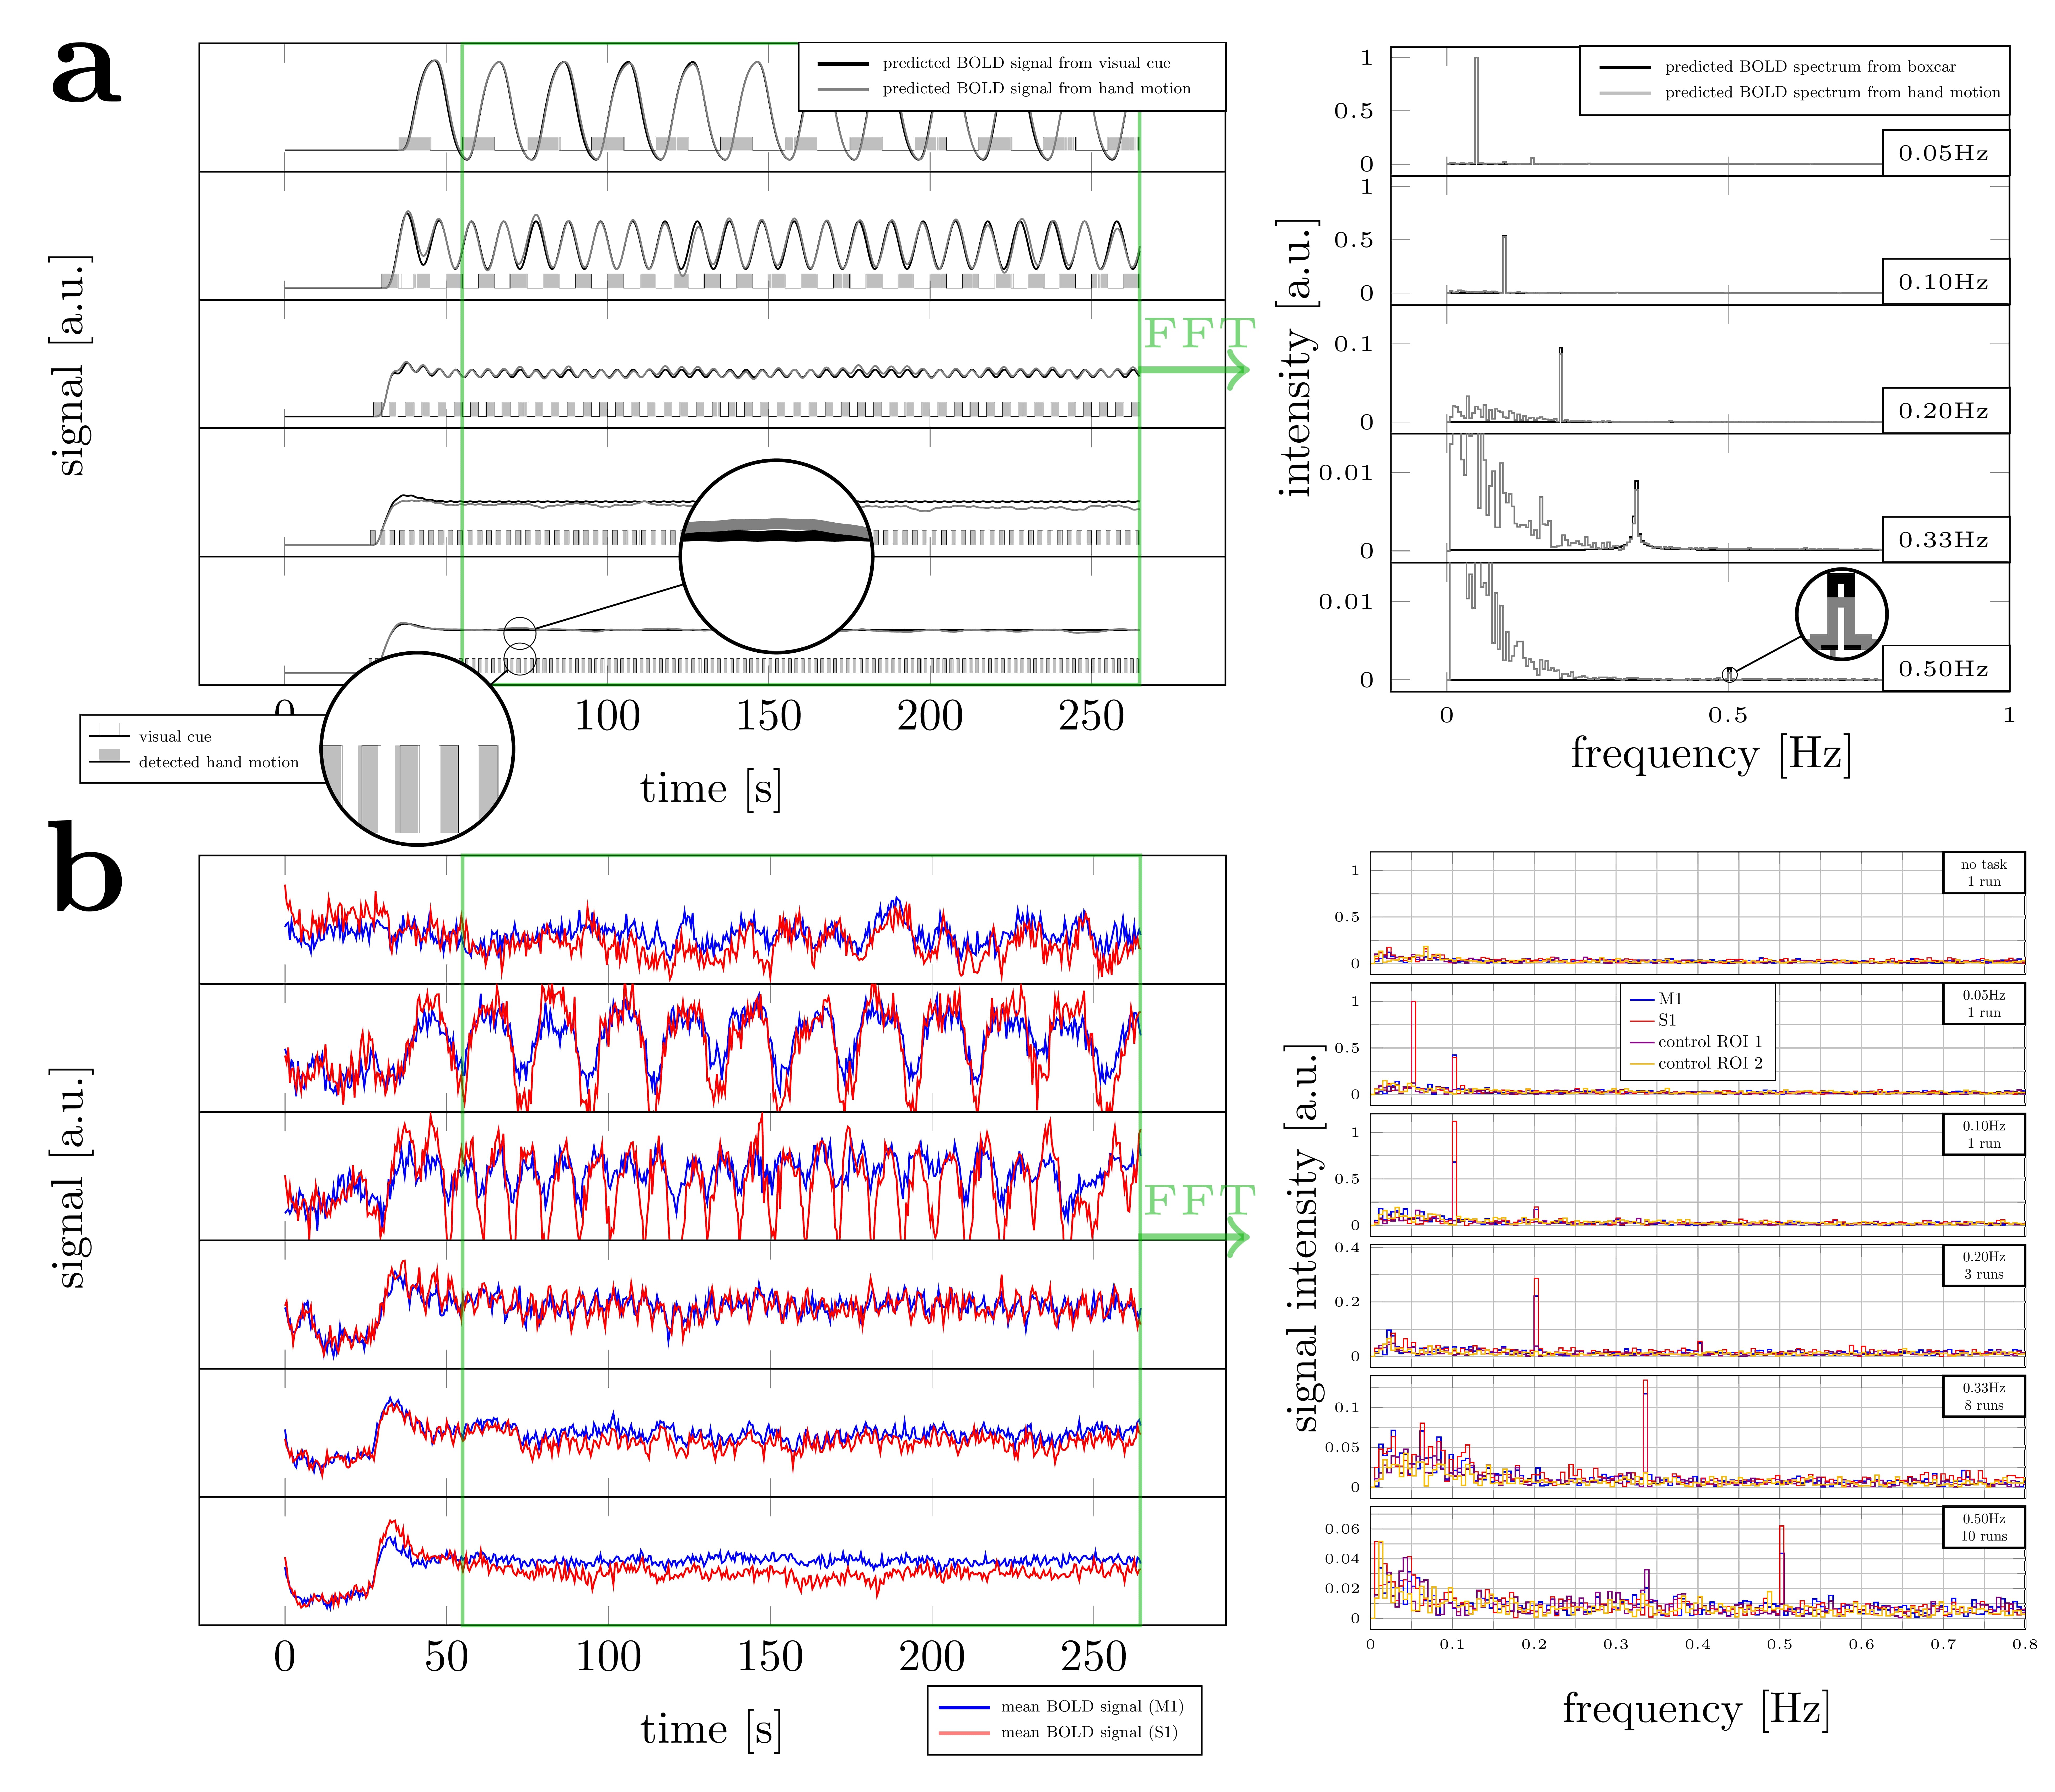
Slice timing and motion were corrected using SPM128. All functional data were rigidly coregistered to the anatomical reference using ANTs9 and ITK-SNAP10. M1, S1, and two nearby control ROIs were drawn manually (Fig.1d). Power spectra were estimated by averaging the steady-state signal from each ROI in the frequency domain (Fig.2a). The mean trial response was estimated by motion-onset-locked averaging across individual trials. The expected frequency response was modelled using the canonical double-gamma HRF (SPM12), based on the idealized paradigm and the recorded hand motion. In addition, the signal change between the baseline (the first 25s before the first ‘on’ block) and the mean of the oscillating plateau in the steady-state was analyzed.
For cortical depth analysis, the anatomical reference and experimental data were upsampled 4 times in all directions using ANTs. The mean trial response amplitude and relative signal phase were then estimated across cortical depths.
Results and Discussion
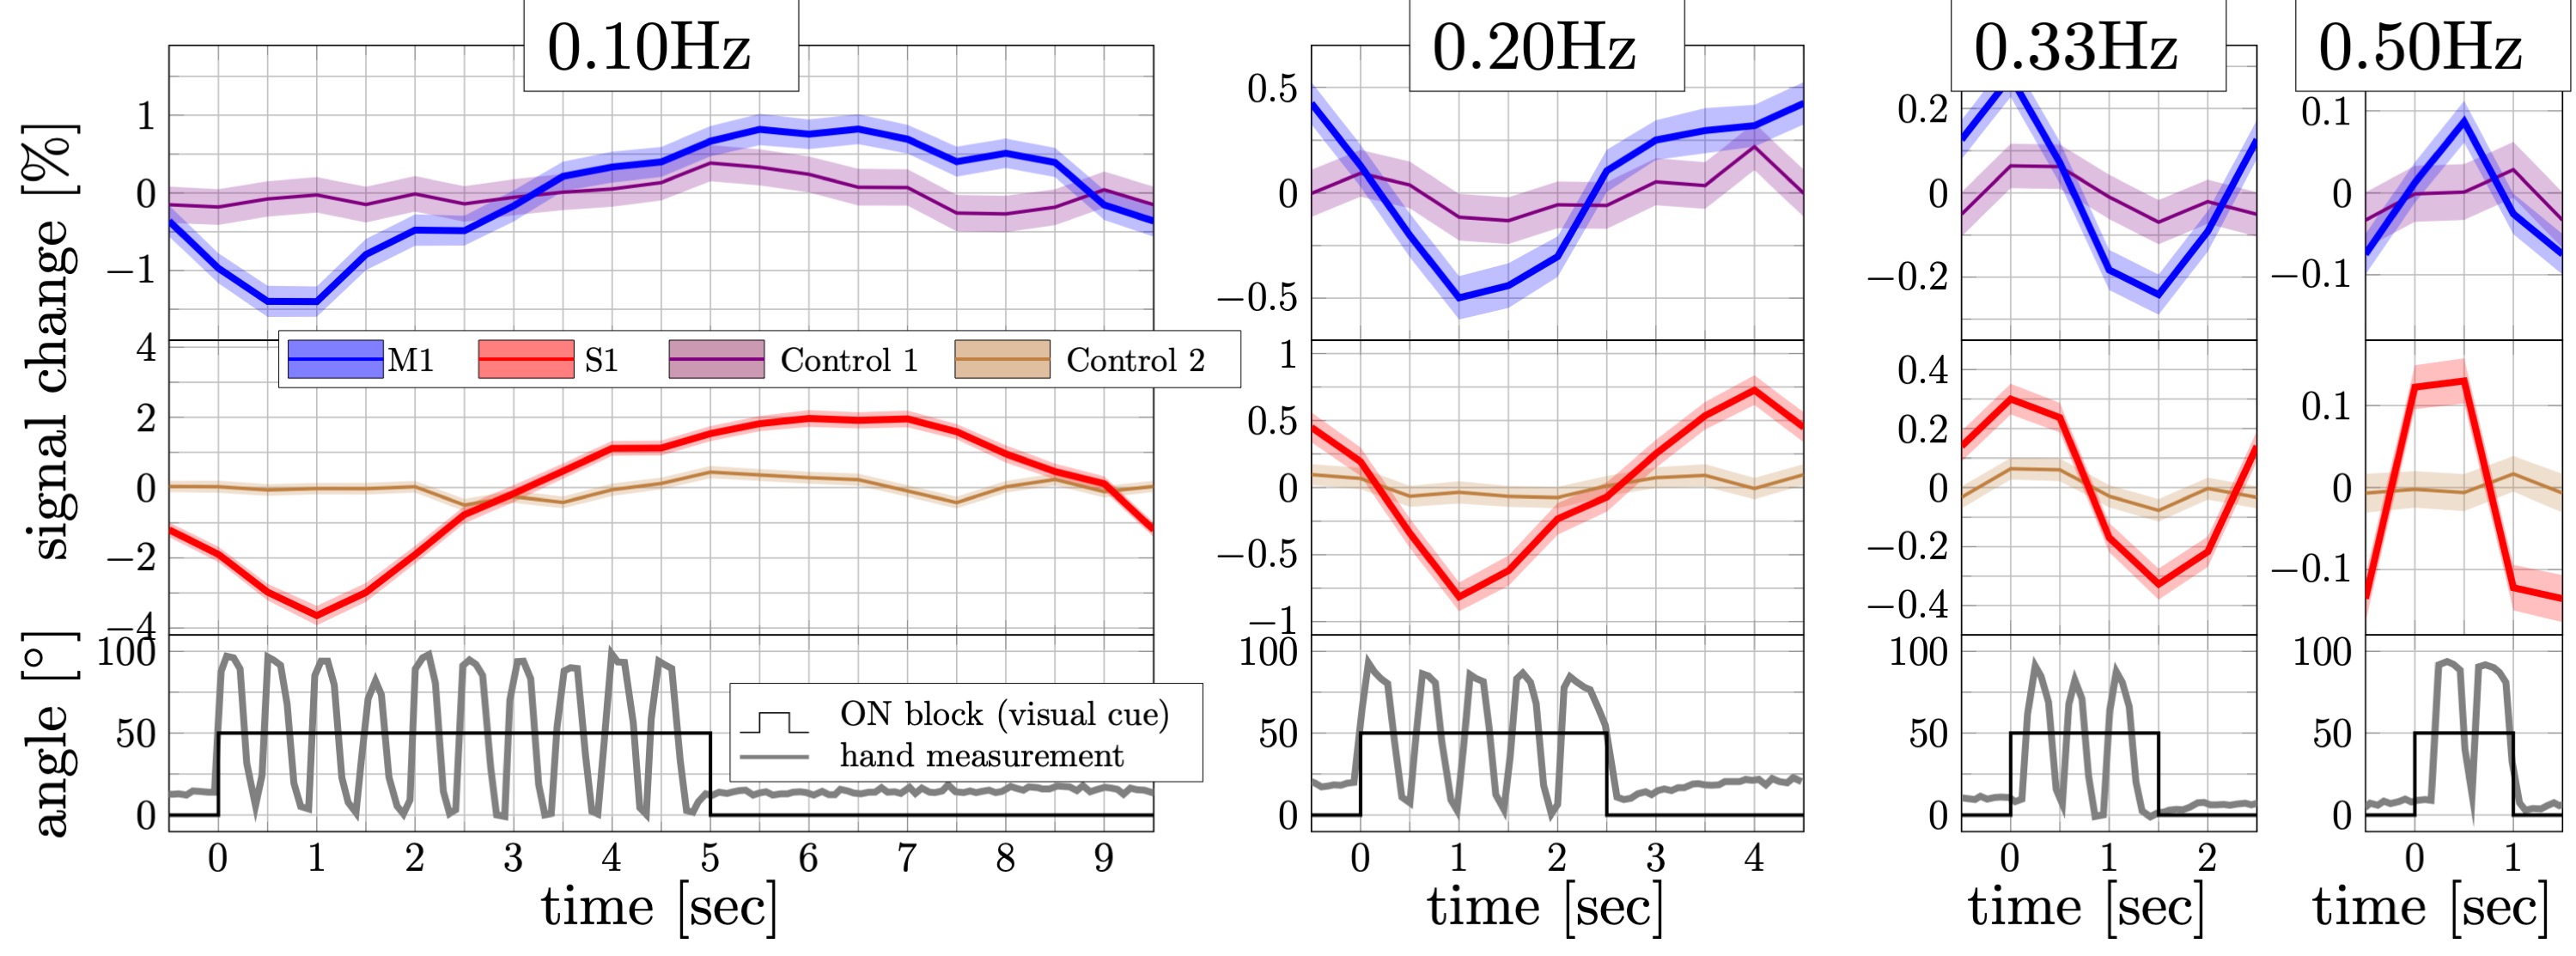
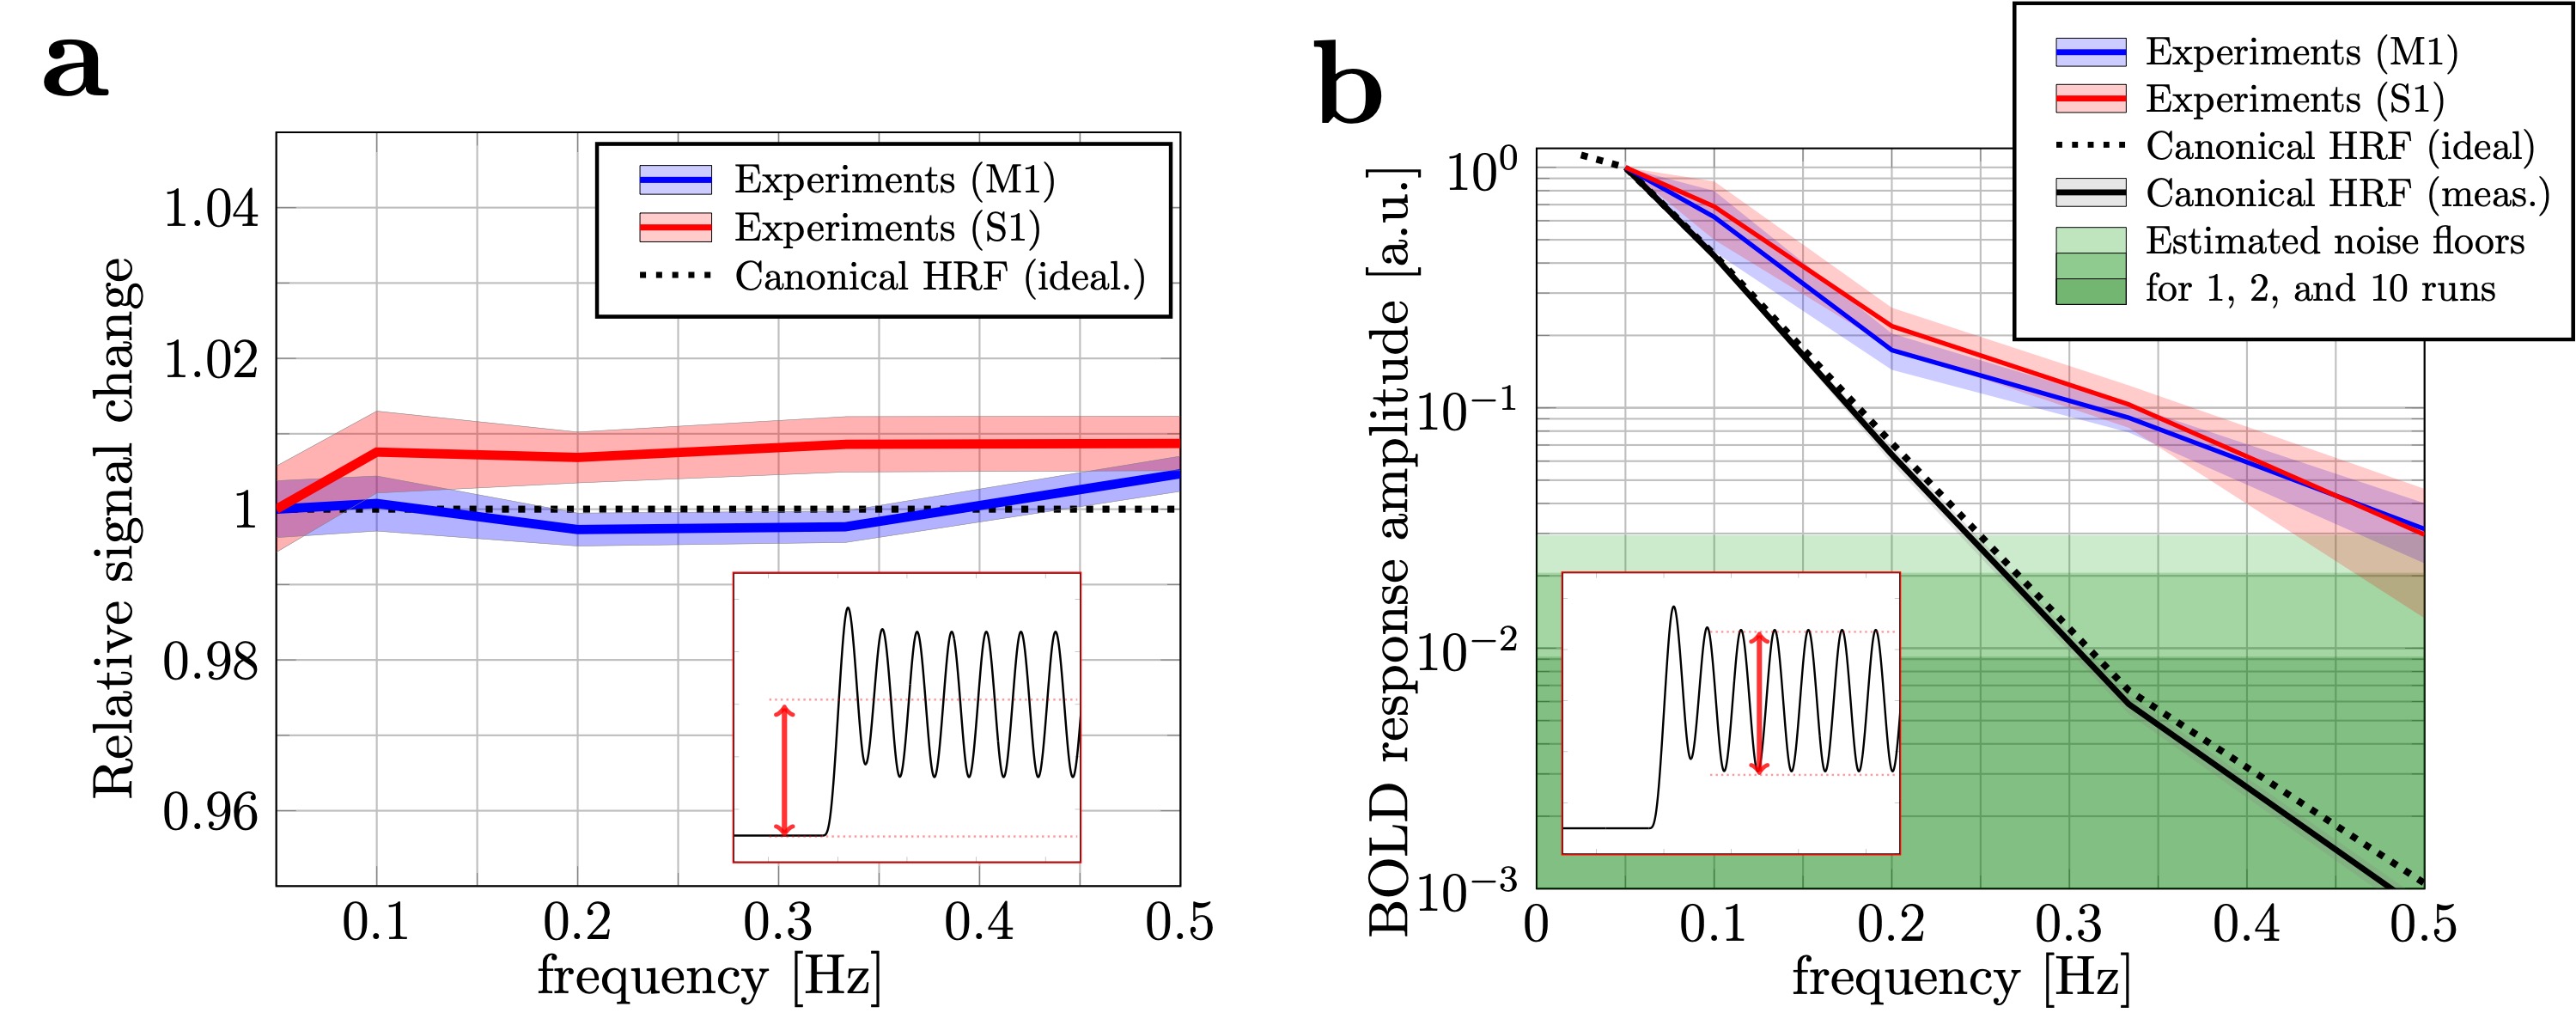
Figure 2b shows the power spectra derived from the BOLD response collected in a representative subject. Responses at all target frequencies were observed in M1 and S1, but not in the control ROIs. Figure 3 shows the trial-averaged response from the same subject, revealing clear sinusoidal activation in M1 (blue) and S1 (red). Control ROIs show minimal signs of oscillation, ruling out significant motion confounds. These observations indicate that oscillation frequencies as high as 0.50Hz can be detected in individual subjects in M1 and S1.On average, looking at the mean of the oscillations relative to baseline (Fig.4a), the canonical HRF predicts no change as a function of frequency. Our experimental data follow this prediction, which suggests that the power of the HRF is consistent across different frequency experiments in M1 and S1. However, the measured spectral intensities in M1 and S1 were much higher than predictions (Fig.4b), and the intensities at 0.50Hz were 30 and 28 times larger than predicted, respectively. Although the underlying neuronal activity may have some frequency dependence, it is unlikely that this can account for such a large factor (and hand motion recordings show subjects maintained a 2Hz rhythm in all experiments). Interestingly, even though M1 and S1 have different microvascular architecture, both show a similar nonlinear hemodynamic response. Modeling of realistic microvasculature and hemodynamics11,12 could be a powerful tool to help elucidate the true underlying mechanics driving these observations.
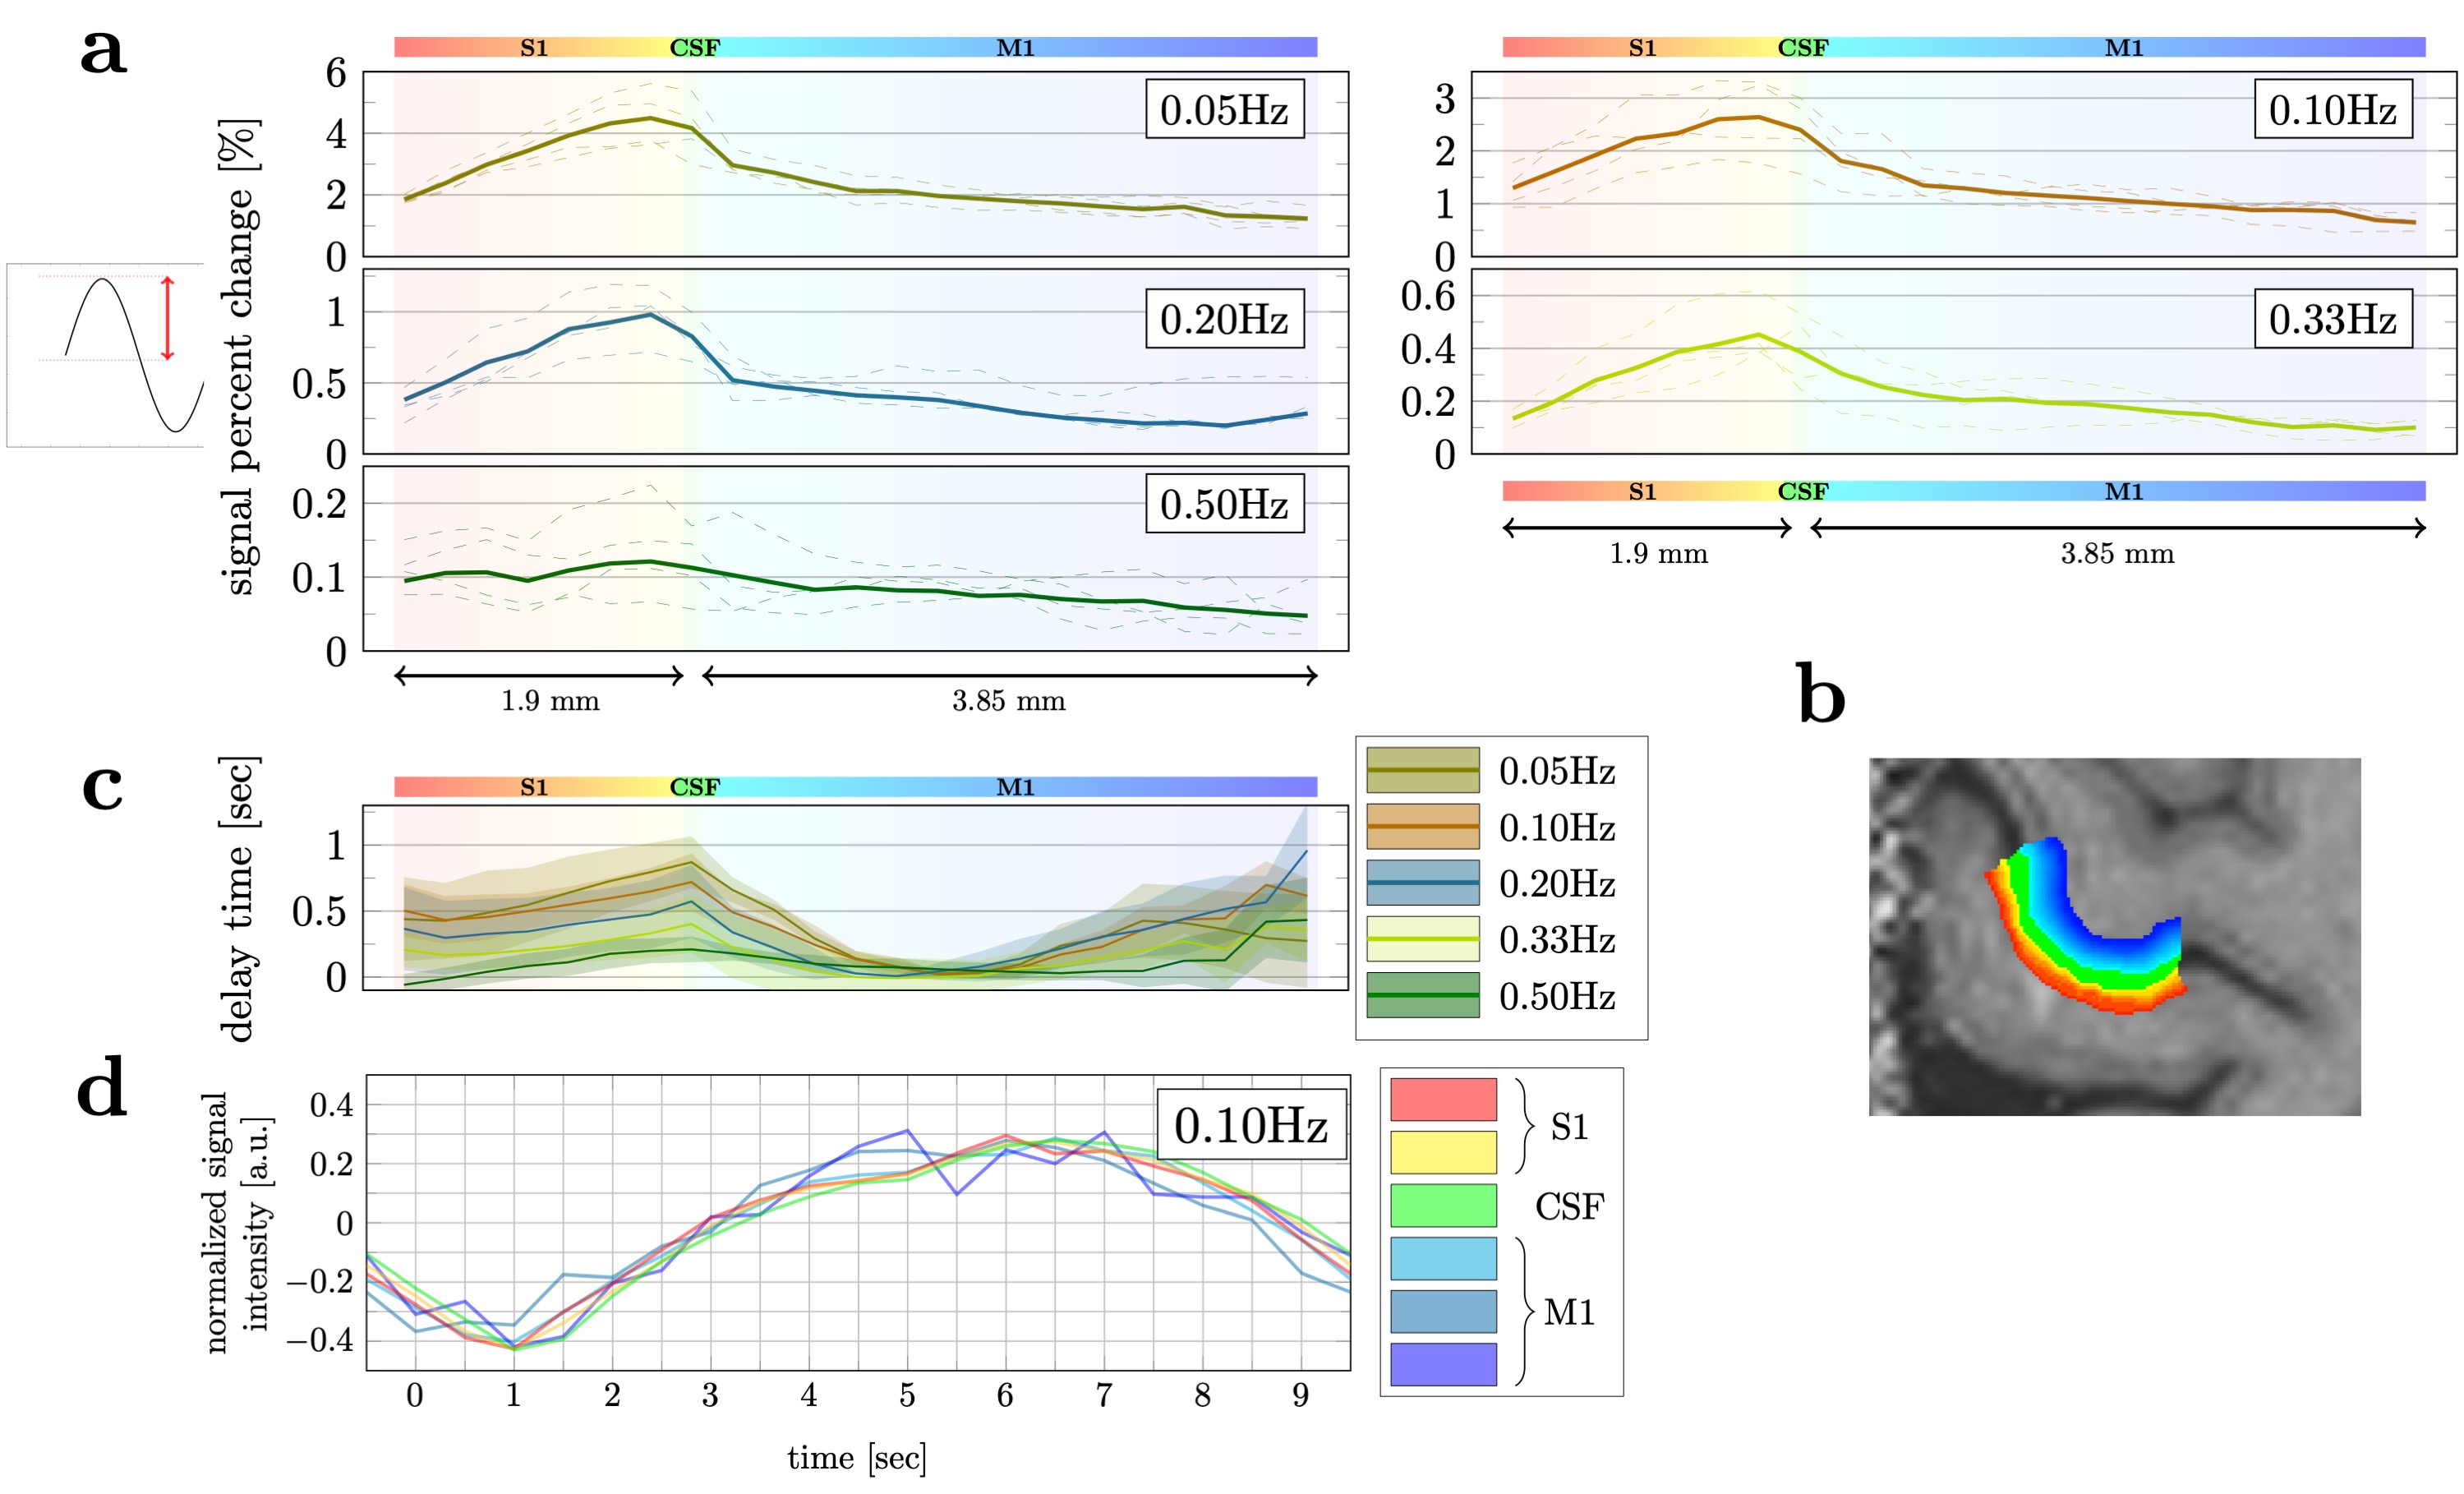
To investigate whether the response to stimuli of different frequency varies as a function of the proximity of voxels to large surface veins, we computed signal percent change across depth from S1 to M1 (Fig.5). For low-frequency stimuli, a higher percent signal change was observed on the S1 pial surface, however, at 0.50Hz the depth trend becomes flatter. Considering the vascular drainage towards the cortical surface, this suggests that larger veins may contribute less at higher frequencies, perhaps due to “temporal phase cancellation” effects13. Surprisingly, the relative signal phase appears faster in the center of M1 than at the pial or white matter interfaces. Further exploration, and additional subjects to improve the confidence interval, are needed.
Conclusion
Our study demonstrates that 0.50Hz stimulus-driven BOLD oscillations can be observed in individual subjects in M1 and S1 and the amplitudes are far higher than the predicted by the canonical HRF. This suggests that nonlinearities in the BOLD response enable fMRI to detect surprisingly fast dynamics in M1 and S1 as well. The similar nonlinearities in M1 and S1 might be explained by similar dynamic properties of the vessels despite vascular architectures being different. The cortical depth trends exhibit higher amplitudes at the pial surface for the lower frequencies which are attenuated at higher frequencies, and a depth dependence of the response phase.Acknowledgements
This work was supported by ARC Future fellowship grant FT200100329, by the NIH NIBIB (grant R01-EB019437) and by the NIH NIMH BRAIN Initiative (grant R01-MH111419). The authors acknowledge the facilities of the National Imaging Facility at the Centre for Advanced Imaging, and thank Chia-yin Wu for their support during experiments.References
1. Lewis LD, Setsompop K, Rosen BR, Polimeni JR. Fast fMRI can detect oscillatory neural activity in humans. Proc Natl Acad Sci U S A. 2016;113(43):E6679-E6685. doi:10.1073/pnas.1608117113
2. Taylor AJ, Kim JH, Ress D. Characterization of the hemodynamic response function across the majority of human cerebral cortex. Neuroimage. 2018 Jun 1;173:322-31.
3. Duvernoy HM, Delon SL, Vannson JL. Cortical blood vessels of the human brain. Brain research bulletin. 1981 Nov 1;7(5):519-79.
4. Renvall V, Witzel T, Wald LL, Polimeni JR. Automatic cortical surface reconstruction of high-resolution T1 echo planar imaging data. Neuroimage. 2016;134:338-354. doi:10.1016/j.neuroimage.2016.04.004
5. Moeller S, Yacoub E, Olman CA, Auerbach E, Strupp J, Harel N, Uğurbil K. Multiband multislice GE-EPI at 7 tesla, with 16-fold acceleration using partial parallel imaging with application to high spatial and temporal whole-brain fMRI. Magn Reson Med. 2010 May;63(5):1144-53.
6. Siero JC, Hermes D, Hoogduin H, Luijten PR, Petridou N, Ramsey NF. BOLD consistently matches electrophysiology in human sensorimotor cortex at increasing movement rates: a combined 7T fMRI and ECoG study on neurovascular coupling. Journal of Cerebral Blood Flow & Metabolism. 2013 Sep;33(9):1448-56.
7. Hodono S, Maillet D, Jin J. Reutens D, Cloos MA. A custom MR-compatible data glove for fMRI off the human motor cortex at 7T. In: Proceedings of the 29th Annual Meeting of ISMRM, 2021. Abstract 2673.
8. Penny WD, Friston KJ, Ashburner JT, Kiebel SJ, Nichols TE, editors. Statistical parametric mapping: the analysis of functional brain images. Elsevier; 2011.
9. Avants BB, Tustison NJ, Song G, Cook PA, Klein A, Gee JC. A reproducible evaluation of ANTs similarity metric performance in brain image registration. Neuroimage. 2011 Feb 1;54(3):2033-44.
10. Yushkevich PA, Piven J, Hazlett HC, Smith RG, Ho S, Gee JC, Gerig G. User-guided 3D active contour segmentation of anatomical structures: significantly improved efficiency and reliability. Neuroimage. 2006 Jul 1;31(3):1116-28.
11. Gagnon L, Sakadžić S, Lesage F, Musacchia JJ, Lefebvre J, Fang Q, Yücel MA, Evans KC, Mandeville ET, Cohen-Adad J, Polimeni JR. Quantifying the microvascular origin of BOLD-fMRI from first principles with two-photon microscopy and an oxygen-sensitive nanoprobe. Journal of Neuroscience. 2015 Feb 25;35(8):3663-75.
12. Pfannmoeller JP, Hartung GA, Cheng X, Berman A, Boas D, Polimeni JR. Simulations of the BOLD Non-Linearity Based on a Viscoelastic Model for Capillary and Vein Compliance. In: Proceedings of the 29th Annual Meeting of ISMRM, 2021. Abstract 2856.
13. Polimeni JR, Lewis LD. Imaging faster neural dynamics with fast fMRI: a need for updated models of the hemodynamic response. Prog Neurobiol. 2021:102174.
14. Huber, L., Poser, B. A., Bandettini, P. A., Arora, K., Wagstyl, K., Cho, S., Goense, J., Nothnagel, N., Morgan, A. T., van den Hurk, J., Mueller A. K., Reynolds, R. C., Glen, D. R., Goebel, R. W., Gulban, O. F. . LayNii: A software suite for layer-fMRI. NeuroImage, 2021 118091.
Figures