0524
Sensitive Quantification of Hypomyelination and Axon g-ratio Using Ultra High Resolution 7T Multi-Echo Gradient Echo MRI with BSS-rPCA1McConnell Brain Imaging Centre, Montreal Neurological Institute and Hospital, Montreal, QC, Canada, 2Department of Neurology and Neurosurgery, McGill University, Montreal, QC, Canada, 3Department of Human Genetics, McGill University, Montreal, QC, Canada, 4Gerald Bronfman Department of Oncology, McGill University, Montreal, QC, Canada, 5Department of Biomedical Engineering, McGill University, Montreal, QC, Canada
Synopsis
We investigated the application of blind source separation, robust principal component analysis (BSS-rPCA) for myelin water imaging in a panel of mice exhibiting varied myelination profiles. BSS-rPCA exhibited sensitivity to myelin as evidenced by region of interest (ROI) analysis of several white matter tracts as a function of hypomyelinating genotype. By combining BSS-rPCA with estimates of neurite orientation dispersion and density imaging (NODDI)-derived axon water fraction (AWF) maps, we conclude that BSS-rPCA is sensitive to variations in myelin content in the presence of stable axon density.
Introduction
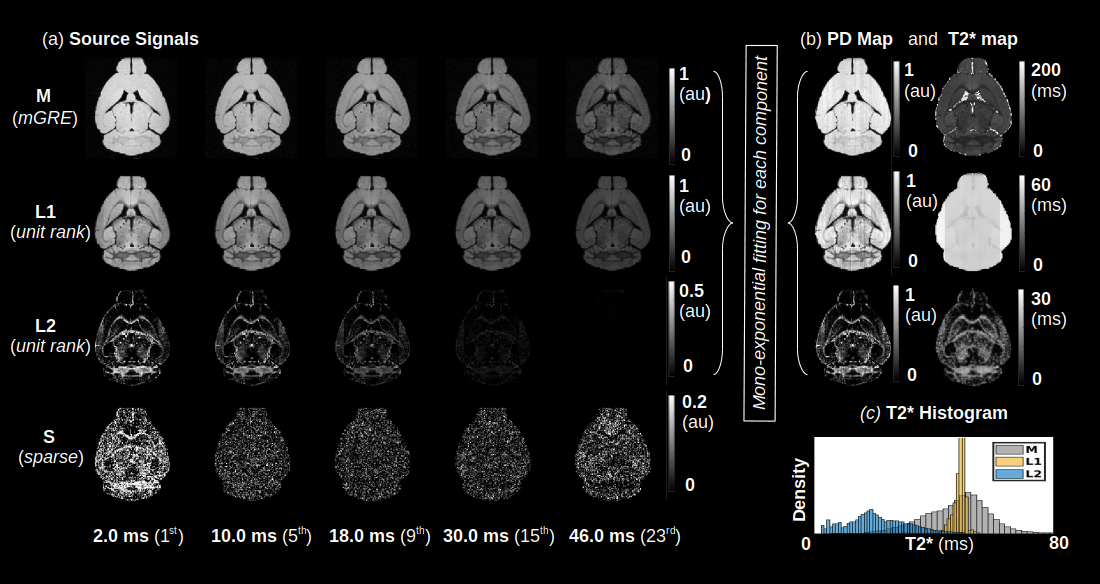
Blind source separation with robust principal component analysis (BSS-rPCA) is a recently developed method for myelin water fraction (MWF) mapping from multi-echo gradient recalled echo (mGRE) data1. BSS-rPCA computes MWF maps by separating the slowly decaying and rapidly decaying T2* components corresponding to the extracellular/intracellular water proton and myelin water proton pools. Separation of the components is accomplished through singular value decomposition (SVD), enhanced with non-negative matrix factorization and matrix Hankelization of the mGRE signal. The unit rank (L1 and L2) and sparse (S) components from BSS-rPCA represent slowly decaying, rapidly decaying, and artefactual components, respectively. MWF maps are computed as the ratio of L2 and the sum of L1 and L2. Advantageously, BSS-rPCA does not require a-priori numerical models of T2* relaxation, which may be sensitive to artefacts. In this study, we investigated the sensitivity of BSS-rPCA to decreases in central nervous system (CNS) myelin by imaging a panel of hypomyelinating mice. By selectively deleting one or more of the M1E, M3, and M5 transcription enhancer domains in the myelin basic protein (Mbp)/Golli locus, a graded hypomyelination phenotype was achieved in the mouse CNS2. A hypermyelinating genotype (M3KO; 389 bpKI) and a well-characterized amyelinating genotype (Shi) were also included to broaden the dynamic range of myelin content under investigation. In addition, we obtained estimates of axon water fraction (AWF) by fitting the neurite orientation dispersion and density imaging (NODDI)3 model to diffusion weighted data acquired from the aforementioned transgenic mouse strains. By controlling for axon density, we attempted to localize decreases in regional MWF linked solely to myelin water content in specific white matter tracts of the mouse brain.Methods
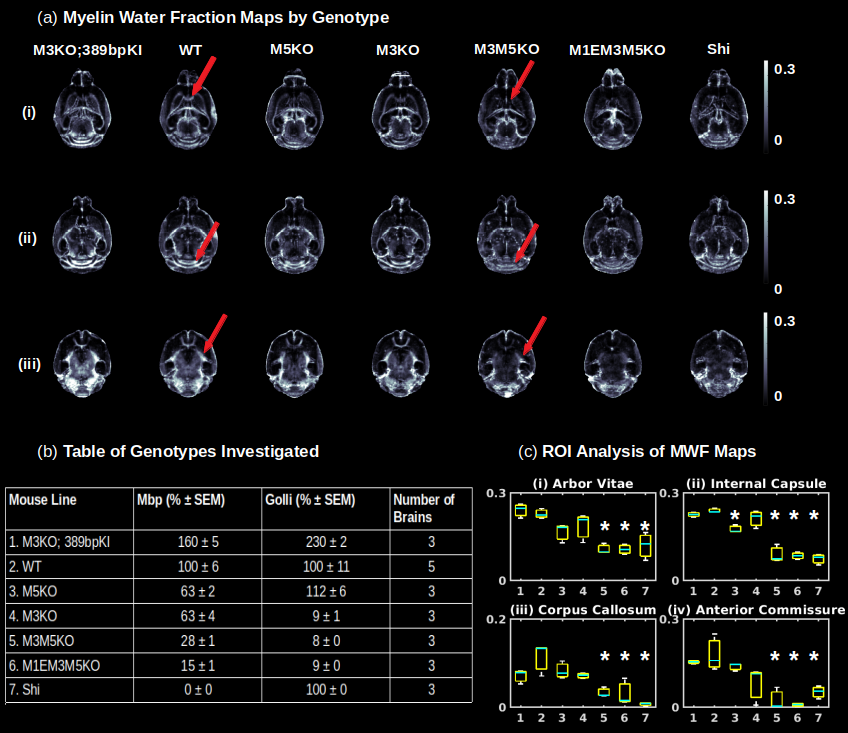
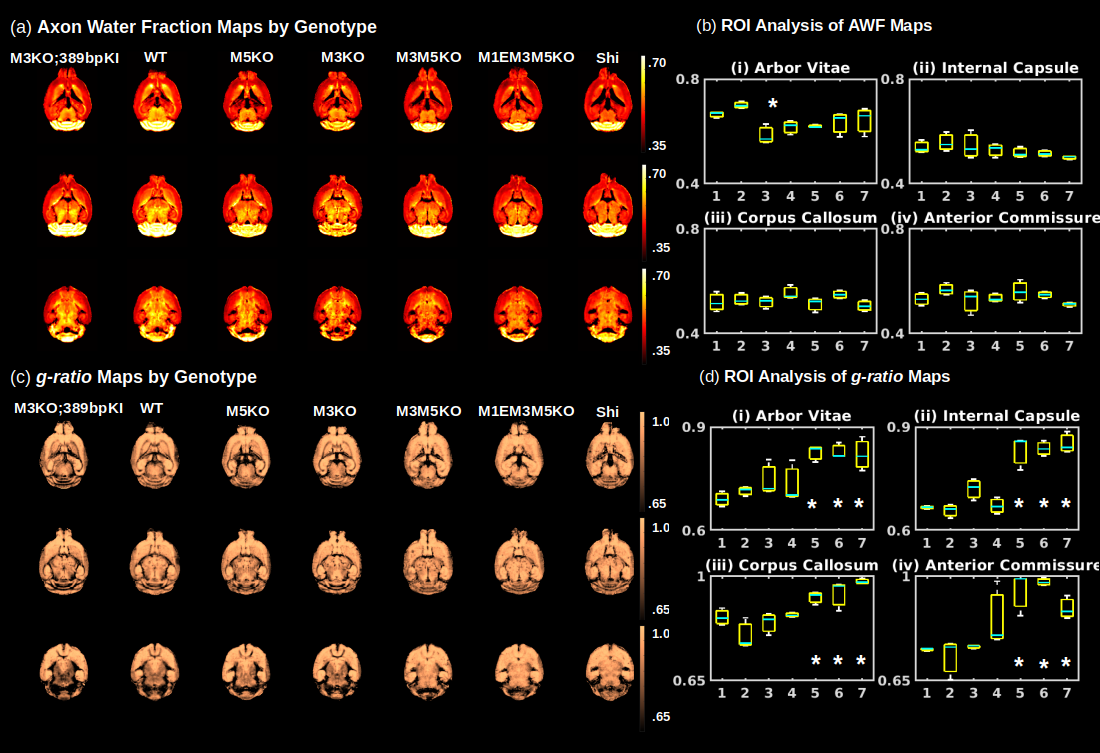
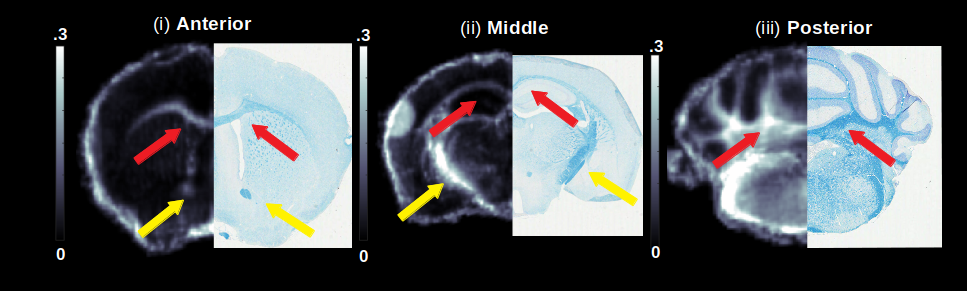
Gluteraldehyde fixed brains of 23 adult mice (P30) were used in this study. The number of brains used from each mouse strain and the corresponding Mbp/Golli mRNA measurements derived from quantitative reverse transcriptase polymerase chain reaction are detailed in Fig. 2(b). All imaging was performed using the Bruker (Rheinstetten, Germany) Pharmascan 7 Tesla, Pre-Clinical MRI system. Multi-echo gradient echo, T2*-weighted image volumes (2 ms first echo time and 2 ms echo spacing; 24 echoes; matrix size of 135 x 106 x 120; 100 um isotropic resolution) were acquired using a 3D mGRE sequence with a bipolar readout. Diffusion weighted volumes (b-values: 30 directions at 2500 s/mm2; 60 directions at 4000 s/mm2; matrix size 80x64x90; 150 um isotropic spatial resolution) were also acquired using a custom diffusion-weighted gradient and spin echo (dwGRASE) sequence4. Whole brain MWF maps were reconstructed using BSS-rPCA. The NODDI model (Din=0.75x10⁻³mm2/s; Diso=2.0x10⁻³mm2/s) was implemented using the AMICO software5. In combination with MWF, NODDI-derived parameter maps were applied to compute whole brain AWF and g-ratio maps, based on a biophysical model of CNS water proton pools and the MRI g-ratio paradigm6,7. All parameter maps were registered to a high resolution anatomical atlas8 using linear affine and deformable registration implemented in ANTs software9. Regions of interest (ROIs) were parcellated utilizing white matter (WM) masks included with the anatomical atlas. Preliminary histological correlates of BSS-rPCA were obtained by comparing MWF maps with corresponding tissue sections stained for myelin phospholipids using Luxol Fast Blue (LFB).Results and Discussion
An analysis of the separation of myelin water components utilizing BSS-rPCA is presented in Fig.1(a). Visual inspection of the unit rank components as a function of echo time suggest that L2 has a more rapid temporal decay profile. The S component emphasizes residual signal. Whole brain mono-exponential fitting of T2*decay (Fig.2(b)) yielded distributions of T2* in the slowly decaying pool (T2*~50.1msec) and rapidly decaying pool (T2*~19.1 msec) that correspond well to previously reported values. Whole brain MWF maps exhibited hypointensity in major white matter tracts (Fig 2(a)) of the mice with hypomyelinating profiles. A statistically significant difference in MWF, as evidenced by multicomparison ANOVA (p < 0.05), relative to wild-type mice was detected in all WM ROIs examined for the M3M5KO, M1EM3M5KO, and Shi genotypes. In contrast, no differences were observed in AWF (Fig.3(a)) ROIs across all genotypes, with the exception of the arbor vitae of the M5KO (Fig.3(b)). Finally, ROI analysis of whole brain g-ratio maps exhibited an opposite trend to that observed for MWF, suggesting that increases in g-ratio may be exclusively ascribed to decreases in myelin content when the AWF is relatively stable (Fig.3(c&d)). The sensitivity of BSS-rPCA to voxel-averaged estimates of myelin content is demonstrated by visual correspondence of the MWF to LFB histology in coronal slices of a single mouse brain (Fig.4). These encouraging results support the integration of BSS-rPCA derived MWF maps for ultra-high resolution mapping of myelination in pre-clinical models of human neurological disorders. It is unclear whether the inability of the BSS-rPCA to distinguish wild-type from the hypermyelinating strain (1.M3KO;389bpKI) and the mildly hypomyelinating strains (3.M5KO&4.M3KO) is due to sample size or a physiological effect involving the non-linear relationship between Mbp/Golli mRNA and myelin elaboration. We hope to disambiguate this relationship in future studies by acquiring myelin histology information for all genotypes.Conclusion
The present study demonstrated the sensitivity of BSS-rPCA to myelin content in a panel of differently myelinating mouse phenotypes. Future studies will incorporate quantitative histology to concretely establish the correspondence between BSS-rPCA MWF and myelin content.Acknowledgements
The authors gratefully acknowledge funding support from the Healthy Brains for Healthy Lives Graduate Fellowship of Vladimir Grouza, as well as the Natural Sciences and Engineering Research Council of Canada Discovery Grant of Dr. David Rudko (Grant Number: RGPIN/05047-2018).References
1. Song JE, Shin J, Lee H, Lee HJ, Moon W, Kim DH. Blind Source Separation for Myelin Water Fraction Mapping Using Multi-Echo Gradient Echo Imaging. IEEE Transaction in Medical Imaging, 2020;39(6):2235-2245.
2. Bagheri H, Friedman H, Siminovitch K, Peterson AC. Transcriptional regulators of the Golli/myelin basic protein locus integrate additive and stealth activities. PLoS Genetics 2020.
3. Zhang H, Schneider T, Wheeler-Kingshott CA, Alexander DC. NODDI: practical in vivo neurite orientation dispersion and density imaging of the human brain. Neuroimage, 2012; 61(4):1000-16.
4. Wu D, Xu J, McMahon MT, van Zijl PCM, Mori S, Northington FJ, and Zhang J. In vivo high-resolution diffusion tensor imaging of the mouse brain. Neuroimage. 2013; 83: 18-26.
5. Daducci D, Gonzalez-Rodriguez EJ, Zhang H, Dyrby TB, Alexander DC, Thiran JP. Accelerated Microstructure Imaging via Convex Optimization (AMICO) from diffusion MRI data. Neuroimage, 2015; 105:32-44.
6. West KL, Kelm ND, Carson RB, Alexander DC, Gochberg DF, Does MD. Experimental studies of g-ratio MRI in ex vivo mouse brain. Neuroimage, 2018; 167:366-371.
7. Stikov, N et al. In vivo histology of the myelin g-ratio with magnetic resonance imaging. Neuroimage, 2015; 118:397-405.
8. Dorr-Steadman-Ullman-Richards-Qui-Egan (40 micron DSURQE) atlas (2016); Mouse Imaging Center, Toronto, Ontario, Canada. Retrieved from https://wiki.mouseimaging.ca/display/MICePub/Mouse+Brain+Atlases
9. Avants B, Tustison N, and Song, G. (2008). Advanced normalization tools (ANTS). Insight J. 1–35.
Figures