0523
Accounting for covariance in studies of multimodal microstructure - a model for multivariate quantification in health and disease1Physics, Concordia University, Montreal, QC, Canada, 2Montreal Heart Institute, Montreal, QC, Canada, 3Electrical and Computer Engineering, Concordia University, Montreal, QC, Canada, 4Psychology, Concordia University, Montreal, QC, Canada, 5Biospective Inc., Montreal, QC, Canada, 6Neurology and Neurosurgery, Montreal Neurological Institute and Hospital, Montreal, QC, Canada, 7McConnell Brain Imaging Centre, Montreal Neurological Institute, Montreal, QC, Canada, 8Ludmer Centre for NeuroInformatics and Mental Health, Montreal, QC, Canada, 9Neurology, Max Planck Institute for Human Cognitive and Brain Sciences, Leipzig, Germany
Synopsis
Multivariate approaches have recently gained in popularity to address the physiological unspecificity of neuroimaging metrics and to better characterize the complexity of biological processes underlying behavior. However, approaches commonly used are biased by the covariance between variables. Here, we propose computing the voxel-wise Mahalanobis distance (MhD), as a measure of deviation from normality that accounts for covariance between metrics. We show that this measure can be linked to behavior and to potential physiological underpinnings by extracting metrics contributing most to the MhD. Integrative multivariate models are crucial to expand our understanding of the multiple factors underlying disease development and progression.
Introduction
As no metric derived from neuroimaging is a perfect representation of the underlying tissue microstructure1,2, but since each one has the potential to provide insights on some aspects of physiology, multivariate approaches have recently gained in popularity3–5. This has the potential to not only counteract the issues arising from the fact that neuroimaging metrics are physiologically unspecific, but also to capture the complexity and heterogeneity of biological processes underlying behavior in health and disease in a more holistic manner2,4,6,7. Indeed, it is highly likely that several mechanisms are at play in the development of neurological disorders8 and that cognitive performance relates better to multiple brain features than to single metrics4.Multiparametric approaches appear promising in studying pathological alterations in white matter (WM) microstructure in a number of conditions. For instance, multivariate measures were found to show stronger associations with epilepsy duration than any univariate measure in epileptic patients6. However, some studies using multiparametric approaches ignore the shared covariance between metrics, which has the potential to bias inferences made from such analyses (e.g., 4).
To overcome these issues, we propose a method that allows the estimation of multivariate differences in white matter microstructure that accounts for covariance between metrics. One of the applications of this approach is the spatially specific (i.e., voxel-wise) quantification of the extent to which an individual’s brain differs from a normative brain, according to multiple features derived from MRI. The multivariate measure obtained can then be correlated to scores on various tasks or to disease outcomes for instance, to investigate links to behavior.
Methods
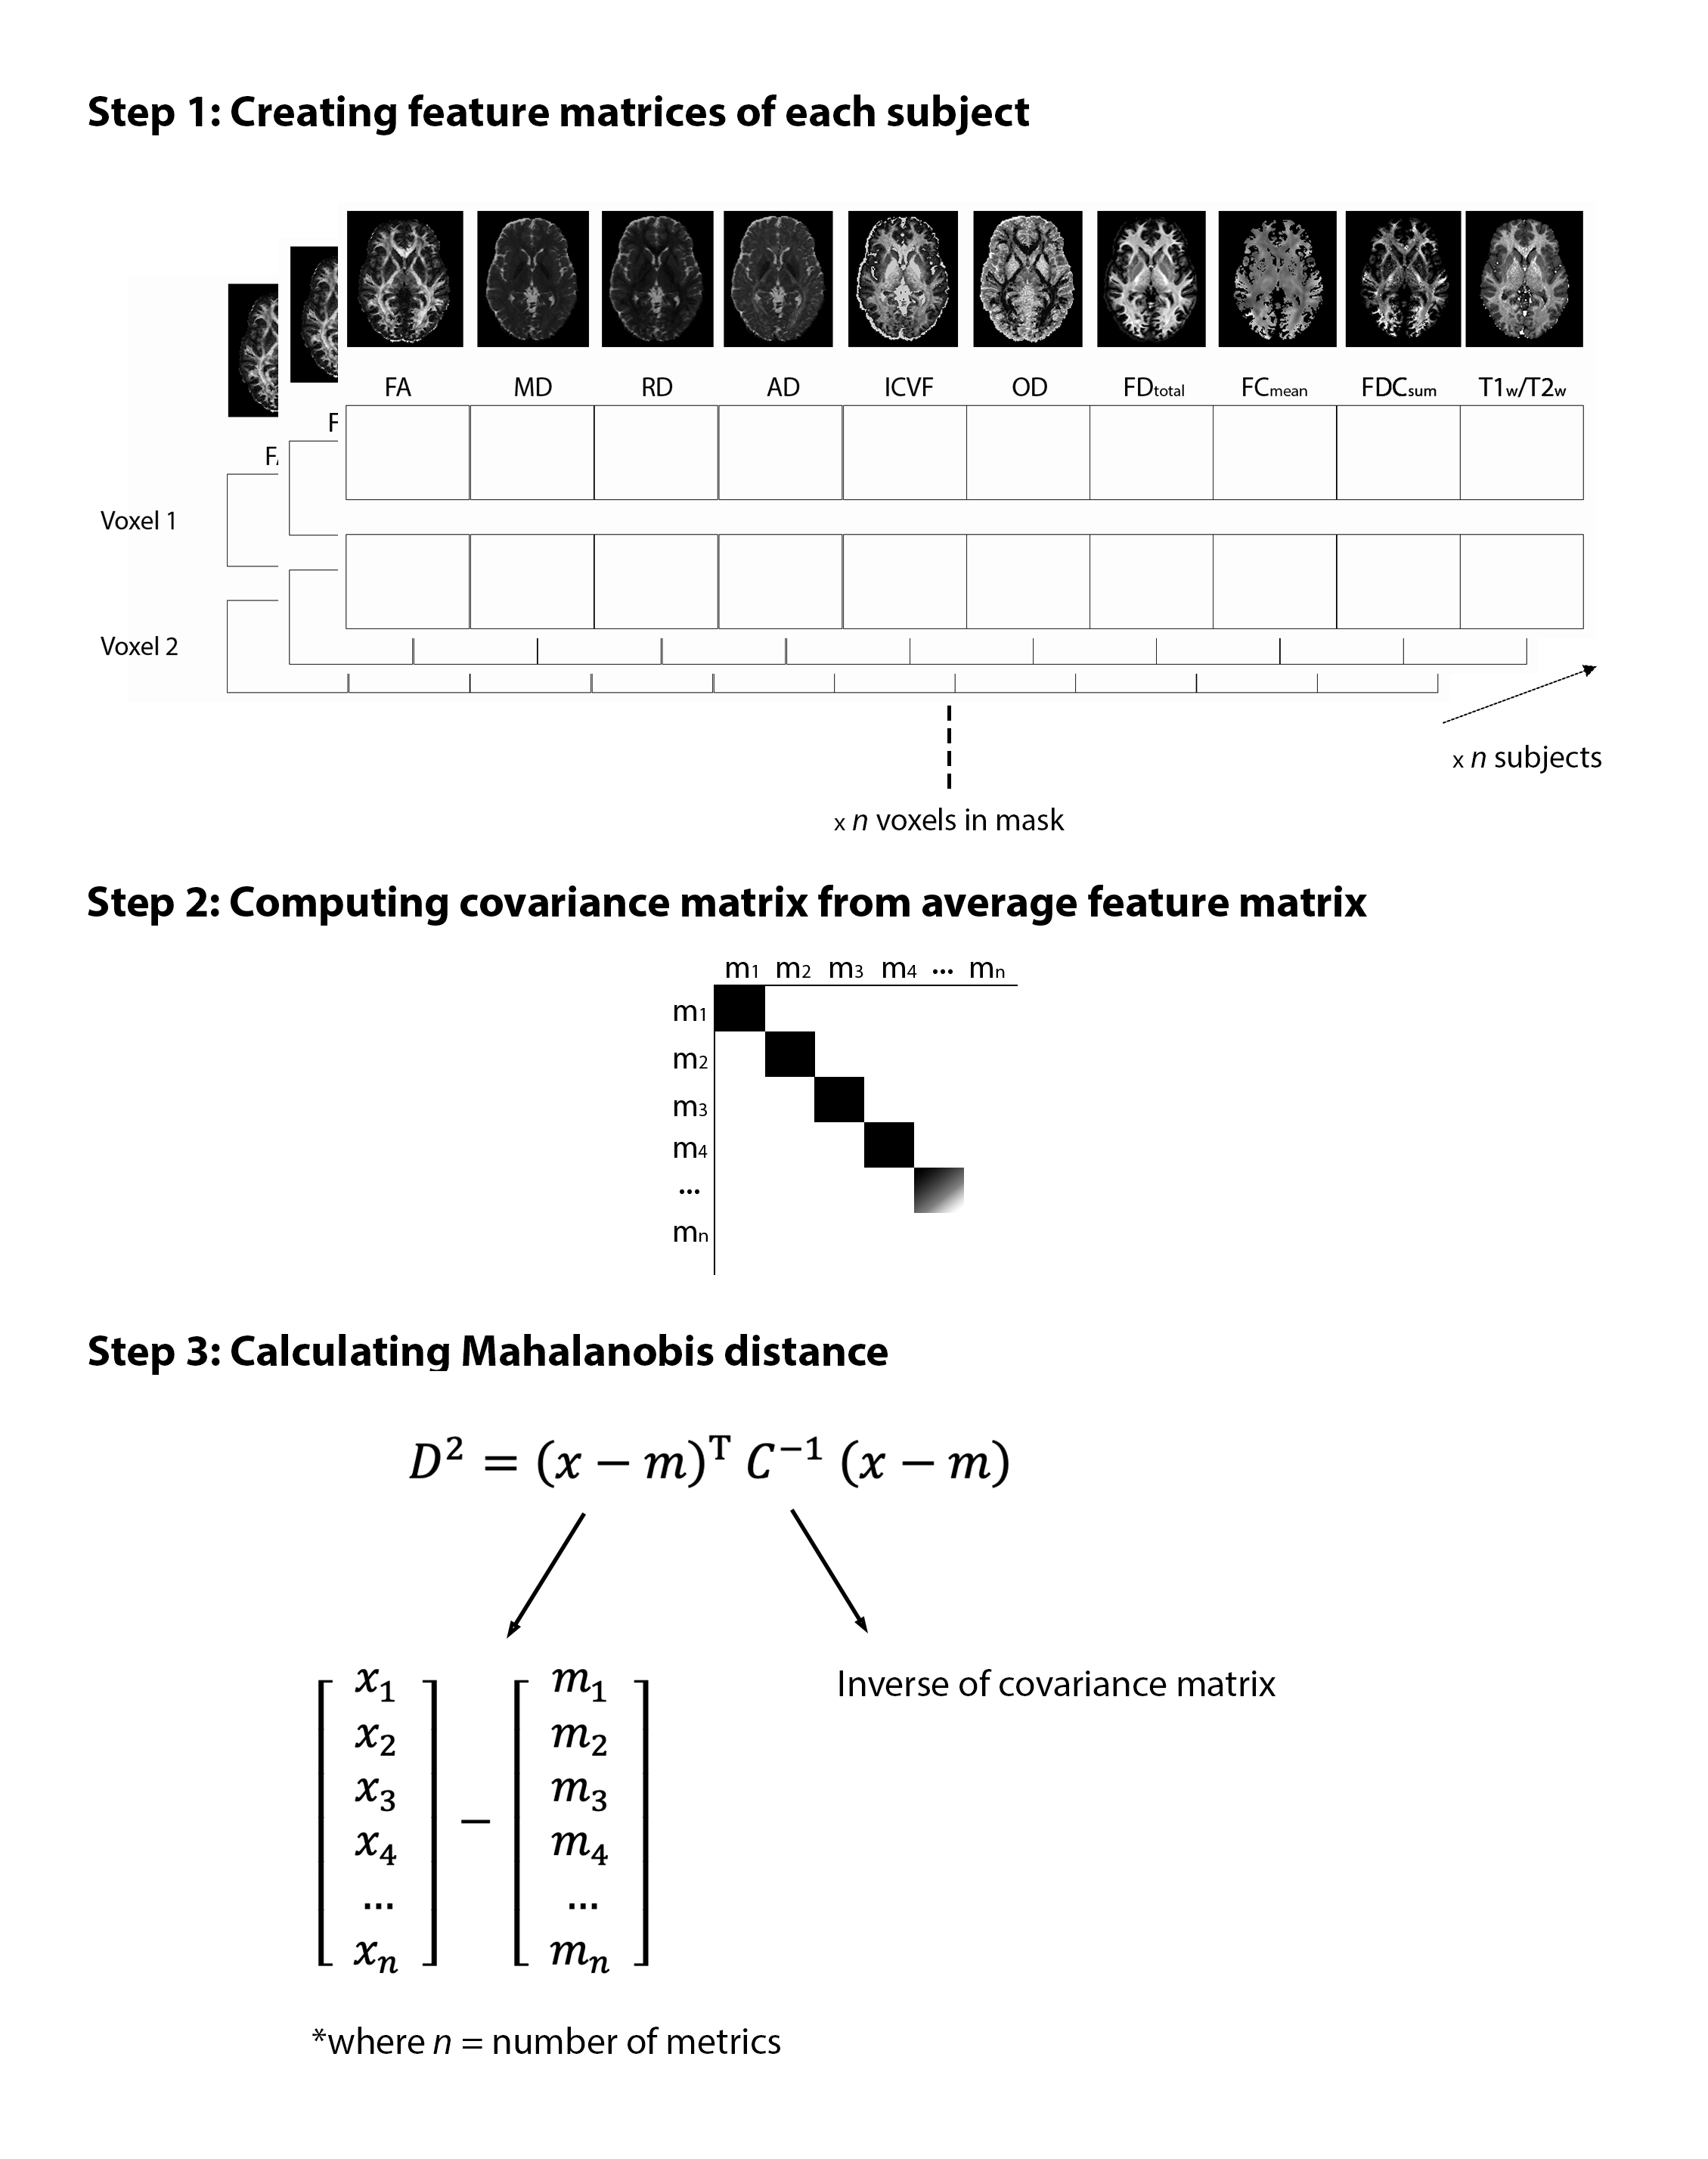
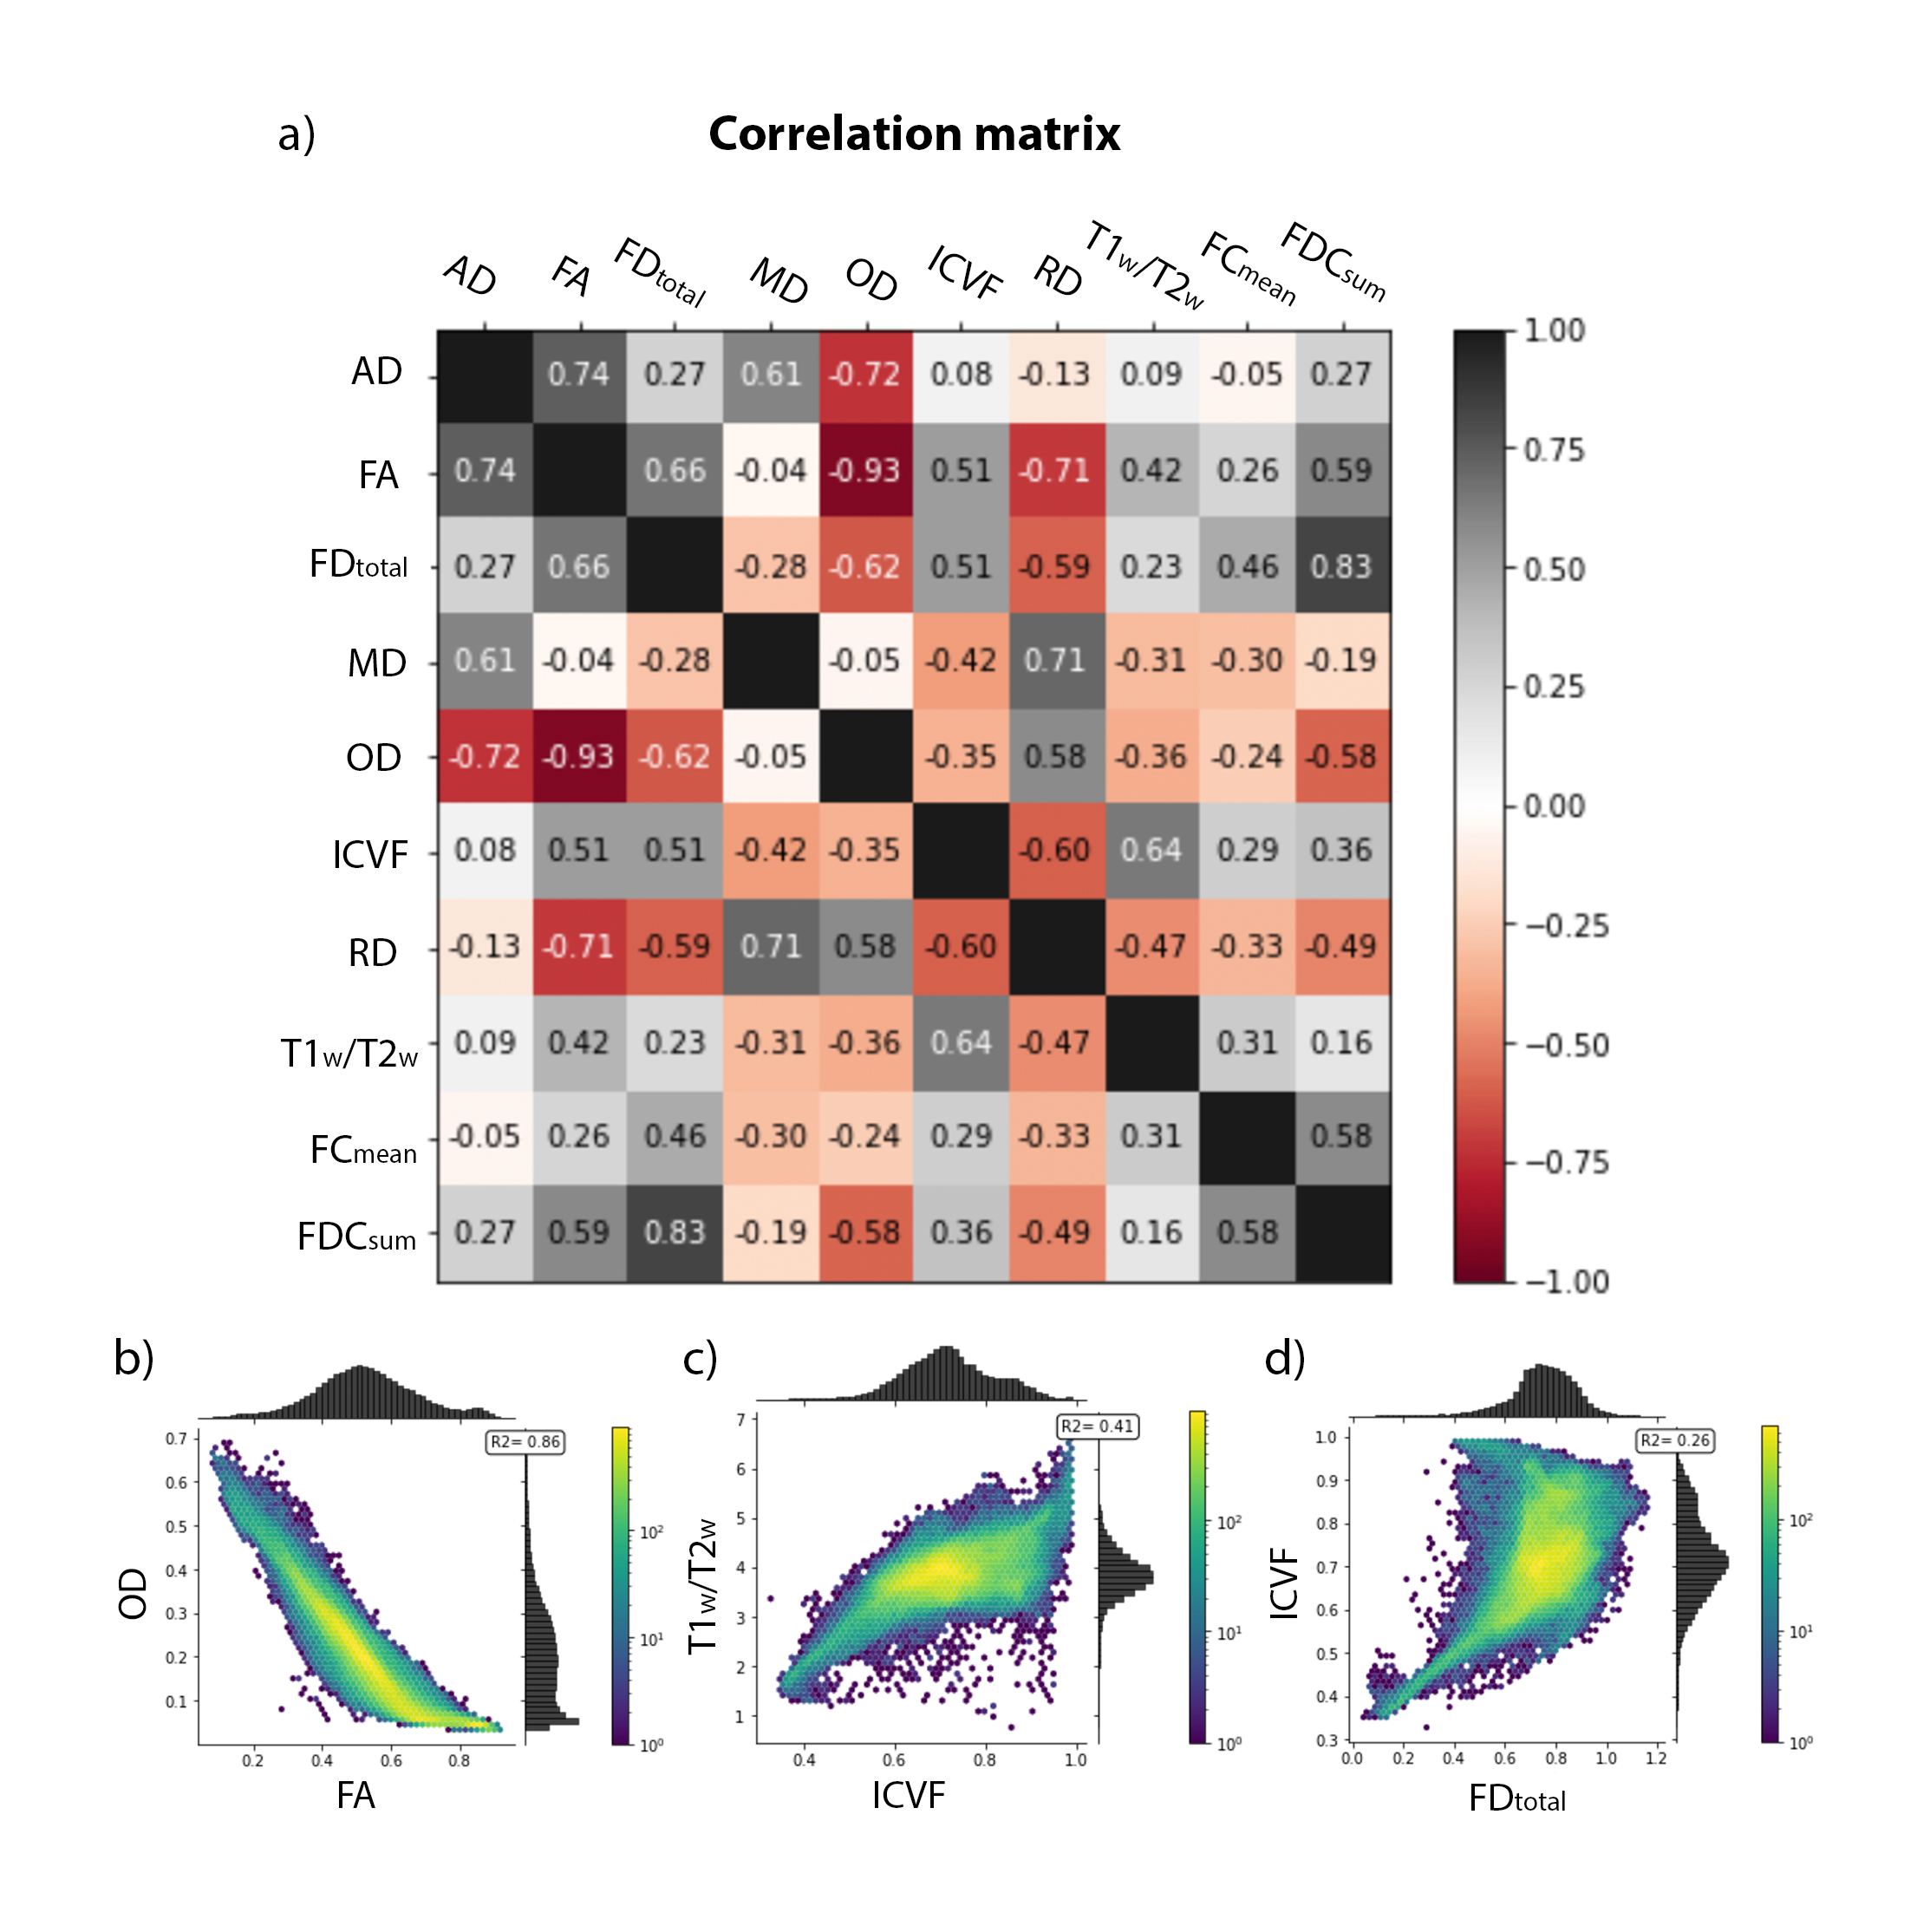
Diffusion-weighted imaging (DWI), T1- and T2-weighted data from the Human Connectome Project (HCP) S1200 release (www.humanconnectome.org) were used in this study. The imaging data of 1001 young healthy adults, those who had undergone T1w, T2w and DWI, were used. The tensor was computed on the bias field-corrected DWI data and DTI metrics were computed (FA, MD, AD and RD)9. Constrained spherical deconvolution was performed to obtain the fiber orientation distribution (FOD), from which fiber density (FD), fiber cross-section (FC) and FDC (FD*FC) were computed following the fixel-based analysis framework10,11. DWI data was also fitted to the neurite orientation dispersion and density imaging (NODDI) model using Accelerated Microstructure Imaging via Convex Optimization (AMICO) to obtain the intracellular volume fraction (ICVF) and the orientation dispersion index (OD)12,13. Multi-contrast registration was performed to optimize the alignment of WM and gray matter. The T1w/T2w ratio was then calculated and fixel metrics were transformed into voxel space.Ten voxel-wise maps were thus created for each subject, resulting in a feature matrix of size [voxels in white matter] x 10 features x n subjects (Fig. 1, Step 1). Group average maps were computed, and the covariance matrix was then generated from the average feature matrix (Fig. 1, Step 2 and Fig. 2a). The Mahalanobis distance (MhD) between each subject and the model (i.e., group average) was calculated using the equation shown in Fig. 1, Step 3.
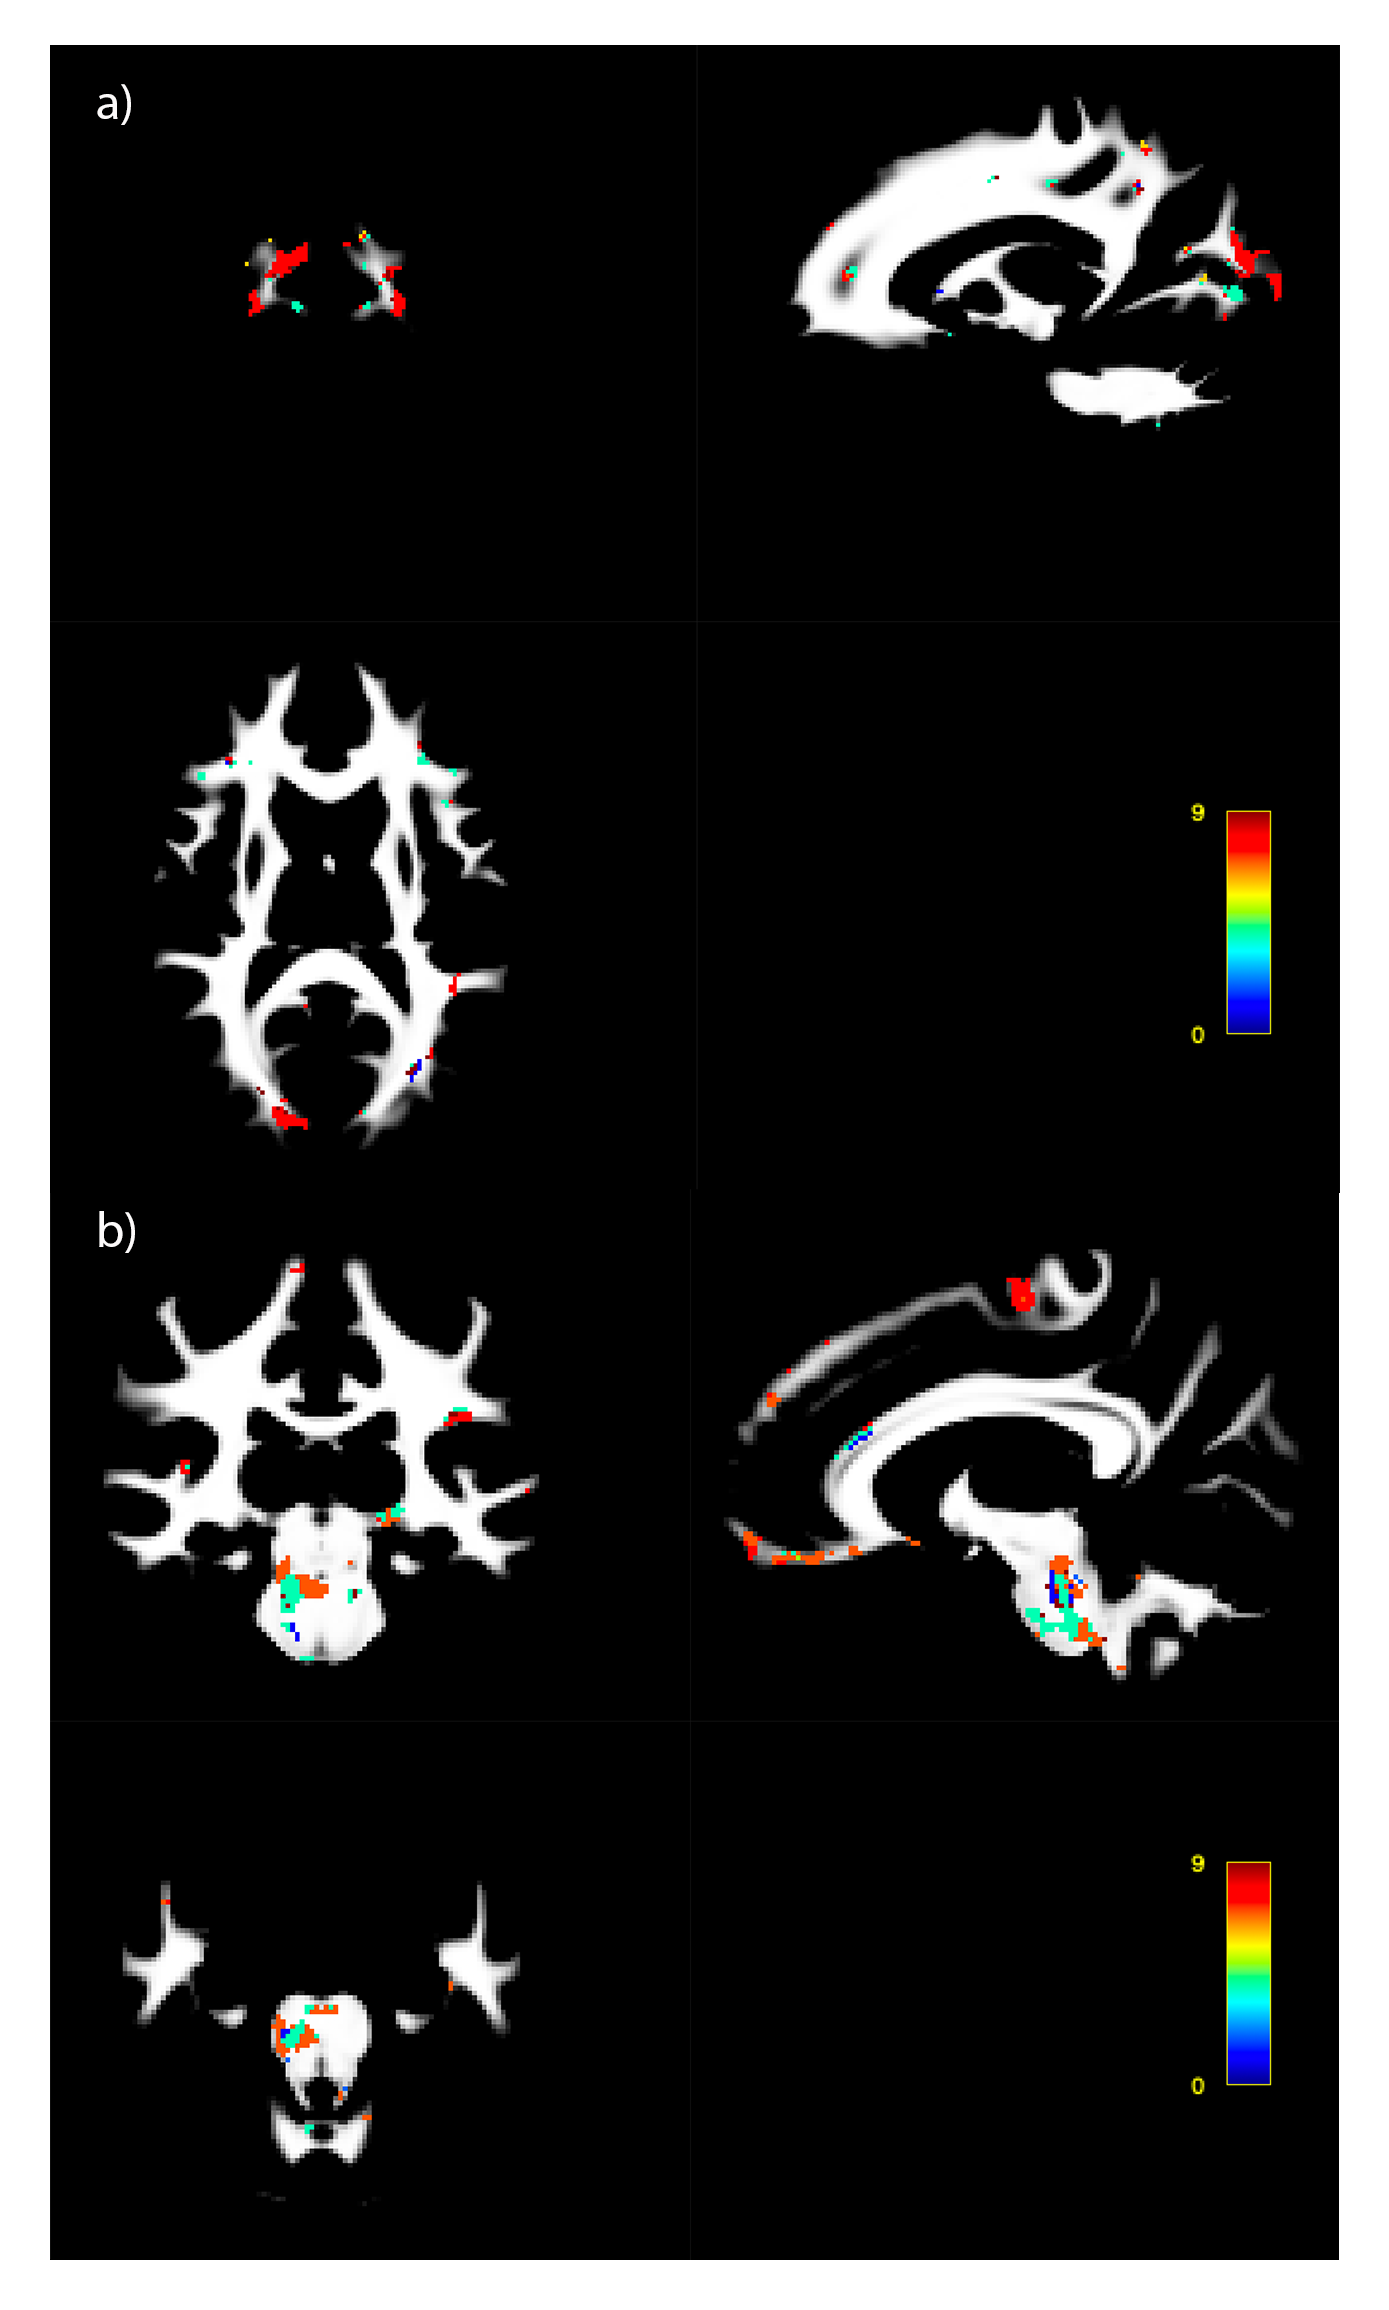
Lastly, voxel-wise regression analyses were performed between the MhD maps and scores on two cognitive (Flanker task, measuring selective attention, and Pattern Completion Processing Speed) and two motor tasks (9-hole pegboard measure of manual dexterity, and Grip Strength Dynamometry). The percentage contribution of each feature was then calculated in the regions where correlations were highest to reveal potential underlying biological mechanisms.
Results
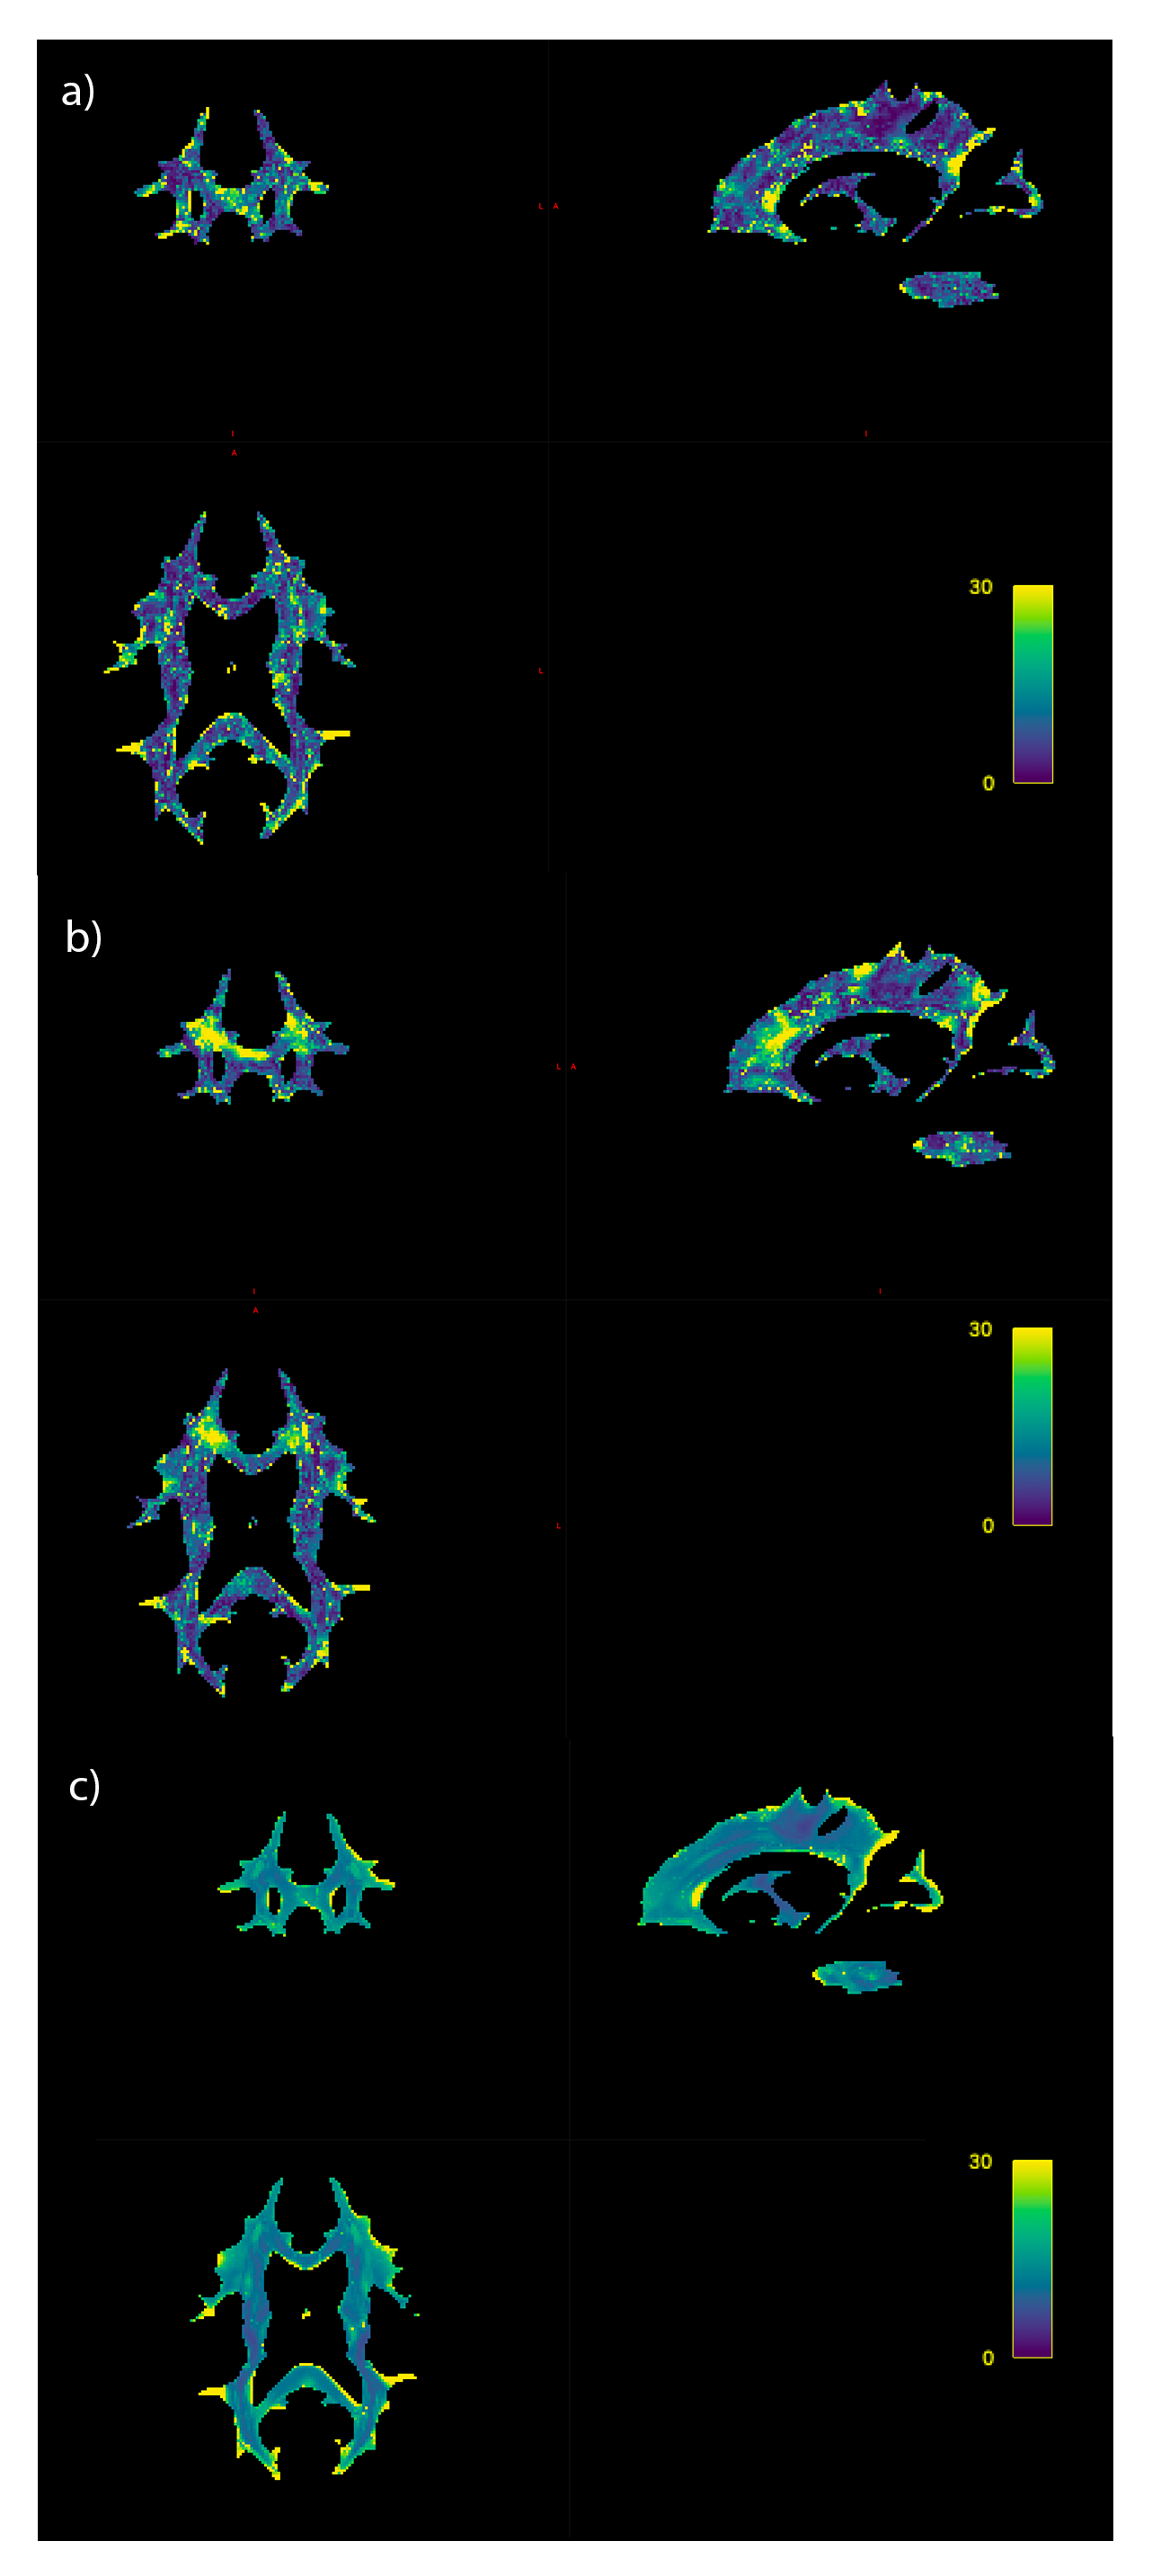
The high amount of correlation between metrics is evident in the metric-metric correlation matrix in Fig. 2, highlighting the importance of accounting for covariance in multivariate approaches. Example distance maps are shown in two subjects in Fig. 3. We can observe, for instance, greater distances in the corpus callosum in the second subject relative to the mean model (Fig. 3b) than in the first (a). The mean distance map across all participants (Fig. 3c) shows greater distances in the occipital and parietal lobes, cortico-spinal tract, pons, and genu of the corpus callosum - reflecting greater interindividual differences in these regions.Regression analyses showed that MhD had specific spatial distributions in its relationships with behavior, as evidenced by the distinct correlation patterns that can be observed for each task (Fig. 4). Fig. 5 shows the metrics that contributed most to the MhD in ROIs of stronger correlation (95th percentile of absolute r-values). For instance, FC and OD contributed the most to the MhD in the ROI where high positive correlations with the Flanker task were identified (Fig. 5a).
Conclusion
In this study, we introduced a multivariate approach that allows the combination of multiple parameters while accounting for the covariance between metrics. The Mahalanobis distance has been used in previous work to characterize pathological brain changes in various disorders applied over regions of interest5–7. We extend this approach by integrating metrics from multiple modalities to compute a voxel-specific measure of deviation from normality that can be linked to behavior and to potential physiological underpinnings. Multivariate approaches have broad potential clinical applications. For instance, the characterization of brain abnormalities at an individual level could contribute to the development of personalized intervention strategies and aid in improving diagnosis accuracy, despite high levels of heterogeneity in some neurological disorders14.Acknowledgements
SAT was supported by the Canadian Institutes of Health Research (CIHR: FBD 175862).
CJS was supported by the Max Planck Society, the Natural Science and Engineering Research Council (NSERC: RGPIN-2020-06812, DGECR-2020-00146), the Heart and Stroke Foundation of Canada New Investigator Award, and the Canadian Institutes of Health Research (HNC 170723).
CJG was supported by the Heart and Stroke Foundation New Investigator Award and J.M. Barnett fellowhip, the Michal and Renata Hornstein Chair in Cardiovascular Imaging, and the Heart and Stroke Foundation Grant-in-Aid G-17-0018336.
YI-M and CJS were supported by the BIC-Concordia Collaboration Program.
References
1. Novikov DS, Kiselev VG, Jespersen SN. On modeling. Magn Reson Med. 2018;79(6):3172-3193. doi:10.1002/mrm.27101
2. Tardif CL, Gauthier CJ, Steele CJ, et al. Advanced MRI techniques to improve our understanding of experience-induced neuroplasticity. Neuroimage. 2016;131:55-72.
3. Iturria-Medina Y, Sotero RC, Toussaint PJ, Mateos-Pérez JM, Evans AC. Early role of vascular dysregulation on late-onset Alzheimer’s disease based on multifactorial data-driven analysis. Nat Commun. 2016;7(1):11934. doi:10.1038/ncomms11934
4. Seidlitz J, Váša F, Shinn M, et al. Morphometric Similarity Networks Detect Microscale Cortical Organization and Predict Inter-Individual Cognitive Variation. Neuron. 2018;97(1):231-247.e7. doi:10.1016/j.neuron.2017.11.039
5. Dean DC, Lange N, Travers BG, et al. Multivariate characterization of white matter heterogeneity in autism spectrum disorder. NeuroImage Clin. 2017;14:54-66. doi:10.1016/j.nicl.2017.01.002
6. Owen TW, de Tisi J, Vos SB, et al. Multivariate white matter alterations are associated with epilepsy duration. Eur J Neurosci. 2021;53(8):2788-2803. doi:10.1111/ejn.15055
7. Taylor PN, Silva NM da, Blamire A, Wang Y, Forsyth R. Early deviation from normal structural connectivity: A novel intrinsic severity score for mild TBI. Neurology. 2020;94(10):e1021-e1026. doi:10.1212/WNL.0000000000008902
8. Iturria-Medina Y, Carbonell FM, Sotero RC, Chouinard-Decorte F, Evans AC. Multifactorial causal model of brain (dis)organization and therapeutic intervention: Application to Alzheimer’s disease. NeuroImage. 2017;152:60-77. doi:10.1016/j.neuroimage.2017.02.058
9. Tournier JD, Smith R, Raffelt D, et al. MRtrix3: A fast, flexible and open software framework for medical image processing and visualisation. NeuroImage. Published online 2019:116137.
10. Jeurissen B, Tournier JD, Dhollander T, Connelly A, Sijbers J. Multi-tissue constrained spherical deconvolution for improved analysis of multi-shell diffusion MRI data. NeuroImage. 2014;103:411-426. doi:10.1016/j.neuroimage.2014.07.061
11. Raffelt DA, Tournier JD, Smith RE, et al. Investigating white matter fibre density and morphology using fixel-based analysis. NeuroImage. 2017;144:58-73. doi:10.1016/j.neuroimage.2016.09.029
12. Zhang H, Schneider T, Wheeler-Kingshott CA, Alexander DC. NODDI: Practical in vivo neurite orientation dispersion and density imaging of the human brain. NeuroImage. 2012;61(4):1000-1016. doi:10.1016/j.neuroimage.2012.03.072
13. Daducci A, Canales-Rodríguez EJ, Zhang H, Dyrby TB, Alexander DC, Thiran JP. Accelerated Microstructure Imaging via Convex Optimization (AMICO) from diffusion MRI data. NeuroImage. 2015;105:32-44. doi:10.1016/j.neuroimage.2014.10.026
14. Brammer M. The role of neuroimaging in diagnosis and personalized medicine-current position and likely future directions. Dialogues Clin Neurosci. 2009;11(4):389-396.
Figures