0522
First templates of human brain kurtosis sources: relevance of microscopic kurtosis from Correlation Tensor MRI at 3 Tesla1Center for Mind/Brain Sciences - CIMeC, University of Trento, Rovereto (Trento), Italy, 2Champalimaud Research, Champalimaud Centre for the Unknown, Lisbon, Portugal, 3Siemens Healthcare GmbH, Erlangen, Germany, 4Center for Medical Sciences - CISMeD, University of Trento, Rovereto (Trento), Italy
Synopsis
The Correlation Tensor MRI (CTI) framework has been recently formulated to disentangle anisotropic, isotropic, and microscopic kurtosis sources without a priori assumptions from Double-Diffusion-Encoding (DDE) data. In this work, group average maps (templates) are presented for the first time, thereby mapping the contrasts for anisotropic and isotropic kurtosis, and non-vanishing positive microscopic kurtosis in grey and white matter. The relative weight of the microscopic kurtosis within the total kurtosis, and the bias associated with neglecting this component under the Multiple Gaussian Component assumption are investigated and suggest that this component significantly contributes to the total diffusional kurtosis.
Introduction
Diffusion Kurtosis Imaging (DKI) represents a cornerstone of diffusion MRI (dMRI) techniques for brain microstructure investigations, but despite providing higher sensitivity, e.g., in lesions, its metrics lack specificity1-5. Hence, disentangling the diffusional kurtosis sources from total kurtosis (Kt) is a promising avenue for achieving higher specificity. Recently, the Correlation Tensor Imaging (CTI) framework, based on correlations exposed in Double Diffusion Encoding (DDE) signals4,6,7, has been formulated to characterize the diffusional kurtosis sources (anisotropic, isotropic, and microscopic kurtosis, abbreviated as Kaniso, Kiso, and μK, respectively) without a priori assumptions on the nature of the microstructure (except for negligible exchange). In particular, the CTI approach does not assume that the diffusion process in all microdomains is a combination of Gaussian diffusion propagators (Multiple Gaussian Components, or MGC assumption4,7), which is equivalent to ignoring the μK component. While initially demonstrated in preclinical settings4,5,7, the CTI framework has been recently successfully translated for human clinical MRI scanners8. In this work, we report initial human brain group average maps (templates) for each kurtosis source, investigating in particular the μK component. We further analyze the relative weight of each kurtosis source on total kurtosis and the bias associated with neglecting the microscopic component on the estimation of the other sources under the MGC assumption.Methods
Acquisition: Data from N=8 healthy adults (mean(SD) age: 30.9(4.9), 5 males) were acquired using a 3T clinical scanner (MAGNETOM Prisma, Siemens Healthcare, Erlangen, Germany) with a 64-channel head-neck RF receive coil. A prototype double-spin-echo DDE sequence was used: TR/TE 5600 ms/127 ms, 2.5 mm isotropic voxels, full-brain axial coverage, GRAPPA/SMS 2/4, δ/Δ/τM = 15.8 ms/31.8 ms/32.3 ms. Four sets of DDE images were acquired7 (b1/s/mm2, b2/s/mm2, angle): set #1 (1000, 0, 0°), set #2 (2000, 0, 0°), and set #3 (1000, 1000, 0°) as parallel DDE sets, and set #4 (1000, 1000, 90°) as the orthogonal DDE set9. All sets were acquired twice by alternating the diffusion gradient polarities to mitigate cross terms with imaging gradients. b=0 s/mm2 volumes were acquired every 12 diffusion-weighted volumes, and two b=0 s/mm2 volumes with opposite phase encoding were added for geometric distortion correction. A T1-weighted multi-echo MPRAGE image10 (resolution: 1 mm-isotropic) was acquired for anatomical reference. The acquisition time of the diffusion protocol was 52 min.Image processing: dMRI data were denoised11, and corrected for Gibbs ringing12, eddy currents, head motion13, geometric distortions, signal drift14, bias field, cross-terms with imaging gradients15. Powder average (p.a.) images were generated per each set and normalized (p.a.norm) by the mean b=0 s/mm2 image. p.a.norm images were warped to the MNI-2mm template via a two-step affine and non-linear registration in ANTs. The across-subject average of warped p.a.norm images was computed per each set to perform a CTI fit of averaged data, which were fitted according to the following equation:
$$ log(\overline{E}_{DDE}(b_1,b_2,\theta))=-(b_1+b_2)\overline{D}+\frac{1}{6}(b_1^2+b_2^2)\overline{D}^2K_t+\frac{1}{2}b_1b_2cos^2\theta\overline{D}^2K_{aniso}+\frac{1}{6}b_1b_2\overline{D}^2(2K_{iso}-K_{aniso}) + O(b^3) $$
with b1 and b2 being the b-values of the first and second pairs of gradients, $$$\overline{D}$$$ being the total diffusivity, and θ the angle between the directions of the first and the second pairs of diffusion gradients. For all maps, values were extracted from the following Regions of Interest (ROIs) derived from the intersection of individual T1w segmentations (FreeSurfer’s recon-all): Cerebro-Spinal Fluid (CSF) in lateral ventricles, cerebral White Matter (WM), cerebellar WM (WMCBM), Grey Matter (GM), cerebellar Grey Matter (GMCBM), Amygdala (AMG), Caudate (Cd), Hippocampus (HPC), Globus Pallidus (GP), Putamen (PU), and Thalamus (TH). Maps of the relative weight of each kurtosis component on Kt were generated. To evaluate the effect of neglecting the μK component (i.e. under the MGC assumption) on the estimation of the other kurtosis sources, the averaged warped p.a.norm images were fitted with equation: $$ log(\overline{E}_{MGC}(b,b_\Delta))=-b_t\overline{D}+\frac{1}{6}b_t^2\overline{D}^2K_{iso}^{MGC}+\frac{1}{6}b_t^2b_\Delta^2\overline{D}^2K_{aniso}^{MGC}+O(b^3) $$
with bt being the cumulative b-value, and bΔ corresponding to 1 for parallel sets and to $$$-\frac{1}{2}$$$ for the orthogonal set #4, and the resulting maps were compared with CTI-derived maps7.
Results
Group average template maps are shown in Fig. 1. Consistent with our previous observations in individual maps8, group average maps revealed non-vanishing positive μK values in all tissues except CSF in lateral ventricles, as expected for Gaussian diffusion. Mean(SD) μK values are: CSF: 0.01(0.01); WM: 0.15(0.05); WMCBM: 0.15(0.07); GM: 0.13(0.05); GMCBM: 0.18(0.08); AMG: 0.18(0.08); Cd: 0.19(0.1); HPC: 0.11(0.05); GP: 0.14(0.05); PU: 0.19(0.05); TH: 0.13(0.05) (Fig. 2). The ratio of the μK component and Kt revealed that across brain tissues μK represents 8-20% of Kt (Fig. 3). The estimation of the kurtosis sources under the MGC assumption yielded lower Kt and larger Kaniso and Kiso estimates, with larger biases for larger (neglected) μK values (Fig. 4).Discussion and Conclusion
In agreement with experimental results in animals4,5,7 and individual data in humans8, our study confirms non-vanishing positive μK values at the group level in healthy adult brain tissue. This observation is in line with previous reports of time-dependent diffusion and kurtosis coefficients in the human brain from clinical MRI systems16,17. In addition, neglecting larger μK values, leads to biases in Kaniso and Kiso estimates. These results show first templates of each kurtosis component in the human brain. The observation for a unique source of contrast provided by μK opens promising opportunities to study tissue microstructure.Acknowledgements
The authors thank Stefano Tambalo for support with data acquisition. This research was supported by the Caritro Foundation, Italy, the European Research Council (ERC) under the European Union’s Horizon 2020 research and innovation programme (Starting Grant, agreement No. 679058), ”la Caixa” Foundation (ID 100010434) and European Union’s Horizon 2020 research and innovation programme under the Marie Skłodowska-Curie grant agreement No 847648, fellowship code CF/BQ/PI20/11760029.
References
[1] Lu, H., Jensen, J.H., Ramani, A., et al. Three-dimensional characterization of non-gaussian water diffusion in humans using diffusion kurtosis imaging. NMR Biomed. 2006. 19, 236–247.
[2] Henriques, R.N., Correia, M.M., Nunes, R.G., et al. Exploring the 3D geometry of the diffusion kurtosis tensor - Impact on the development of robust tractography procedures and novel biomarkers. Neuroimage. 2015, 111, 85–99.
[3] Szczepankiewicz, F., van Westen, D., Englund, E., et al. The link between diffusion MRI and tumor heterogeneity: Mapping cell eccentricity and density by diffusional variance decomposition (DIVIDE). Neuroimage. 2016. 142, 522–532.
[4] Henriques, R.N., Jespersen, S.N., Shemesh, N. Correlation tensor magnetic resonance imaging. Neuroimage. 2020, 211, 116605
[5] Alves, R., Henriques, R.N., Kerkelä, L., et al. Unraveling micro-architectural modulations in neural tissue upon ischemia by Correlation Tensor MRI. bioRxiv. 2021.
[6] Shemesh, N., Jespersen, S.N., Alexander, D.C., et al. Conventions and nomenclature for double diffusion encoding NMR and MRI. Magn. Reson. Med. 2016, 75, 82–87.
[7] Henriques, R.N., Jespersen, S.N., Shemesh, N. Evidence for microscopic kurtosis in neural tissue revealed by correlation tensor MRI. Magn. Reson. Med. 2021, 1–20.
[8] Novello, L., Henriques, R.N., Ianuş, A., et al. Human brain in vivo correlation tensor MRI on a clinical 3T system. Proc Intl Soc Mag Reson Med. 2021.
[9] Jespersen, S.N., Lundell, H., Sønderby, C.K., et al. Orientationally invariant metrics of apparent compartment eccentricity from double pulsed field gradient diffusion experiments. NMR Biomed. 2013, 26, 1647–1662.
[10] van der Kouwe, A.J.W., Benner, T., Salat, et al. Brain morphometry with multiecho MPRAGE. Neuroimage. 2008, 40, 559–569.
[11] Veraart, J., Novikov, D.S., Christiaens, D., et al. Denoising of diffusion MRI using random matrix theory. Neuroimage. 2016, 142, 394–406.
[12] Kellner, E., Dhital, B., Kiselev, et al. Gibbs-ringing artifact removal based on local subvoxel-shifts. Magn. Reson. Med. 2016, 76, 1574–1581.
[13] Andersson, J.L.R., Sotiropoulos, S.N.. An integrated approach to correction for off-resonance effects and subject movement in diffusion MR imaging. Neuroimage. 2016, 125, 1063–1078.
[14] Vos, S.B., Tax, C.M.W., Luijten, P.R., et al. 2017. The importance of correcting for signal drift in diffusion MRI. Magn. Reson. Med. 2017, 77, 285–299.
[15] Neeman, M., Freyer, J. P., & Sillerud, L. O. A simple method for obtaining cross‐term‐free images for diffusion anisotropy studies in NMR microimaging. Magn Reson Med. 1991, 21(1):138-143.
[16] Fieremans, E., Burcaw, L.M., Lee, H.H., et al. In vivo observation and biophysical interpretation of time-dependent diffusion in human white matter. Neuroimage. 2016, 129, 414–427.
[17] Lee, H.-H., Papaioannou, A., Novikov, D.S., et al. In vivo observation and biophysical interpretation of time-dependent diffusion in human cortical gray matter. Neuroimage. 2020, 222, 117054.
Figures
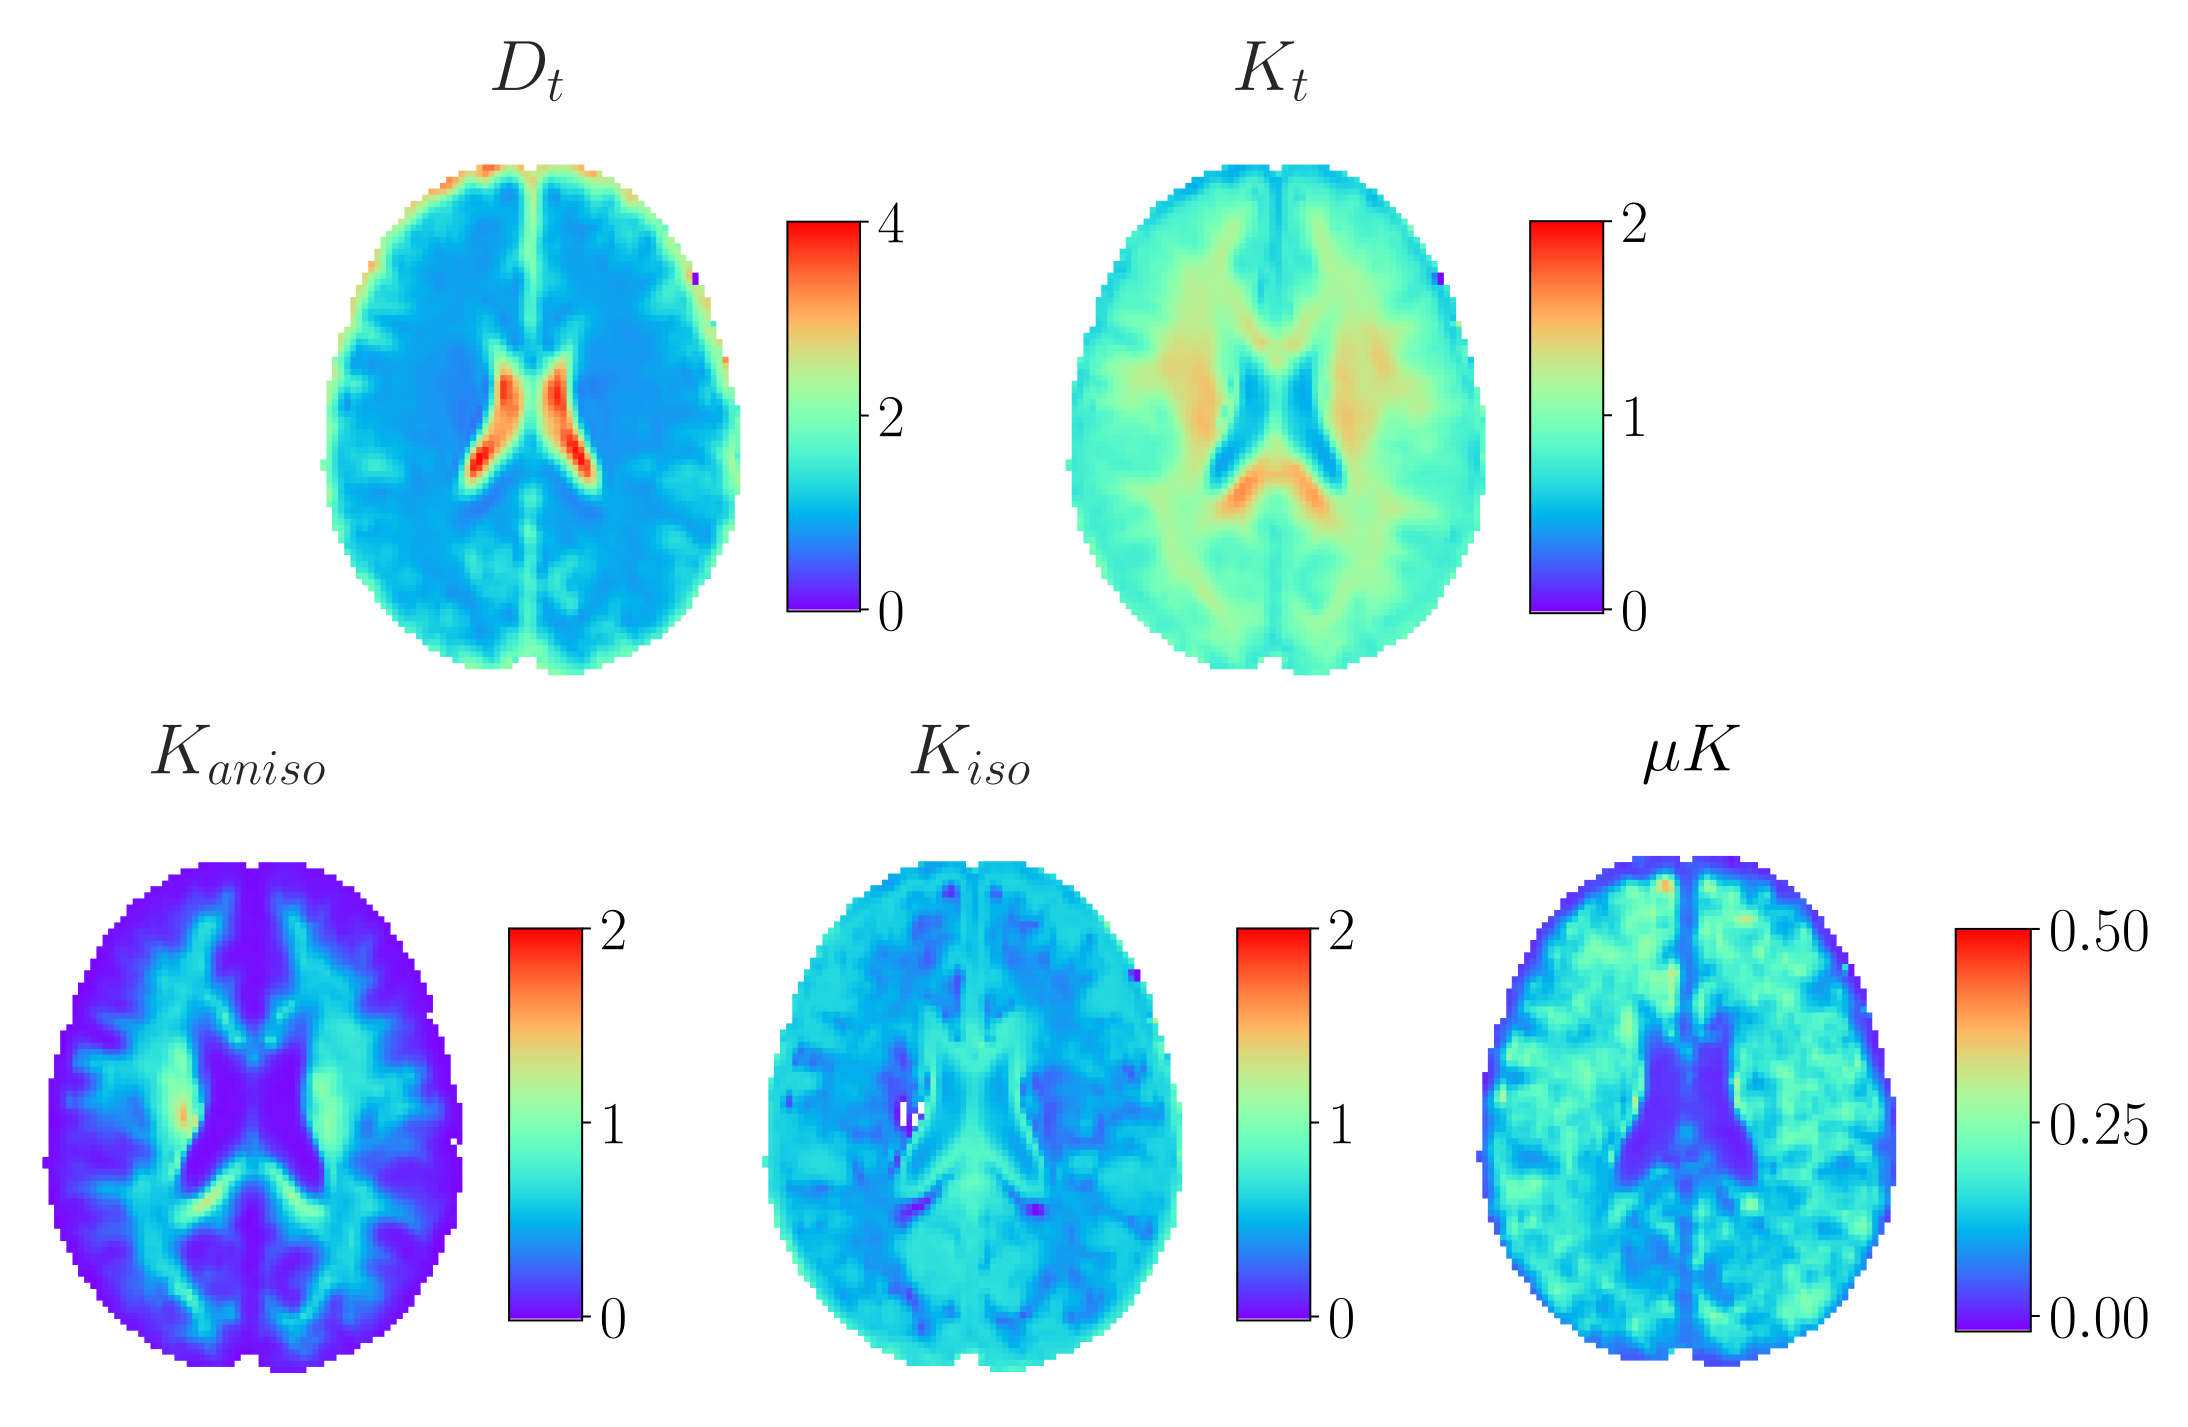
Fig. 1: group average template maps of CTI-derived total diffusivity (Dt), total kurtosis (Kt), anisotropic kurtosis (Kaniso), isotropic kurtosis (Kiso), and microscopic kurtosis (μK). Note the different colorbar ranges for different maps.
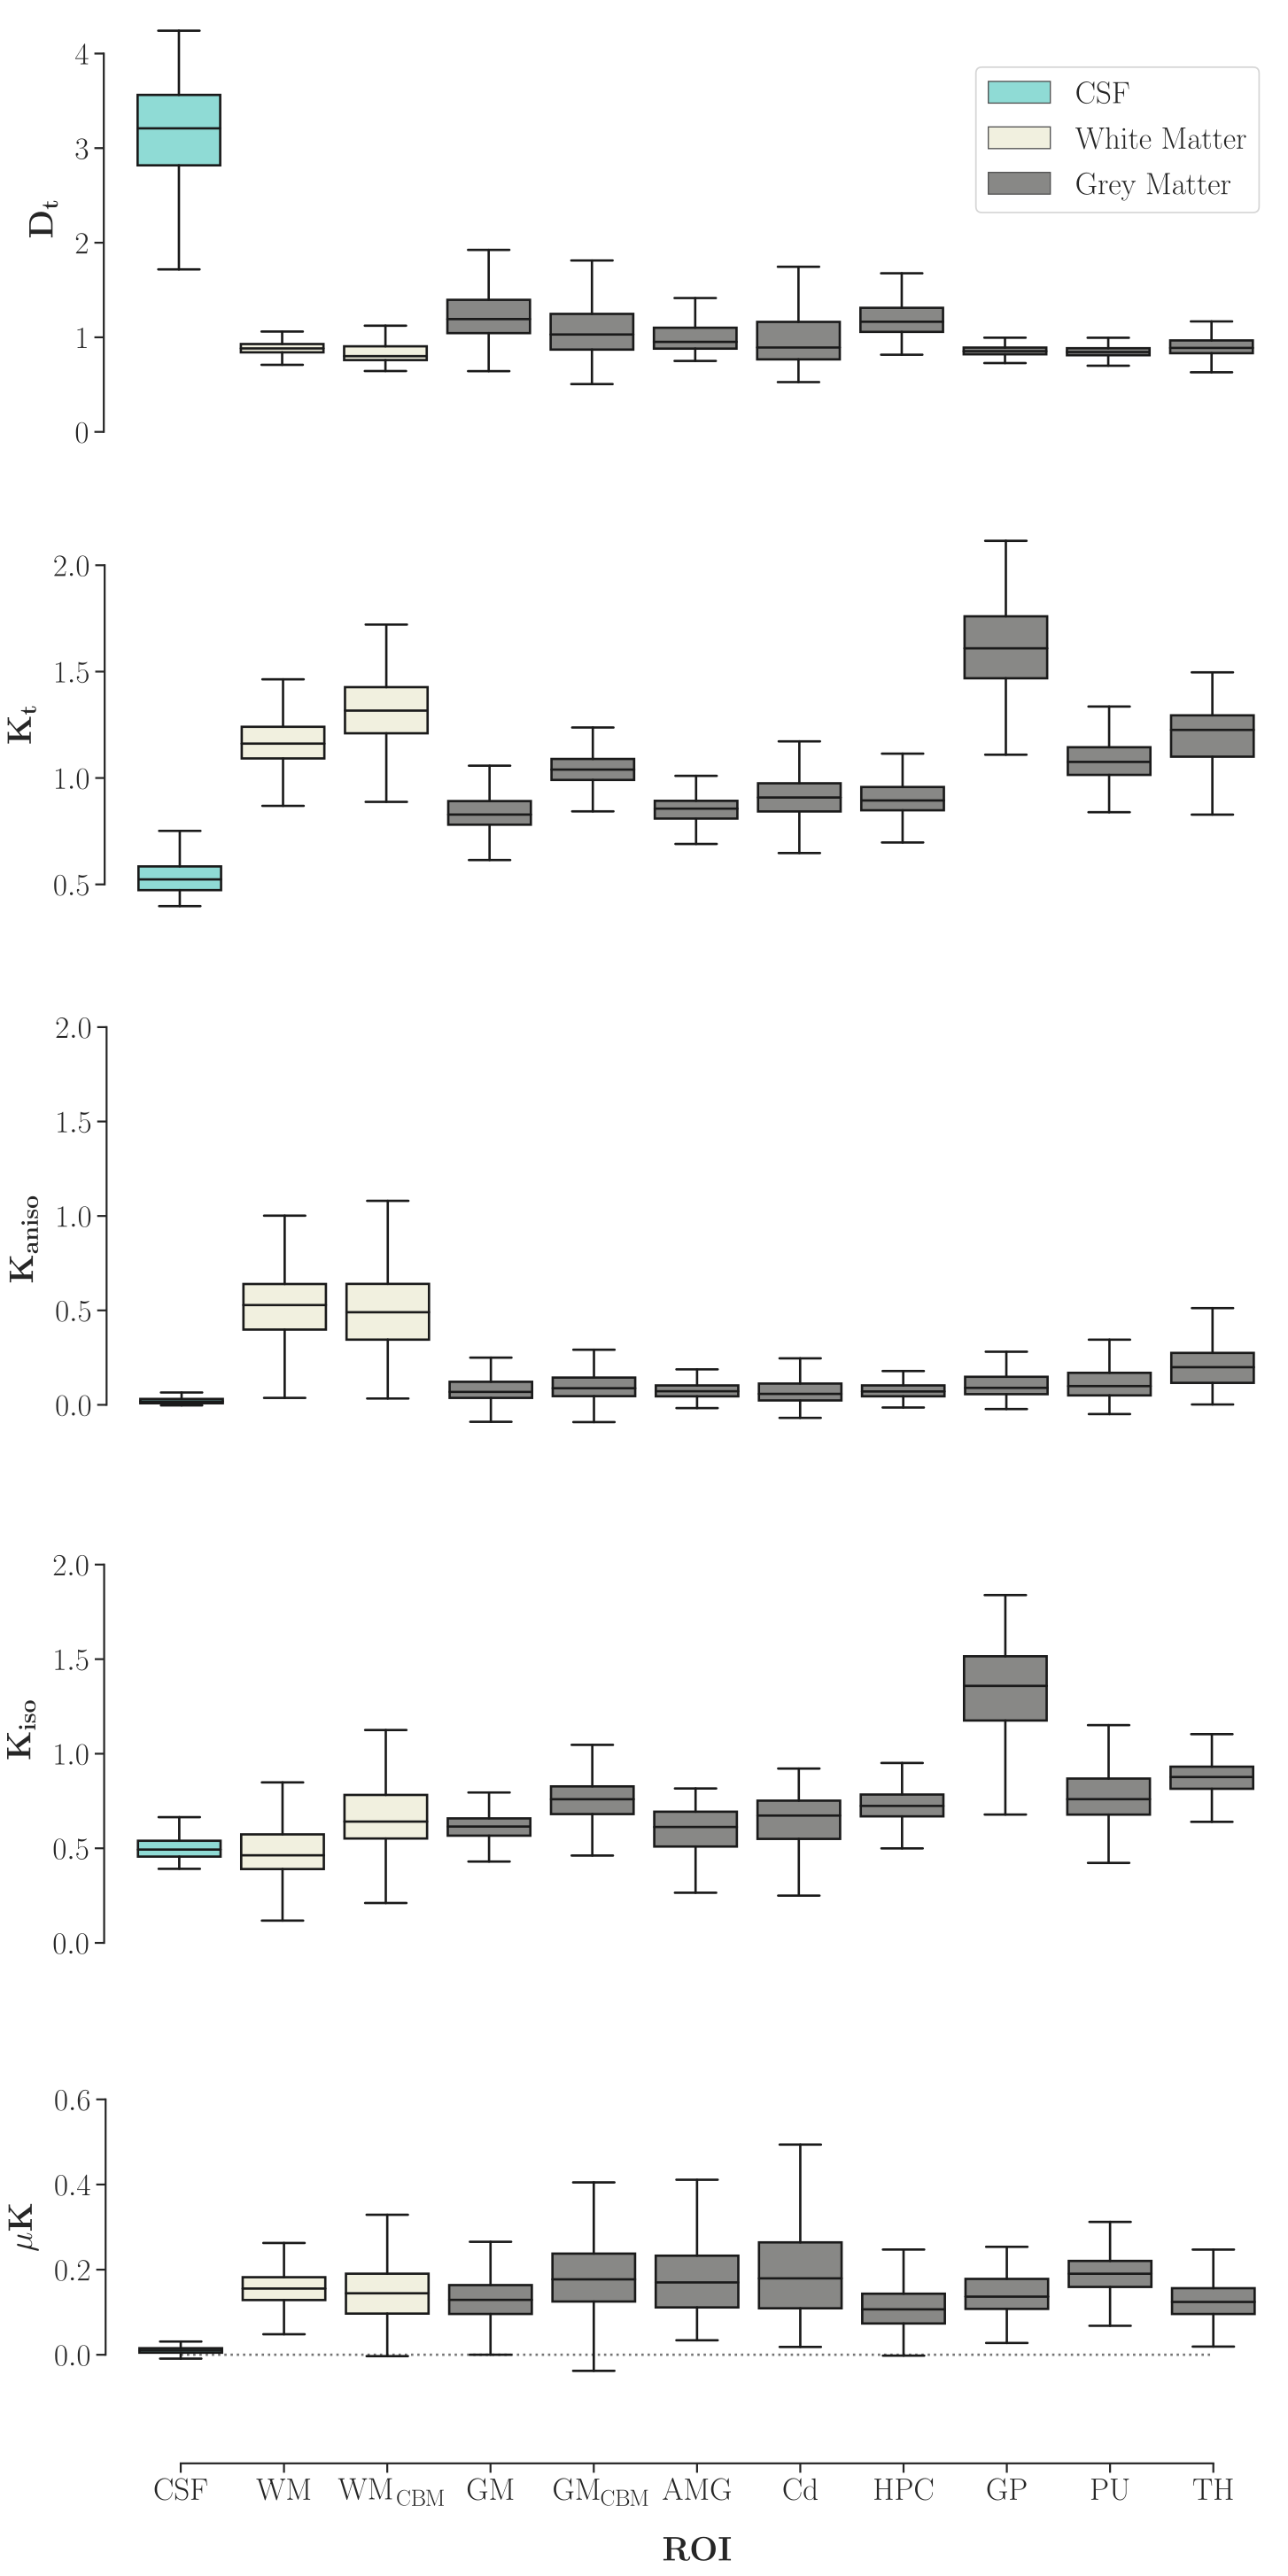
Fig. 2: Boxplots showing distributions of values per each map and Region of Interest (ROI). Abbreviations: Dt: total diffusivity, Kt: total kurtosis, Kaniso: anisotropic kurtosis, Kiso: isotropic kurtosis, μK: microscopic kurtosis, CSF: Cerebrospinal fluid in lateral ventricles, WM: White Matter, WMCBM: Cerebellar White Matter, GM: Grey Matter, GMCBM: Cerebellar Grey Matter, AMG: Amygdala, Cd: Caudate, HPC: Hippocampus, GP: Globus Pallidus, PU: Putamen, TH: Thalamus.
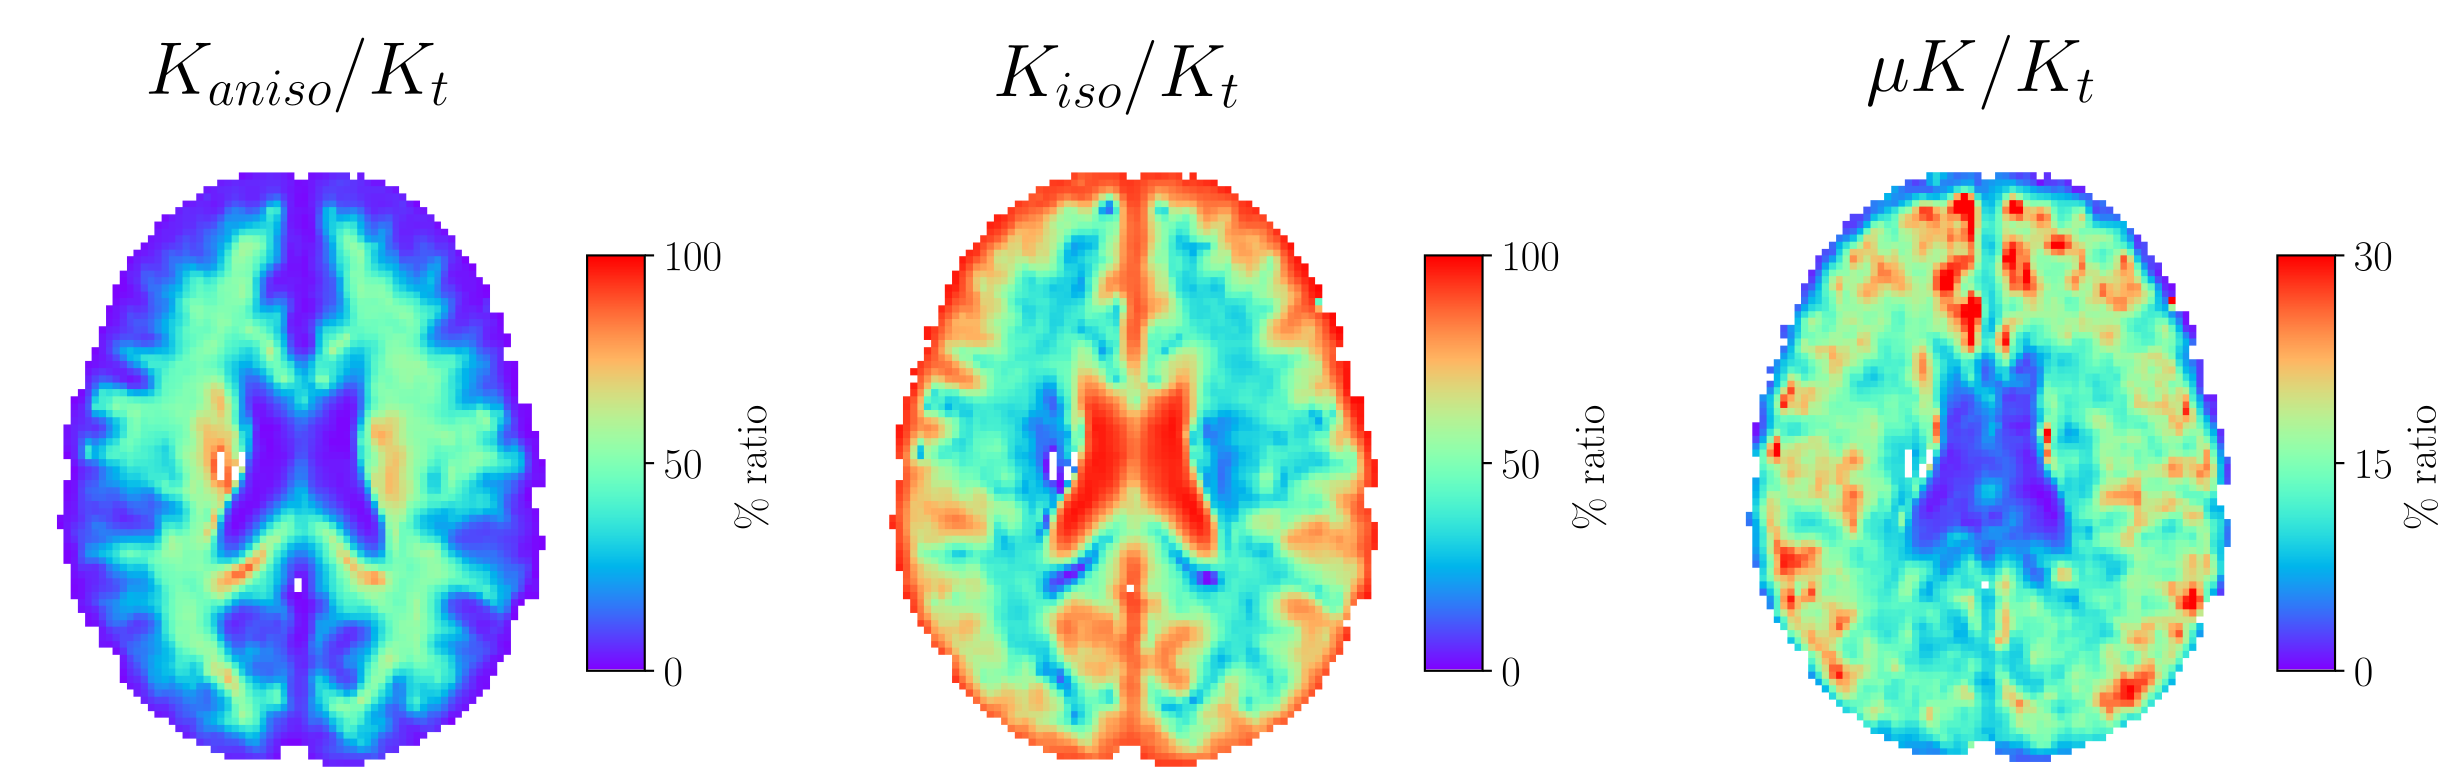
Fig. 3: Maps of the ratio between each kurtosis source and total kurtosis (Kt). Abbreviations: Kaniso: anisotropic kurtosis, Kiso: isotropic kurtosis, μK: microscopic kurtosis. Note the different colorbar ranges.
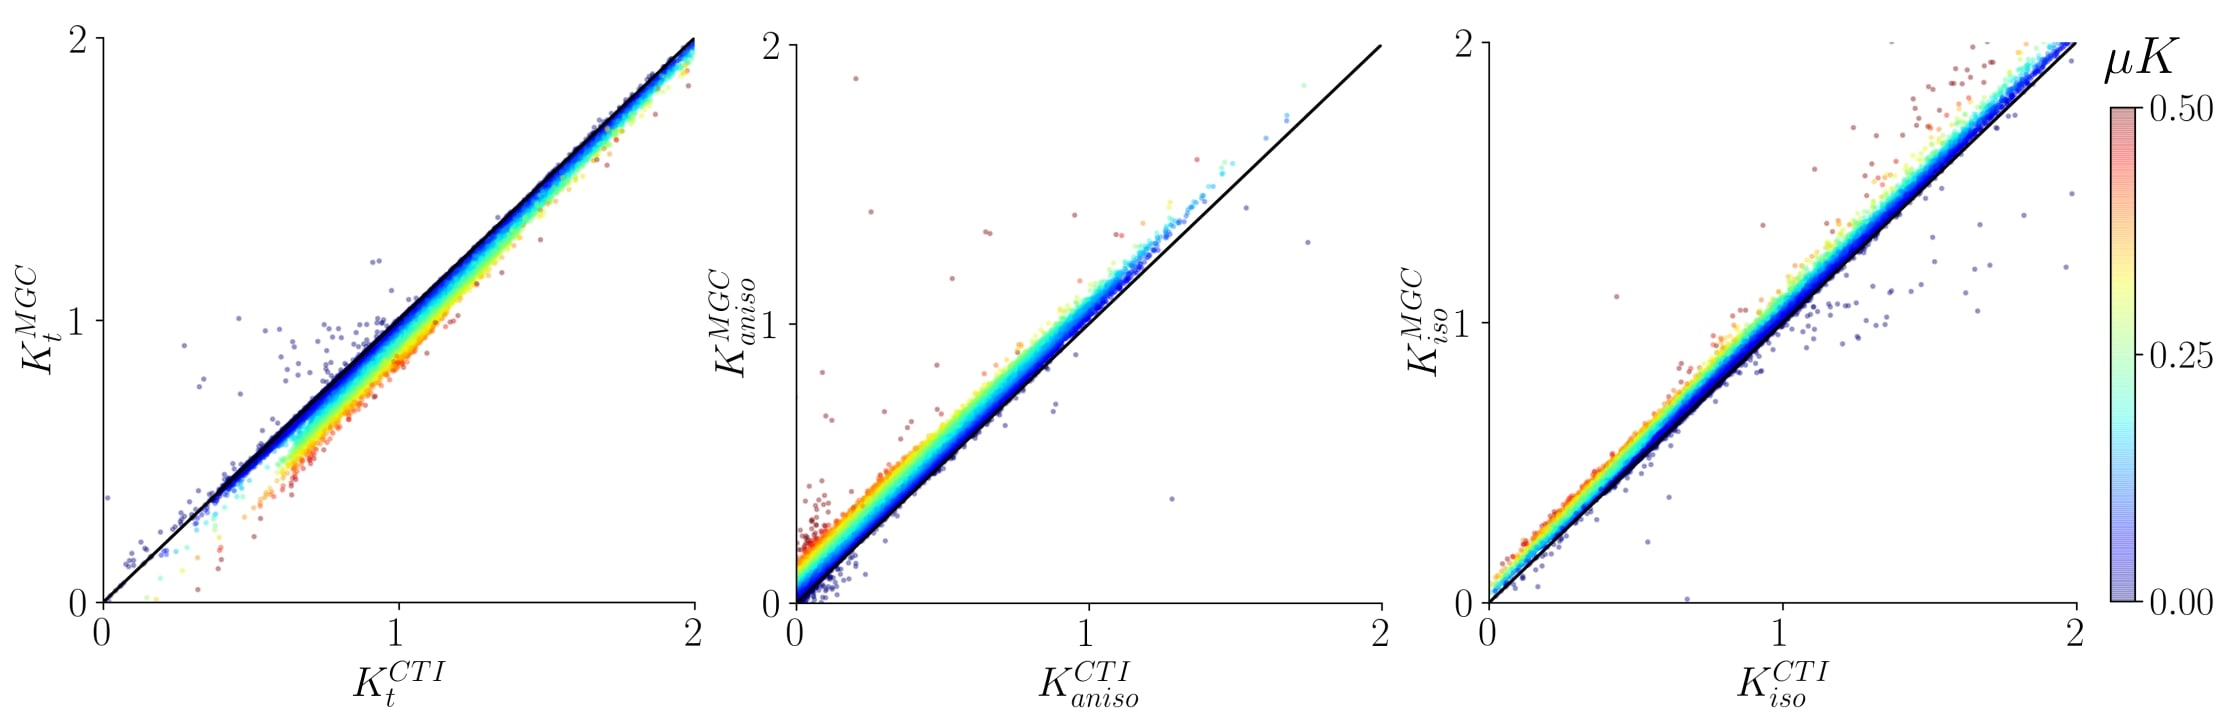
Fig. 4: Scatterplots showing the bias associated with the estimation of total kurtosis (Kt), anisotropic kurtosis (Kaniso), and isotropic kurtosis (Kiso) under the multiple gaussian components (MGC) assumption as compared to CTI-derived estimations. Points are color-coded according to their corresponding microscopic kurtosis (μK) value.