0521
Validation of diffusion MRI-derived white matter microstructure metrics using 3D electron microscopy in injured rat brain1Radiology, New York University School of Medicine, New York, NY, United States, 2University of Eastern Finland, Kuopio, Finland, 3Radiology, Massachusetts General Hospital, Harvard Medical School, Boston, MA, United States
Synopsis
To validate the standard model of diffusion in white matter, we characterized injured rat brain microstructure using 3D EM and ex-vivo MRI. Using histology, we demonstrated that the rotational invariants $$$p_l$$$ of the fiber orientation distribution follow a power-law and that the axon diameter histogram is described well by a generalized extreme value distribution. Comparing 3D EM and dMRI, we found that the SM parameters correlate specifically with their histology counterpart, and revealed the specificity of the intra-axonal diffusivity to axonal beading in traumatic brain injury.
Introduction
Biophysical modeling of the diffusion MRI (dMRI) signal1,2, offers the exciting potential of turning the MRI scanner into a noninvasive in-vivo microscope. In brain white matter (WM), the standard model1 (SM) of impermeable sticks (representing axons) embedded in the extra-axonal compartment is commonly used.However, careful histological validation is required. Previous efforts used light and electron microscopy (EM) 2D/3D histology to quantify volume fractions, axon caliber variation and dispersion5,7,8, and used them as ground truth for evaluating sensitivity and specificity of fiber orientation4,5 and scalar dMRI parameters3-7. Yet, a comprehensive histological validation of the SM so far has been lacking. Here, we characterize injured rat brain microstructure using 3D EM and ex-vivo MRI, and compare SM parameters with their histological counterpart.
Methods
Animal preparation: Traumatic Brain Injury (TBI) was induced by a lateral fluid-percussion injury in three adult rats, while two rats went through a sham-operation that included all the surgical procedures except the impact. Imaging occurred five months after TBI/sham operations6,7.3D-EM-Imaging: Ten WM samples, two of each rat, extracted from the ipsi- and contralateral hemispheres of the brain, were prepared for serial block-face-scanning electron microscopy imaging6,7. Large tissue volumes of 200x100x65 $$$\mu$$$m3 were imaged with a voxel size of 50×50×50 nm3. Two-thirds of the acquired samples correspond to the corpus callosum (CC) and one-third to the cingulum (CG).
dMRI-Imaging: Ex-vivo dMRI data with voxel resolution of 150x150x150 $$$\mu$$$m3 was acquired on a 9.4T magnet at room temperature 21oC by applying 42 diffusion gradient directions for b = 2, 3, and 4 ms/$$$\mu$$$m2, respectively; with $$$\delta/\Delta$$$=6/11.5 ms, in addition to 3 non-diffusion weighted images. TR/TE=1000/35 ms.
dMRI-processing: Images were denoised9, corrected for Gibbs-ringing10, B1 inhomogeneities11 and motion distortions12. SM parameters (Figure 4b) were estimated with a machine learning approach based on a cubic polynomial regression14 to map the rotational invariants13,14 of the dMRI signal to the kernel parameters. Independent uniform priors were used for computing the regression of all parameters:$$$f\sim\mathcal{U}(0,1),\,D_a\sim\mathcal{U}(0,2),\,D_e^{||}\sim\mathcal{U}(0,2),\,D_e^{\perp}\sim\mathcal{U}(0,1),\,p_2\sim\mathcal{U}(0,1)$$$ (maximum diffusivities were those of water at 21oC).
3D-EM analysis: Myelin and myelinated axons were automatically segmented using the deep-learning-based pipeline DeepACSON15,16,24. Using these segmentations, the intra- and extra-axonal volume fractions (iavf and eavf), and axon water fraction $$$f$$$=iafv/(iavf/eavf) were computed. Following the approach of8, from the segmented axons, the axon diameters, coefficient of variations of radii ($$$CV(r)$$$), and fiber orientation distributions (FOD) with its rotational invariants were computed. The Gamma and Generalized extreme value distribution (GEV) were fit8,17 to the axon diameter distributions consisting of around 20,000 axons in the CC and 10,000 in the CG per sample. Also, the power-law functional form8,14 for the rotational invariants of the FOD $$$p_l=C\lambda^{l}$$$ was tested.
3D-EM/SM parameter comparison: Manually segmented ROIs in the SM maps were drawn on the locations from which the EM samples were collected and Pearson correlations were performed between each diffusion/3D-EM metric pairs, with $$$p_{value}<0.05$$$ considered being statistically significant.
Results and Discussion
The brain slice, from which the 3D-EM samples were collected, of a rat with TBI and its corresponding slice on the FA map is shown at Figure 1, indicating the regions analyzed: CC and CG on the two ipsi- and contralateral hemispheres. Figure 1 also shows an image of the 3D EM and the segmented myelinated axons.Figure 2 shows plots for diameter distributions, $$$f$$$, eavf, and $$$CV(r)$$$, showing changes due to TBI are mainly in the CG, including a decrease in the axon diameter and $$$f$$$ and increase in $$$CV(r)$$$, indicating the presence of axonal beading. We observed that the GEV better describes the axon diameter histograms8,17.
Figure 3 shows plots for dispersion-related metrics: $$$p_2$$$, $$$C$$$ and $$$\lambda$$$, which also are shown to change due to TBI, indicating an increase in dispersion in the ipsilateral CC and CG. We also observe that the rotational invariants $$$p_l$$$ follow the power law8,14 with $$$C$$$ being more sensitive to the changes.
In Figure 4a, Sham and TBI example dMRI-derived SM parametric maps are shown for $$$f$$$ and $$$p_2$$$, visibly showing changes that corroborate the histological analysis (Figures 2,3).
The table in Figure 5 shows correlation between the histology metrics and the SM parameters, featuring that the SM parameters correlate significantly with their histology counterparts, $$$f$$$ (dMRI) vs $$$f$$$ (Histology) and $$$p_2$$$ (dMRI) vs $$$p_2$$$ (Histology). The inverse correlation between $$$D_a$$$ and $$$CV(r)$$$ has been shown previously using Monte Carlo (MC) simulations18,19. For the case of $$$D_e^{||}$$$ and $$$D_e^{\perp}$$$, they are expected to correlate with changes in the eavf, however their exact behavior in control and pathology remains an ongoing topic of investigation.
Conclusions
In this work, we used 3D EM to quantify dMRI-relevant metrics on injured rat brains. The large number of axons analyzed allowed for validating the power-law functional form of the rotational invariants $$$p_l$$$ of the FOD, in agreement with ref.8. We also corroborate that the GEV distribution describes the axon diameter distribution well, in agreement with refs.8,17. Finally, we use these histological quantifications to validate the specificity of the SM parameters, showing they correlate specifically with their histology counterparts. In addition, $$$D_a$$$ only correlates with $$$CV(r)$$$, indicating the specificity of this SM parameter to axonal beading. Further work will focus on validating other commonly used approaches for SM-estimation20-23.Acknowledgements
Research was supported by the National Institute of Neurological Disorders and Stroke of the NIH under awards R01 NS088040 and R21 NS081230, and by the Hirschl foundation, and was performed at the Center of Advanced Imaging Innovation and Research (CAI2R, www.cai2r.net), a Biomedical Technology Resource Center supported by NIBIB with the award P41 EB017183. A.S. was funded by the Academy of Finland (grant #323385) and the Erkko Foundation. H.H.L. was funded by the Office of the Director of the NIH under award DP5 OD031854.References
1. Dmitry S Novikov, Els Fieremans, Sune N Jespersen, Valerij G Kiselev. Quantifying brain microstructure with diffusion MRI: Theory and parameter estimation. NMR Biomed. 2019;32(4):e3998.
2. Daniel C Alexander, Tim B Dyrby, Markus Nilsson, Hui Zhang. Imaging brain microstructure with diffusion MRI: practicality and applications. NMR Biomed. 2019;32(4):e3841.
3. Ileana O Jelescu, Magdalena Zurek, Kerryanne V Winters, Jelle Veraart, Anjali Rajaratnam, Nathanael S Kim, James S Babb, Timothy M Shepherd, Dmitry S Novikov, Sungheon G Kim, Els Fieremans. In vivo quantification of demyelination and recovery using compartment-specific diffusion MRI metrics validated by electron microscopy. Neuroimage 2016;132:104-114.
4. Schilling K, Janve V, Gao Y, Stepniewska I, Landman BA, Anderson AW. Comparison of 3D orientation distribution functions measured with confocal microscopy and diffusion. MRI Neuroimage 2016;129:185–197.
5. Schilling KG, Janve V, Gao Y, Stepniewska I, Landman BA, Anderson AW. Histological validation of diffusion MRI fiber orientation distributions. and dispersion. Neuroimage 2018;165:200–221.
6. Raimo A. Salo, Ilya Belevich, Eppu Manninen, Eija Jokitalo, Olli Gröhn, Alejandra Sierra. Quantification of anisotropy and orientation in 3D electron microscopy and diffusion tensor imaging in injured rat brain. NeuroImage 2018.172: 404-414
7. Raimo A. Salo, Ilya Belevich, Eija Jokitalo, Olli Gröhn, Alejandra Sierra. Assessment of the structural complexity of diffusion MRI voxels using 3D electron microscopy in the rat brain. 2021. NeuroImage 225.
8. Hong-Hsi Lee, Katarina Yaros, Jelle Veraart, Jasmine L Pathan, Feng-Xia Liang, Sungheon G Kim, Dmitry S Novikov, Els Fieremans. Along-axon diameter variation and axonal orientation dispersion revealed with 3D electron microscopy: implications for quantifying brain white matter microstructure with histology and diffusion MRI. Brain Struct Funct. 2019;224(4):1469-1488.
9. Jelle Veraart, Dmitry S Novikov, Daan Christiaens, Benjamin Ades-Aron, Jan Sijbers, Els Fieremans. Denoising of diffusion MRI using random matrix theory. Neuroimage. 2016;142:394-406.
10. Elias Kellner, Bibek Dhital, Valerij G Kiselev, Marco Reisert. Gibbs-ringing artifact removal based on local subvoxel-shifts. Magn Reson Med. 2016;76(5):1574-1581.
11. Nicholas J Tustison, Brian B Avants, Philip A Cook, Yuanjie Zheng, Alexander Egan, Paul A Yushkevich, James C Gee. N4ITK: improved N3 bias correction. IEEE Trans Med Imaging. 2010;29(6):1310-20.
12. B B Avants, C L Epstein, M Grossman, J C Gee. Symmetric diffeomorphic image registration with cross-correlation: evaluating automated labeling of elderly and neurodegenerative brain. Med Image Anal. 2008;12(1):26-41.
13. Dmitry S Novikov, Jelle Veraart, Ileana O Jelescu, Els Fieremans. Rotationally-invariant mapping of scalar and orientational metrics of neuronal microstructure with diffusion MRI. Neuroimage. 2018;174:518-538.
14. Marco Reisert, Elias Kellner, Bibek Dhital, Jürgen Hennig, Valerij G Kiselev. Disentangling micro from mesostructure by diffusion MRI: A Bayesian approach. Neuroimage. 2017;147:964-975.
15. Ali Abdollahzadeh, Ilya Belevich, Eija Jokitalo, Jussi Tohka, Alejandra Sierra. Automated 3D Axonal Morphometry of White Matter. Sci Rep. 2019 Apr 15;9(1):6084.
16. Ali Abdollahzadeh, Ilya Belevich, Eija Jokitalo, Alejandra Sierra, Jussi Tohka. DeepACSON automated segmentation of white matter in 3D electron microscopy. Commun Biol. 2021 Feb 10;4(1):179.
17. Sepehrband F, Alexander DC, Clark KA, Kurniawan ND, Yang Z, Reutens DC. Parametric probability distribution functions for axon diameters of corpus callosum. Front Neuroanat. 2016;10:59.
18. Hong-Hsi Lee, Antonios Papaioannou, Sung-Lyoung Kim, Dmitry S Novikov, Els Fieremans. A time-dependent diffusion MRI signature of axon caliber variations and beading. Commun Biol. 2020;3(1):354.
19. Matthew D Budde, Joseph A Frank. Neurite beading is suficient to decrease the apparent diffusion coeficient after ischemic stroke. Proc Natl Acad Sci. 2010;107(32):14472-7
20. Fieremans, Els, Jens H. Jensen, and Joseph A. Helpern. White matter characterization with diffusional kurtosis imaging. Neuroimage 58.1 (2011): 177-188.
21. Jespersen, Sune Nørhøj, et al. Diffusion time dependence of microstructural parameters in xed spinal cord. Neuroimage 182 (2018): 329-342.
22. Zhang, Hui, et al. NODDI: practical in vivo neurite orientation dispersion and density imaging of the human brain. Neuroimage 61.4 (2012): 1000-1016.
23. Kaden, Enrico, et al. Multi-compartment microscopic diffusion imaging. NeuroImage 139 (2016): 346-359.
24. Abdollahzadeh, A., Belevich, I., Jokitalo, E., Tohka, J. & Sierra, A. Segmentation of white matter ultrastructures in 3D electron microscopy (2020).
25. Tim B Dyrby, Giorgio M Innocenti, Martin Bech, Henrik Lundell. Validation strategies for the interpretation of microstructure imaging using diffusion MRI. Neuroimage. 2018;182:62-79.
Figures
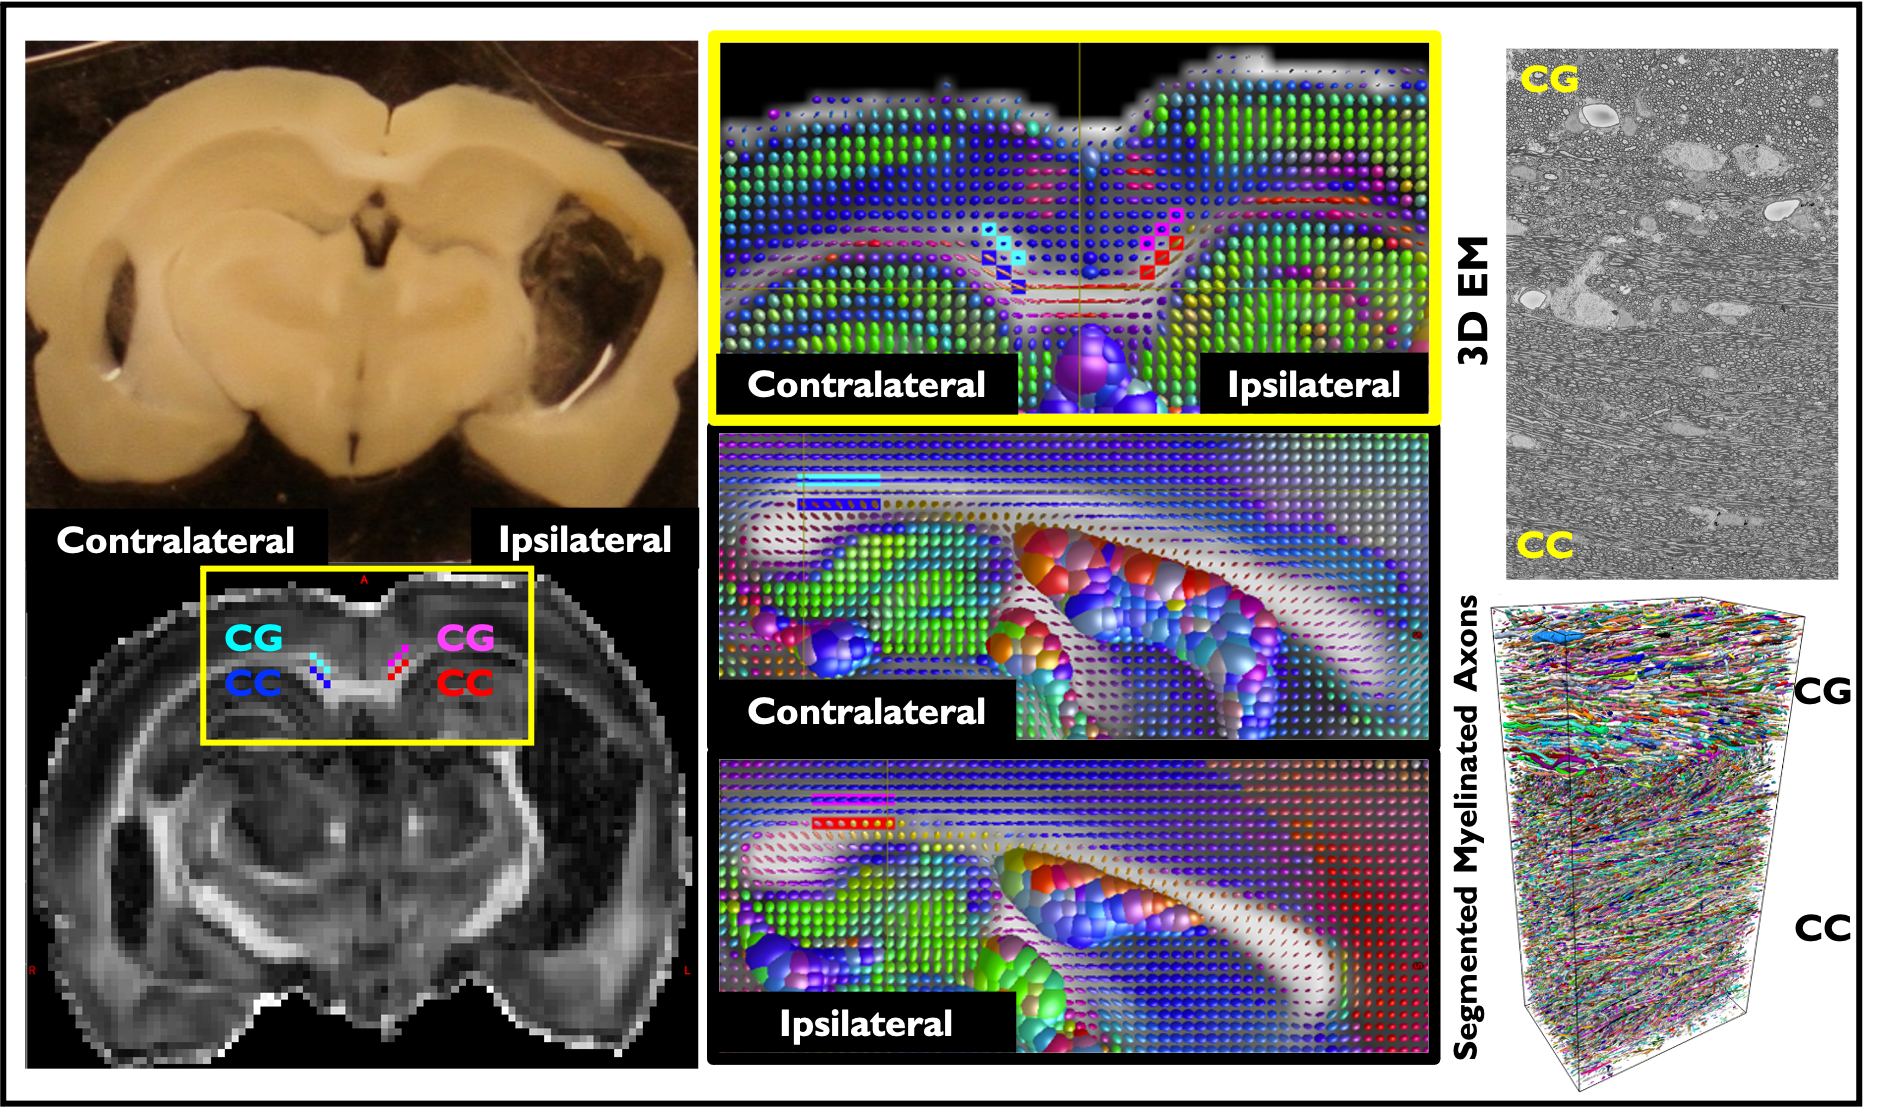
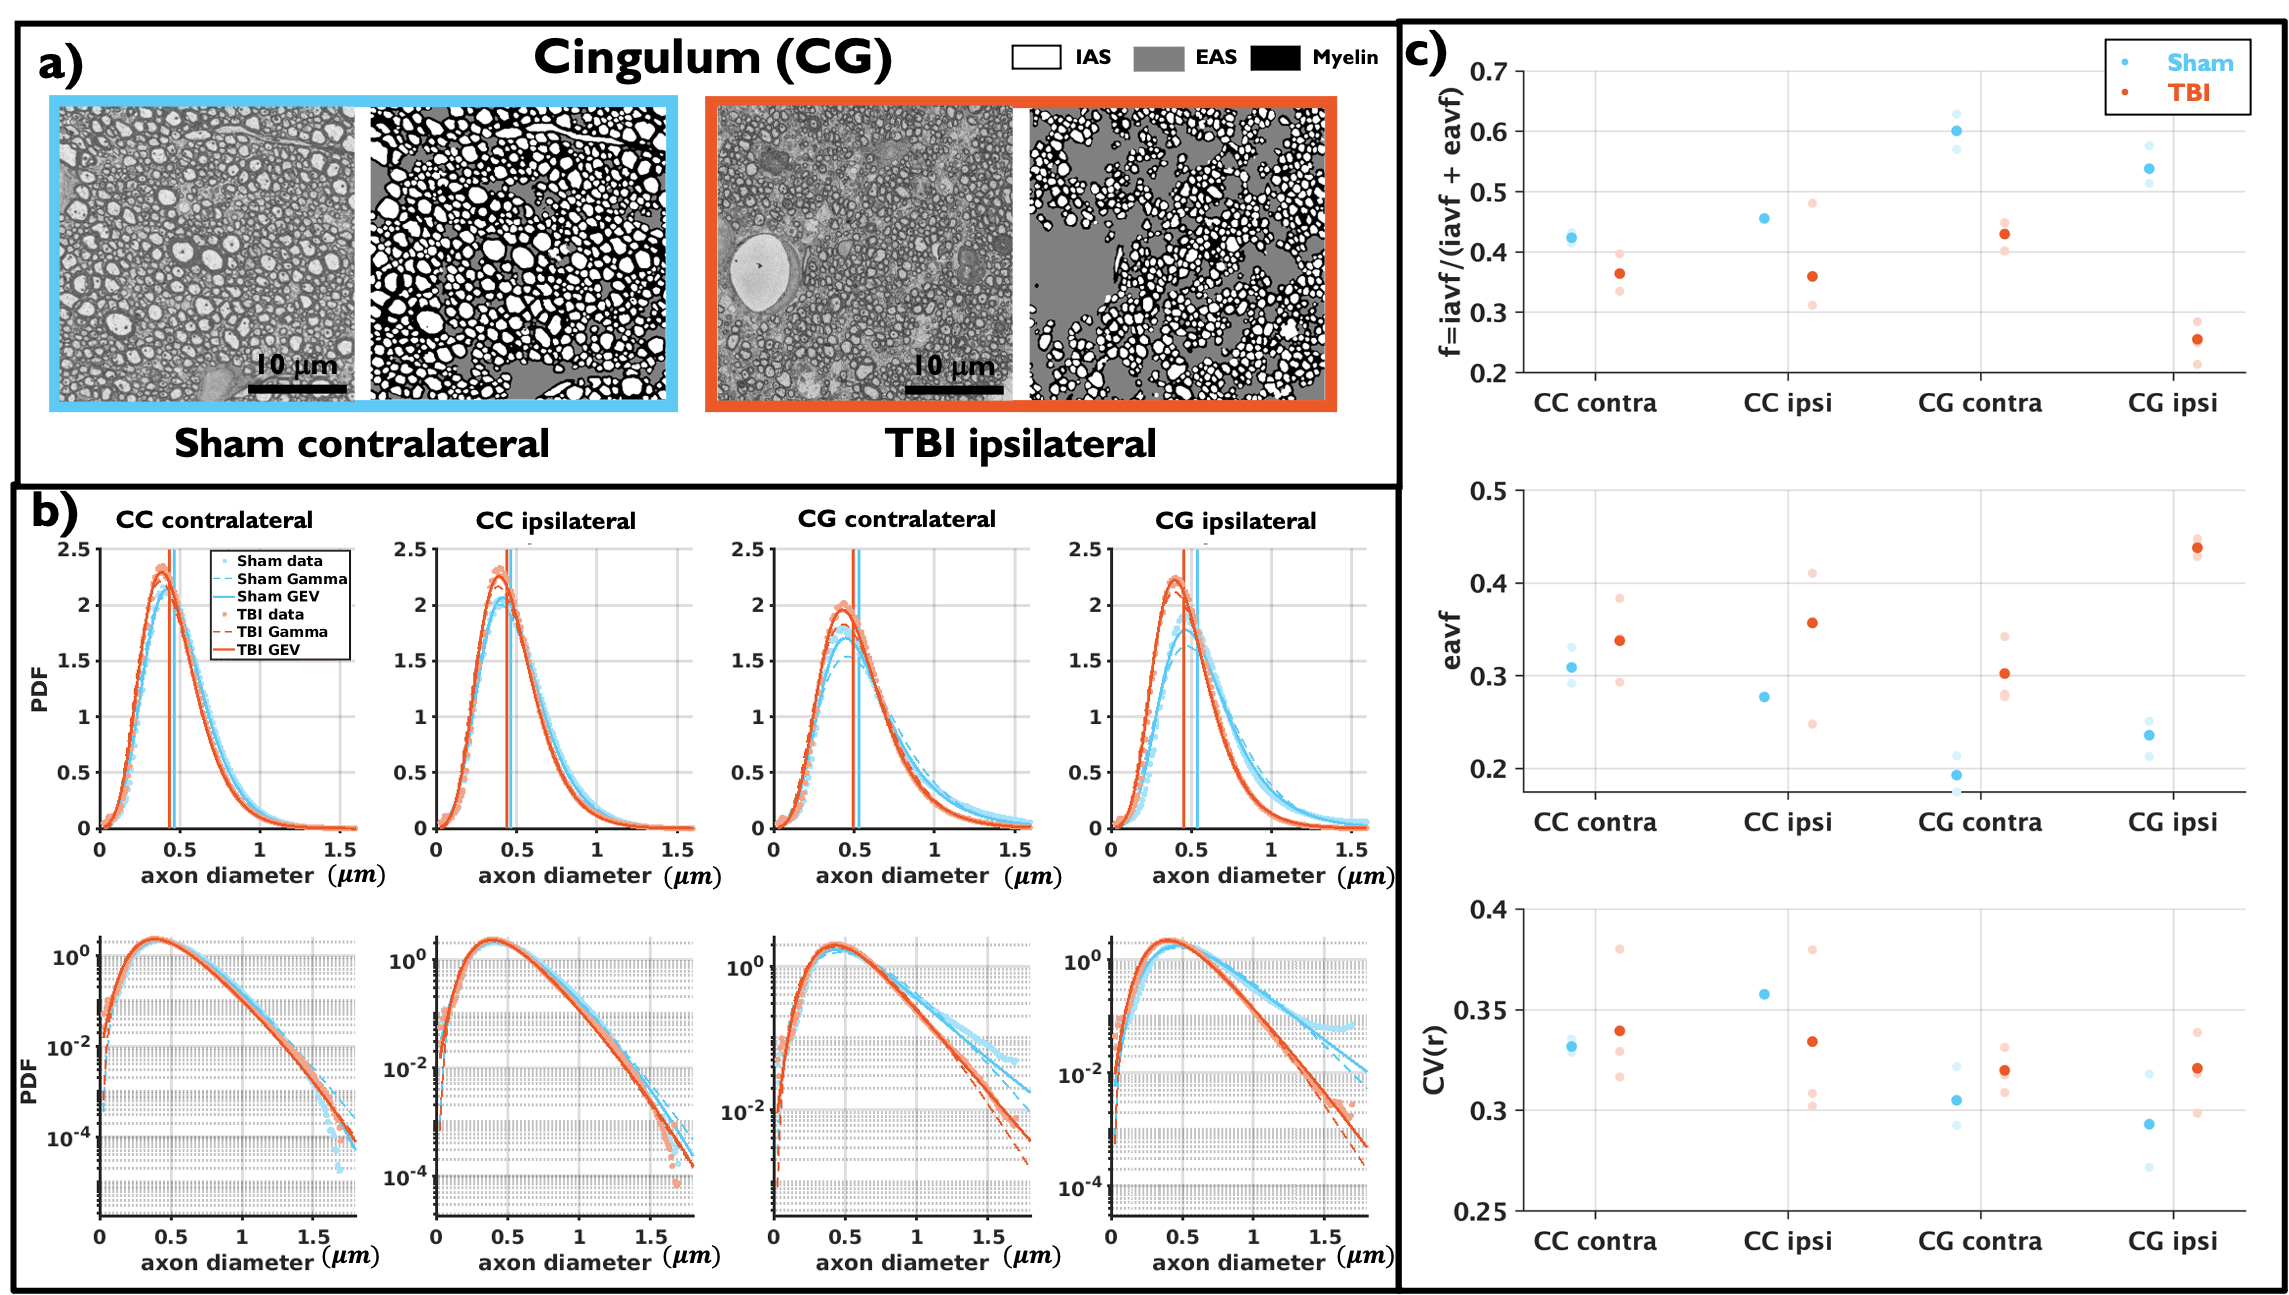
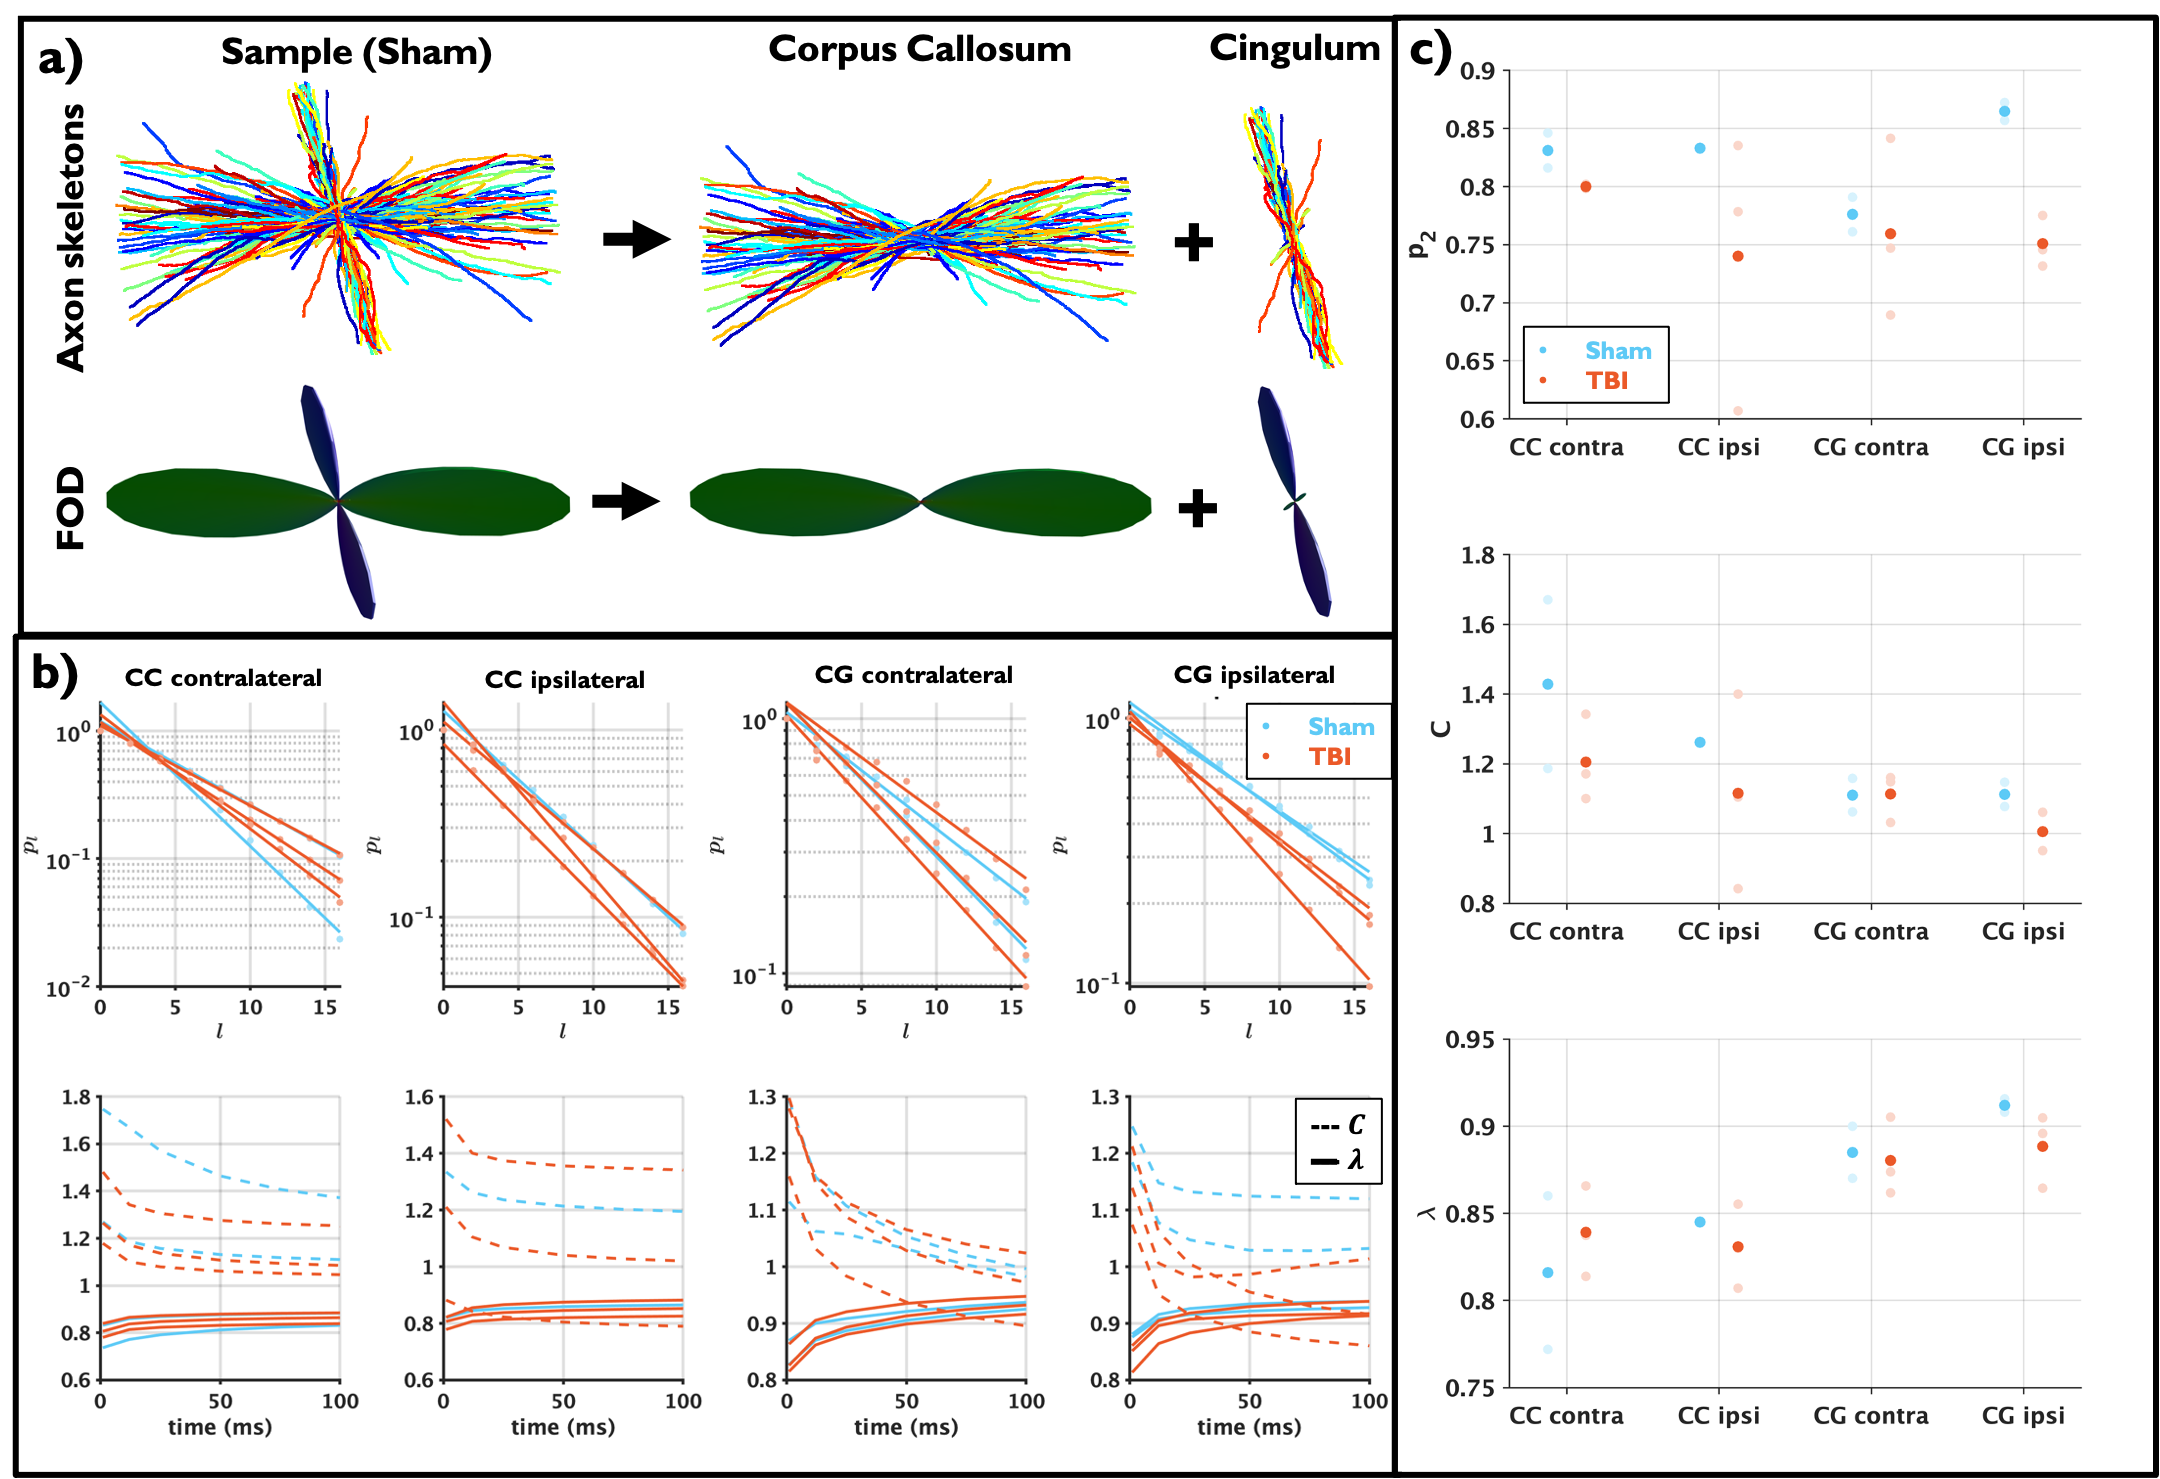
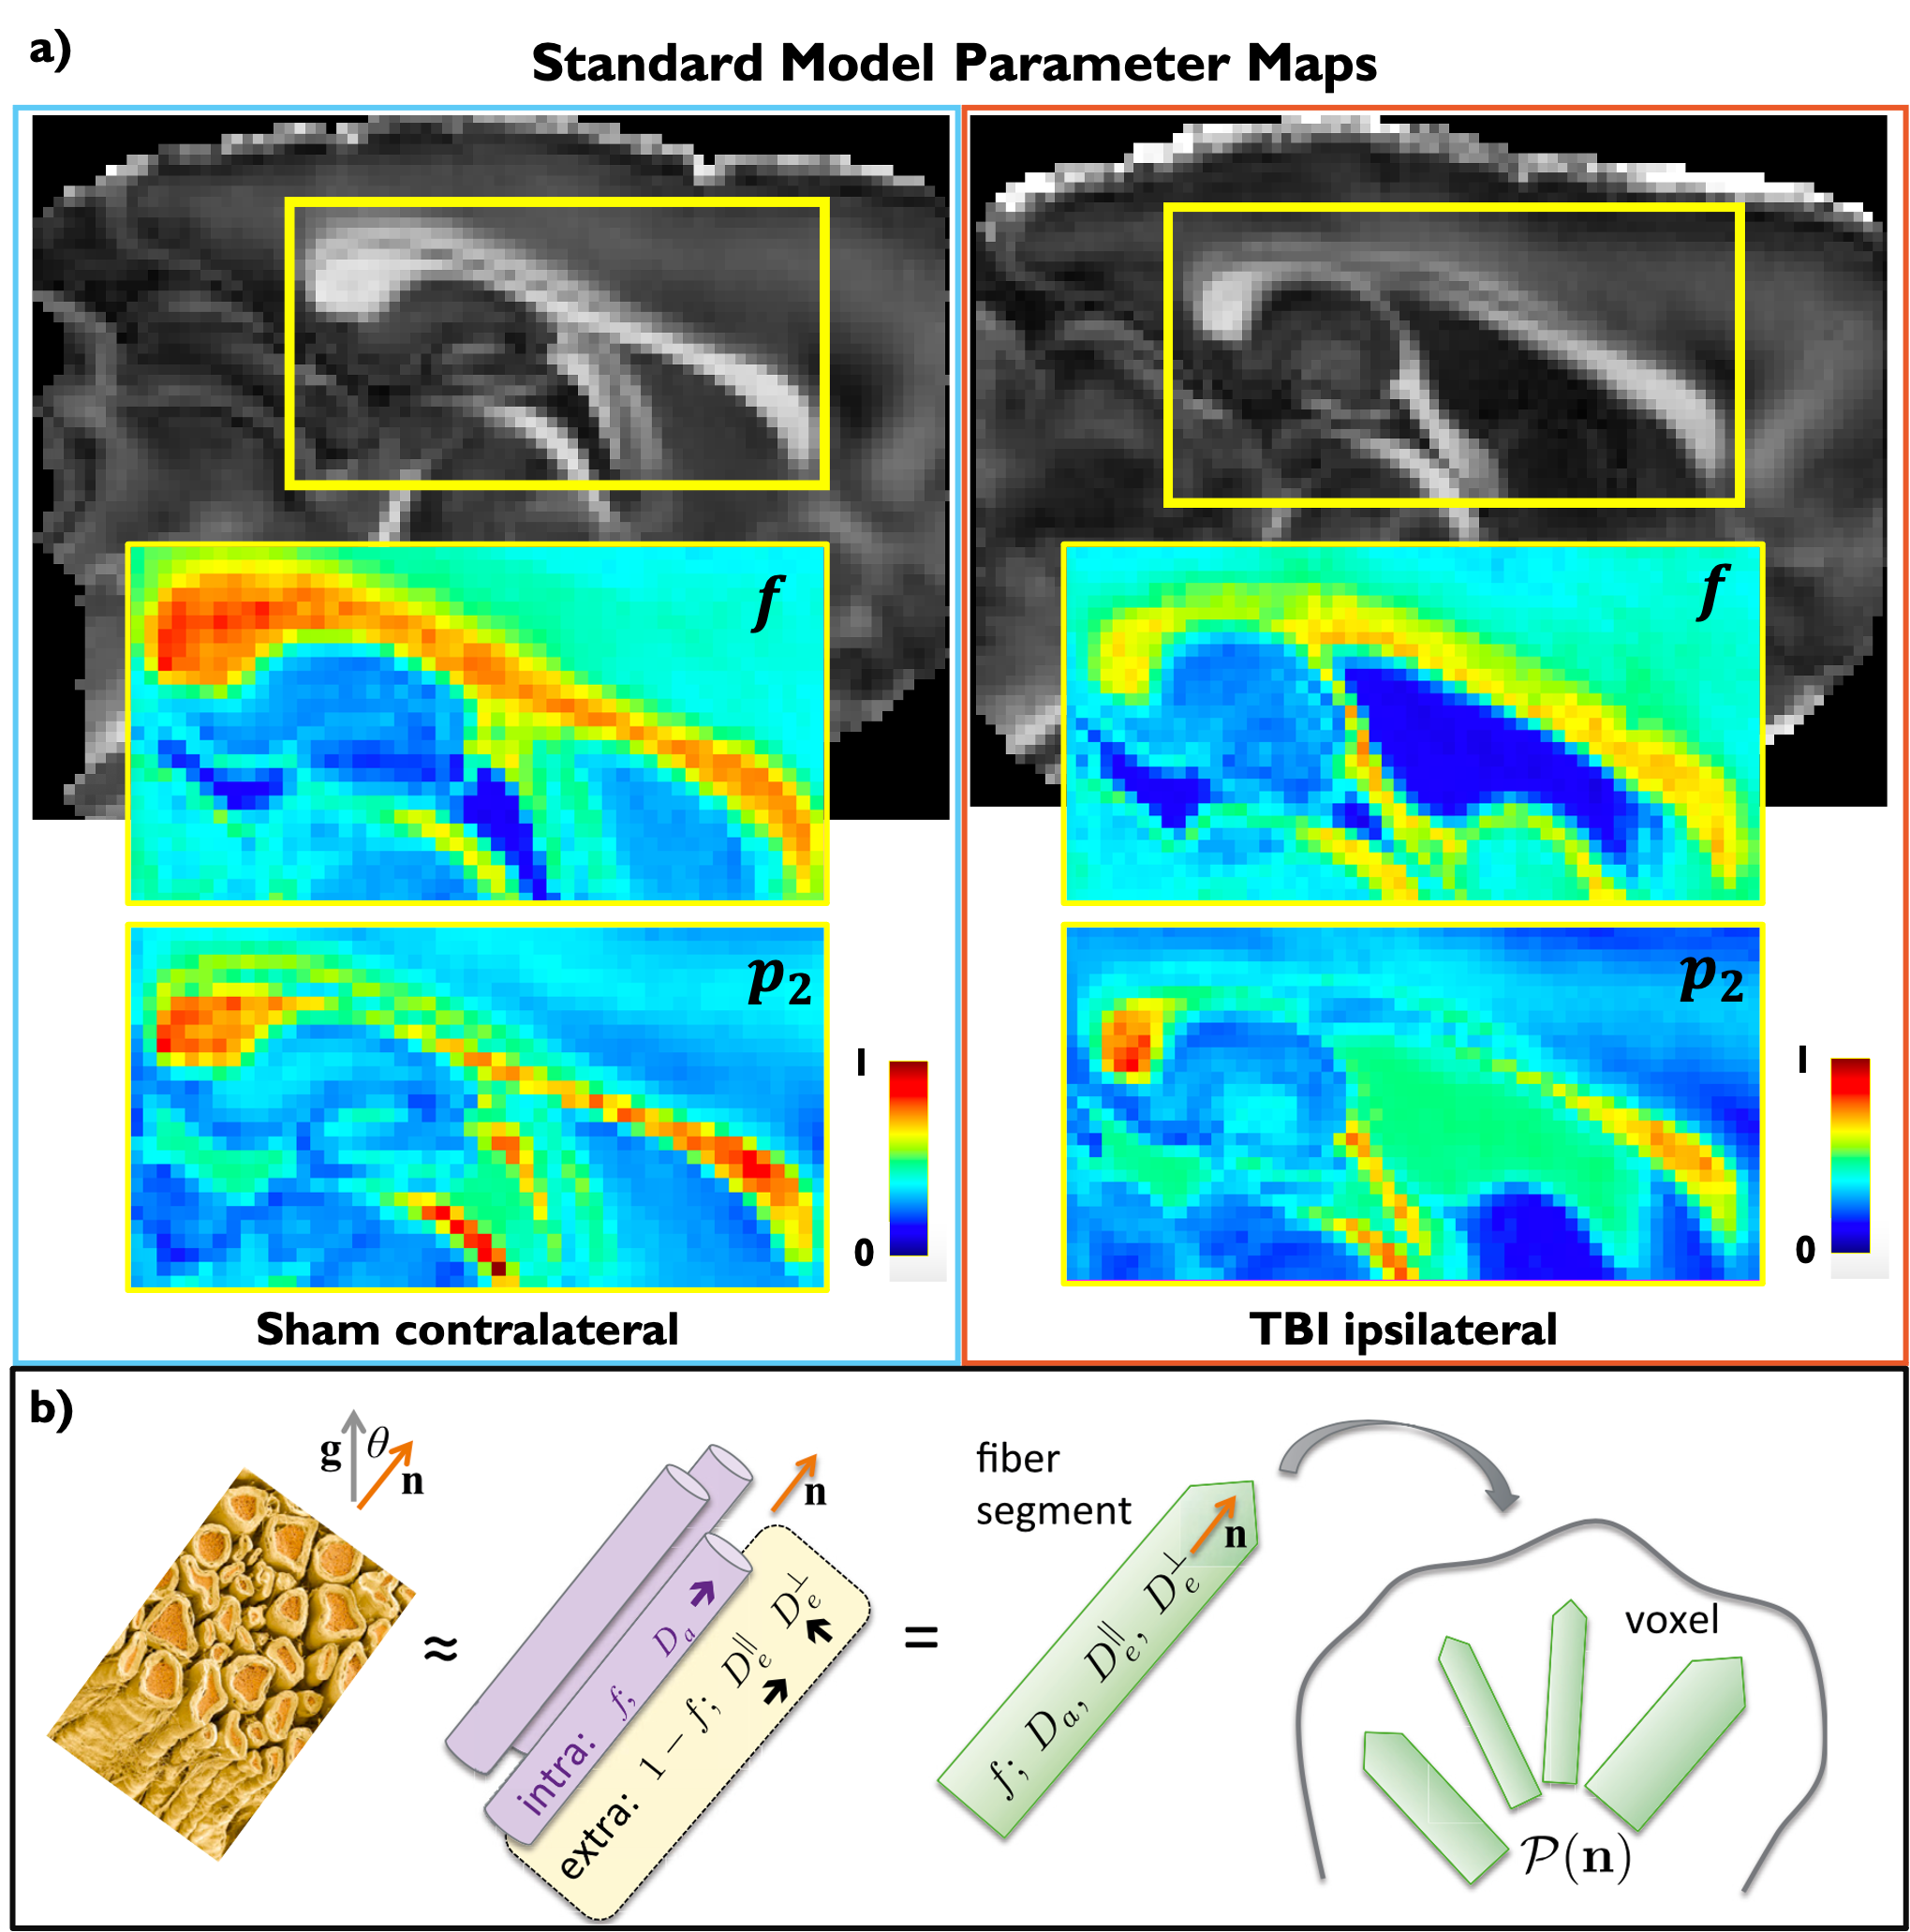
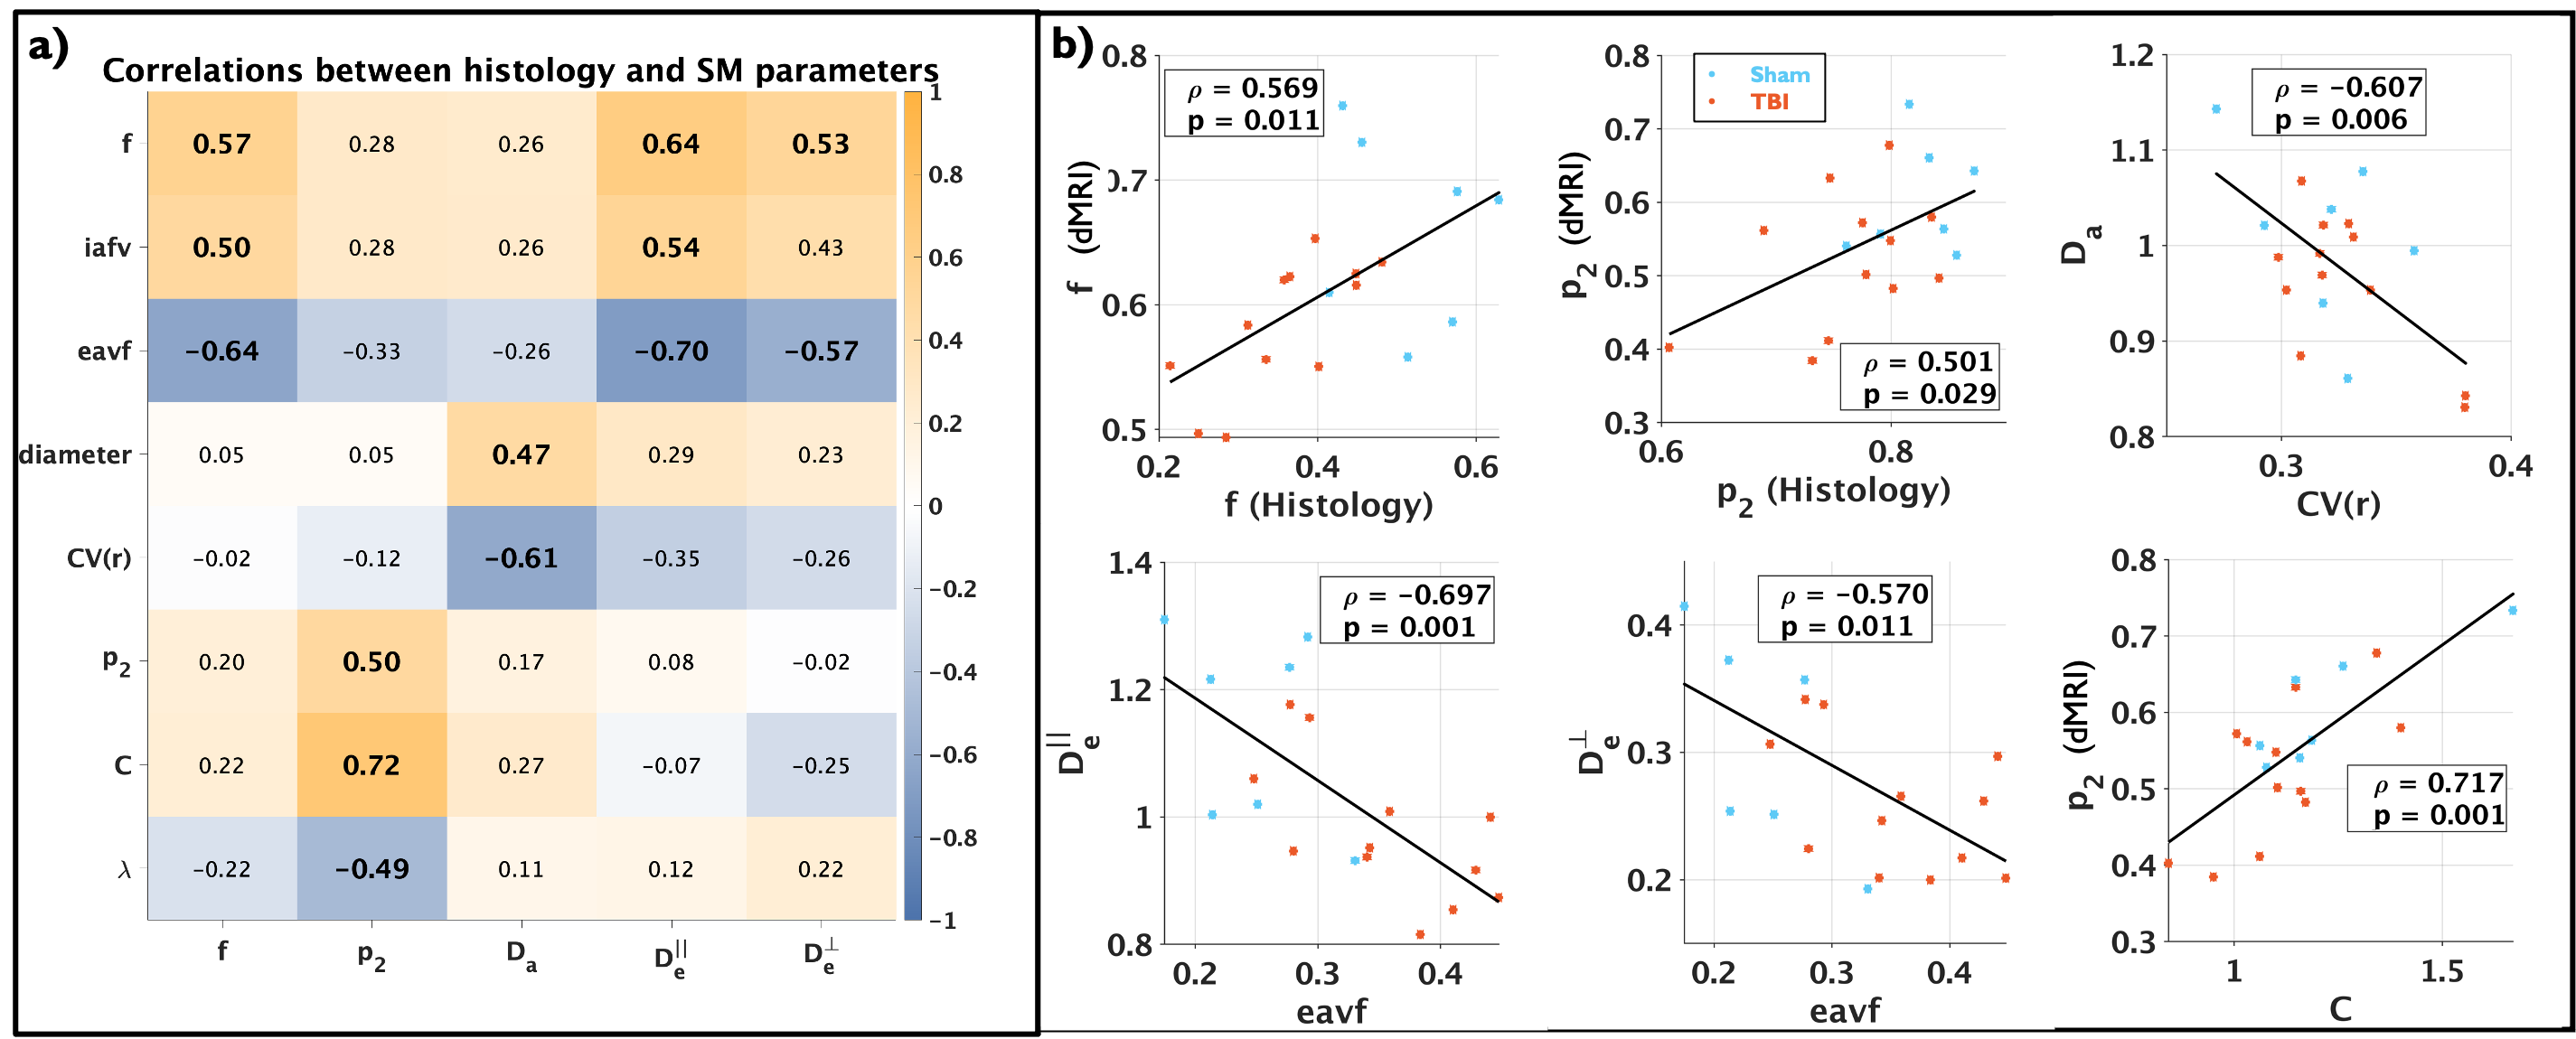
Figure 5. a) Pearson correlations between histology derived metrics and estimated SM parameters, bold values indicate $$$p<0.05$$$. Specificity of the SM parameters can be observed as $$$f$$$ (SM) correlates with histology volume fractions: iavf, eavf and $$$f$$$ (Histology), $$$p_2$$$ (SM) correlates with histology dispersion metrics: $$$p_2$$$ (Histology), $$$C$$$ and $$$\lambda$$$, and $$$D_a$$$ correlate with axon size metrics: axon diameter and $$$CV(r)$$$. b) Plots of histology metrics against SM parameters with significant correlation.