0519
Tractography protocols for the neonatal brain, standardised against the adult human and macaque1Sir Peter Mansfield Imaging Centre, School of Medicine, University of Nottingham, Nottingham, United Kingdom, 2University of Paris, Inserm, NeuroDiderot Unit; University Paris-Saclay, CEA, NeuroSpin center, Paris, France, 3Department of Paediatrics, University of Oxford, Oxford, United Kingdom, 4Wellcome Centre for Integrative Neuroimaging, FMRIB Centre, Nuffield Department of Clinical Neurosciences, University of Oxford, Oxford, United Kingdom, 5Donders Institute for Brain, Cognition and Behaviour, Radboud University, Nijmegen, Nijmegen, Netherlands, 6National Institute for Health Research (NIHR) Nottingham Biomedical Research Centre, Nottingham, United Kingdom
Synopsis
The neonatal brain undergoes rapid development in the months after birth. Diffusion tractography is a unique method for probing developing white matter connections. We present a novel and comprehensive library of tractography protocols for the neonatal brain, whilst ensuring correspondence with previously developed protocols for the adult and macaque brain. We demonstrate protocol robustness across data quality and show that the resultant tracts capture a-priori known trends in white matter microstructure. We show that these protocols open avenues for quantitative comparisons across the lifespan, but also species, which we exemplify by revealing developmental trends in connectivity patterns.
Introduction
The neonatal brain undergoes rapid growth and maturation in the initial months of life1–3 and its developmental trajectory has functional implications, for instance for the occurrence of neurodevelopmental disorders4. Diffusion tractography is a unique tool for mapping white matter (WM) tracts in-vivo and may be used to explore the micro- and macro-structural development of tracts. Here, we develop a novel library of 42 tractography protocols for the neonatal brain, defined analogously to those previously developed for the adult human and macaque brain5. We demonstrate protocol robustness against data quality and show that they capture a-priori known developmental trends of WM microstructure. Furthermore, we quantitatively compare neonatal, adult and macaque connectivity patterns and reveal unique potential for mapping connectivity differences and similarities across the lifespan and primate species.Methods
Protocols were developed for 42 (19 bilateral and 4 commissural) WM tracts, in correspondence with the ones developed for the adult and macaque brain, in XTRACT5. The protocols used standard-space seed, waypoint, exclusion and termination masks and were defined analogously across diverse brains, although different in geometry and exact location. The MNI-space adult protocols were used as starting points. A non-linear warp field was used to roughly align the adult protocol masks to a 40 week post-menstrual age (PMA) neonatal template6, which were then manually refined to ensure robust tracking for the neonate (Fig1a).We used high-quality dMRI data from 445 neonates scanned at 29-45 weeks PMA using a bespoke setup, publicly released from the developing Human Connectome Project (dHCP)7 (Fig1c). Fibre orientations were modelled (up to 3 per voxel)8 and used for probabilistic tractography5,9 for each subject. Tract atlases were generated by averaging results across the group (Fig1b).
To assess robustness against data quality, we used an additional dataset of 22 neonates scanned at 37-42 weeks PMA10 (“good-quality” Oxford dataset), acquired using non-specialised hardware. Further, we generate a “standard-quality” DTI dataset (removing the b=2000s/mm2 shell from the good-quality dataset) (Fig1c). Tract-atlases were compared, and inter-subject variation assessed within and between cohorts through paired correlations of thresholded normalised tract probability maps at the subject-level.
We explored whether the reconstructed tracts could capture previously reported developmental trends in WM microstructure3,11–17. Taking the tract atlases as regions of interest, we calculated tract-wise fractional anisotropy (FA) and mean diffusivity (MD) for each dHCP subject (using the b=1000s/mm2 shell) and used linear regression models to assess relationships between microstructure and PMA (accounting for a set of confounds) (Fig1d).
Finally, using the correspondence of tracts across diverse brains, we directly compared connectivity within and across species. We constructed group-averaged connectivity blueprints18 (i.e. patterns of connections of different cortical areas to WM) using WM tracts as landmarks (Fig2a) and compared such patterns via Kullback-Leibler divergence5,18,19 (KLD) between neonatal, adult20,21 and macaque5,22 brains (Fig2b-c). Furthermore, we built blueprints for neonatal age-groups and explored changes in “predictability” (minimum row-wise KLD across brains) with age relative to the adult.
Results
Standardised protocols were developed for 42 major WM tracts and used to generate neonatal tract atlases (Fig3a). Crucially, these protocols provide consistently defined tracts with existing protocols for the adult and macaque5 (Fig3b).We found strong similarity between tract atlases across the three datasets (Fig4a), showing good tract delineations even with standard protocols. The average spatial correlation across all tracts was 0.89 (std=0.04) between the dHCP and Oxford, and 0.86 (std=0.08) between the dHCP and DTI data. Inter-subject variability in the tractography results was assessed within and across the subject groups relative to the dHCP dataset. Inter-subject variability was relatively consistent across datasets with, as expected, greater similarity within groups, albeit with greater variance in the DTI dataset (Fig4a). These analyses demonstrate that the protocols give reproducible tracts across varying quality datasets.
We also assessed within-tract microstructural changes using DTI measures. All tracts showed a significant increase in FA and reduction in MD with age, after confound correction. Linear regression coefficients (rate of change with age for FA/MD, Fig4b), reflect the asynchronous maturation of different tracts. In general, projection fibres maturate more quickly over this period, followed by commissural and association fibres, with limbic fibres showing the slowest rates. This generally agrees with a-priori known trends from the literature3,11–17.
The protocols were further used to probe connectivity differences across diverse brains, using corresponding WM tracts as landmarks. Connectivity blueprints were constructed for the neonatal, adult and macaque brains (Fig5a). Connectivity dissimilarity maps using these tracts reveal greater similarity within than across species, as expected (Fig5b: left). Comparing blueprints constructed from neonatal age-groups, we observe a trend towards greater predictability with age relative to the adult, particularly in the frontal and parietal regions (Fig5b).
Discussion/Conclusion
We have developed a novel library of standardised tractography protocols for the neonatal brain, consistent with those for the adult human and macaque brain, which are robust against data quality and capture accurate anatomical information. Furthermore, we explored divergence in connectivity patterns between age-groups and across species, using the tracts to construct connectivity blueprints revealing a trend of greater predictability with neonatal age relative to the adult. These protocols facilitate quantitative comparisons across the ontogenetic and phylogenetic dimensions of brain connectivity.Acknowledgements
S.W. was supported by an MRC PhD Studentship UK [MR/N013913/1]. S.W. and S.S. are supported by an ERC Consolidator grant (101000969). E.T. was supported by funding from the Engineering and Physical Sciences Research Council (EPSRC) and Medical Research Council (MRC) [ONBI CDT, EP/L016052/1]. J.D. is supported by the IdEx Université de Paris (ANR-18-IDEX-0001), the Médisite Foundation and the “Fondation de France”. L.B. is funded by a BLISS research grant. R.S. is funded by a Senior Wellcome Research Fellowship [207457/Z/17/Z]. S.J. is supported by a Wellcome Collaborative Award [215573/Z/19/Z] and a Wellcome Senior Research Fellowship [221933/Z/20/Z]. R.B.M. is supported by a BBSRC David Phillips Fellowship (BB/N019814/1) and WIN is supported by Wellcome Trust center grant (203139/Z/16/Z).
Neonatal data were provided in part by the developing Human Connectome Project, a KCL-Imperial-Oxford Consortium funded by the European Research Council (319456). We are grateful to the families who generously supported this trial. Adult human data were provided by the Human Connectome Project, WU-Minn Consortium (Principal Investigators: David Van Essen and Kamil Ugurbil; 1U54MH091657).
The computations described in this paper were performed in part using the University of Nottingham’s Augusta HPC service and the Precision Imaging Beacon Cluster, which provide High Performance Computing service to the University’s research community.
References
1. Holland, D. et al. Structural Growth Trajectories and Rates of Change in the First 3 Months of Infant Brain Development. JAMA Neurol. 71, 1266–1274 (2014).
2. Kulikova, S. et al. Multi-parametric evaluation of the white matter maturation. Brain Struct. Funct. 220, 3657–3672 (2015).
3. Dubois, J. et al. Asynchrony of the early maturation of white matter bundles in healthy infants: Quantitative landmarks revealed noninvasively by diffusion tensor imaging. Hum. Brain Mapp. 29, 14–27 (2008).
4. Van Essen, D. C. & Barch, D. M. The human connectome in health and psychopathology. World Psychiatry 14, 154–157 (2015).
5. Warrington, S. et al. XTRACT - Standardised protocols for automated tractography in the human and macaque brain. Neuroimage (2020). doi:10.1016/j.neuroimage.2020.116923
6. Schuh, A. et al. Unbiased construction of a temporally consistent morphological atlas of neonatal brain development. bioRxiv 251512 (2018). doi:10.1101/251512
7. Hughes, E. J. et al. A dedicated neonatal brain imaging system. Magn. Reson. Med. 78, 794–804 (2017).
8. Jbabdi, S., Sotiropoulos, S. N., Savio, A. M., Graña, M. & Behrens, T. E. Model-based analysis of multishell diffusion MR data for tractography: How to get over fitting problems. Magn. Reson. Med. 68, 1846–1855 (2012).
9. Behrens, T. E. J., Berg, H. J., Jbabdi, S., Rushworth, M. F. S. & Woolrich, M. W. Probabilistic diffusion tractography with multiple fibre orientations: What can we gain? Neuroimage 34, 144–155 (2007).
10. Baxter, L. et al. Functional and diffusion MRI reveal the neurophysiological basis of neonates’ noxious-stimulus evoked brain activity. Nat. Commun. 12, 2744 (2021).
11. Khan, S. et al. Fetal brain growth portrayed by a spatiotemporal diffusion tensor MRI atlas computed from in utero images. Neuroimage 185, 593–608 (2019).
12. Wilson, S. et al. Development of human white matter pathways in utero over the second and third trimester. Proc. Natl. Acad. Sci. 118, (2021).
13. Huang, H. & Vasung, L. Gaining insight of fetal brain development with diffusion MRI and histology. Int. J. Dev. Neurosci. 32, 11–22 (2014).
14. Tournier, J.-D. et al. Resolving crossing fibres using constrained spherical deconvolution: validation using diffusion-weighted imaging phantom data. Neuroimage 42, 617–625 (2008).
15. Ball, G. et al. Development of cortical microstructure in the preterm human brain. Proc. Natl. Acad. Sci. 110, 9541–9546 (2013).
16. Jaimes, C. et al. In vivo characterization of emerging white matter microstructure in the fetal brain in the third trimester. Hum. Brain Mapp. 41, 3177–3185 (2020).
17. Keunen, K. et al. Early human brain development: insights into macroscale connectome wiring. Pediatr. Res. 84, 829–836 (2018).
18. Mars, R. B. et al. Whole brain comparative anatomy using connectivity blueprints. Elife 7, (2018).
19. Kullback, S. & Leibler, R. A. On Information and Sufficiency. Ann. Math. Stat. (1951). doi:10.1214/aoms/1177729694
20. Sotiropoulos, S. N. et al. Advances in diffusion MRI acquisition and processing in the Human Connectome Project. Neuroimage 80, 125–143 (2013).
21. Van Essen, D. C. et al. The WU-Minn Human Connectome Project: an overview. Neuroimage 80, 62–79 (2013).
22. Folloni, D. et al. Dichotomous organization of amygdala/temporal-prefrontal bundles in both humans and monkeys. Elife 8, (2019).
Figures
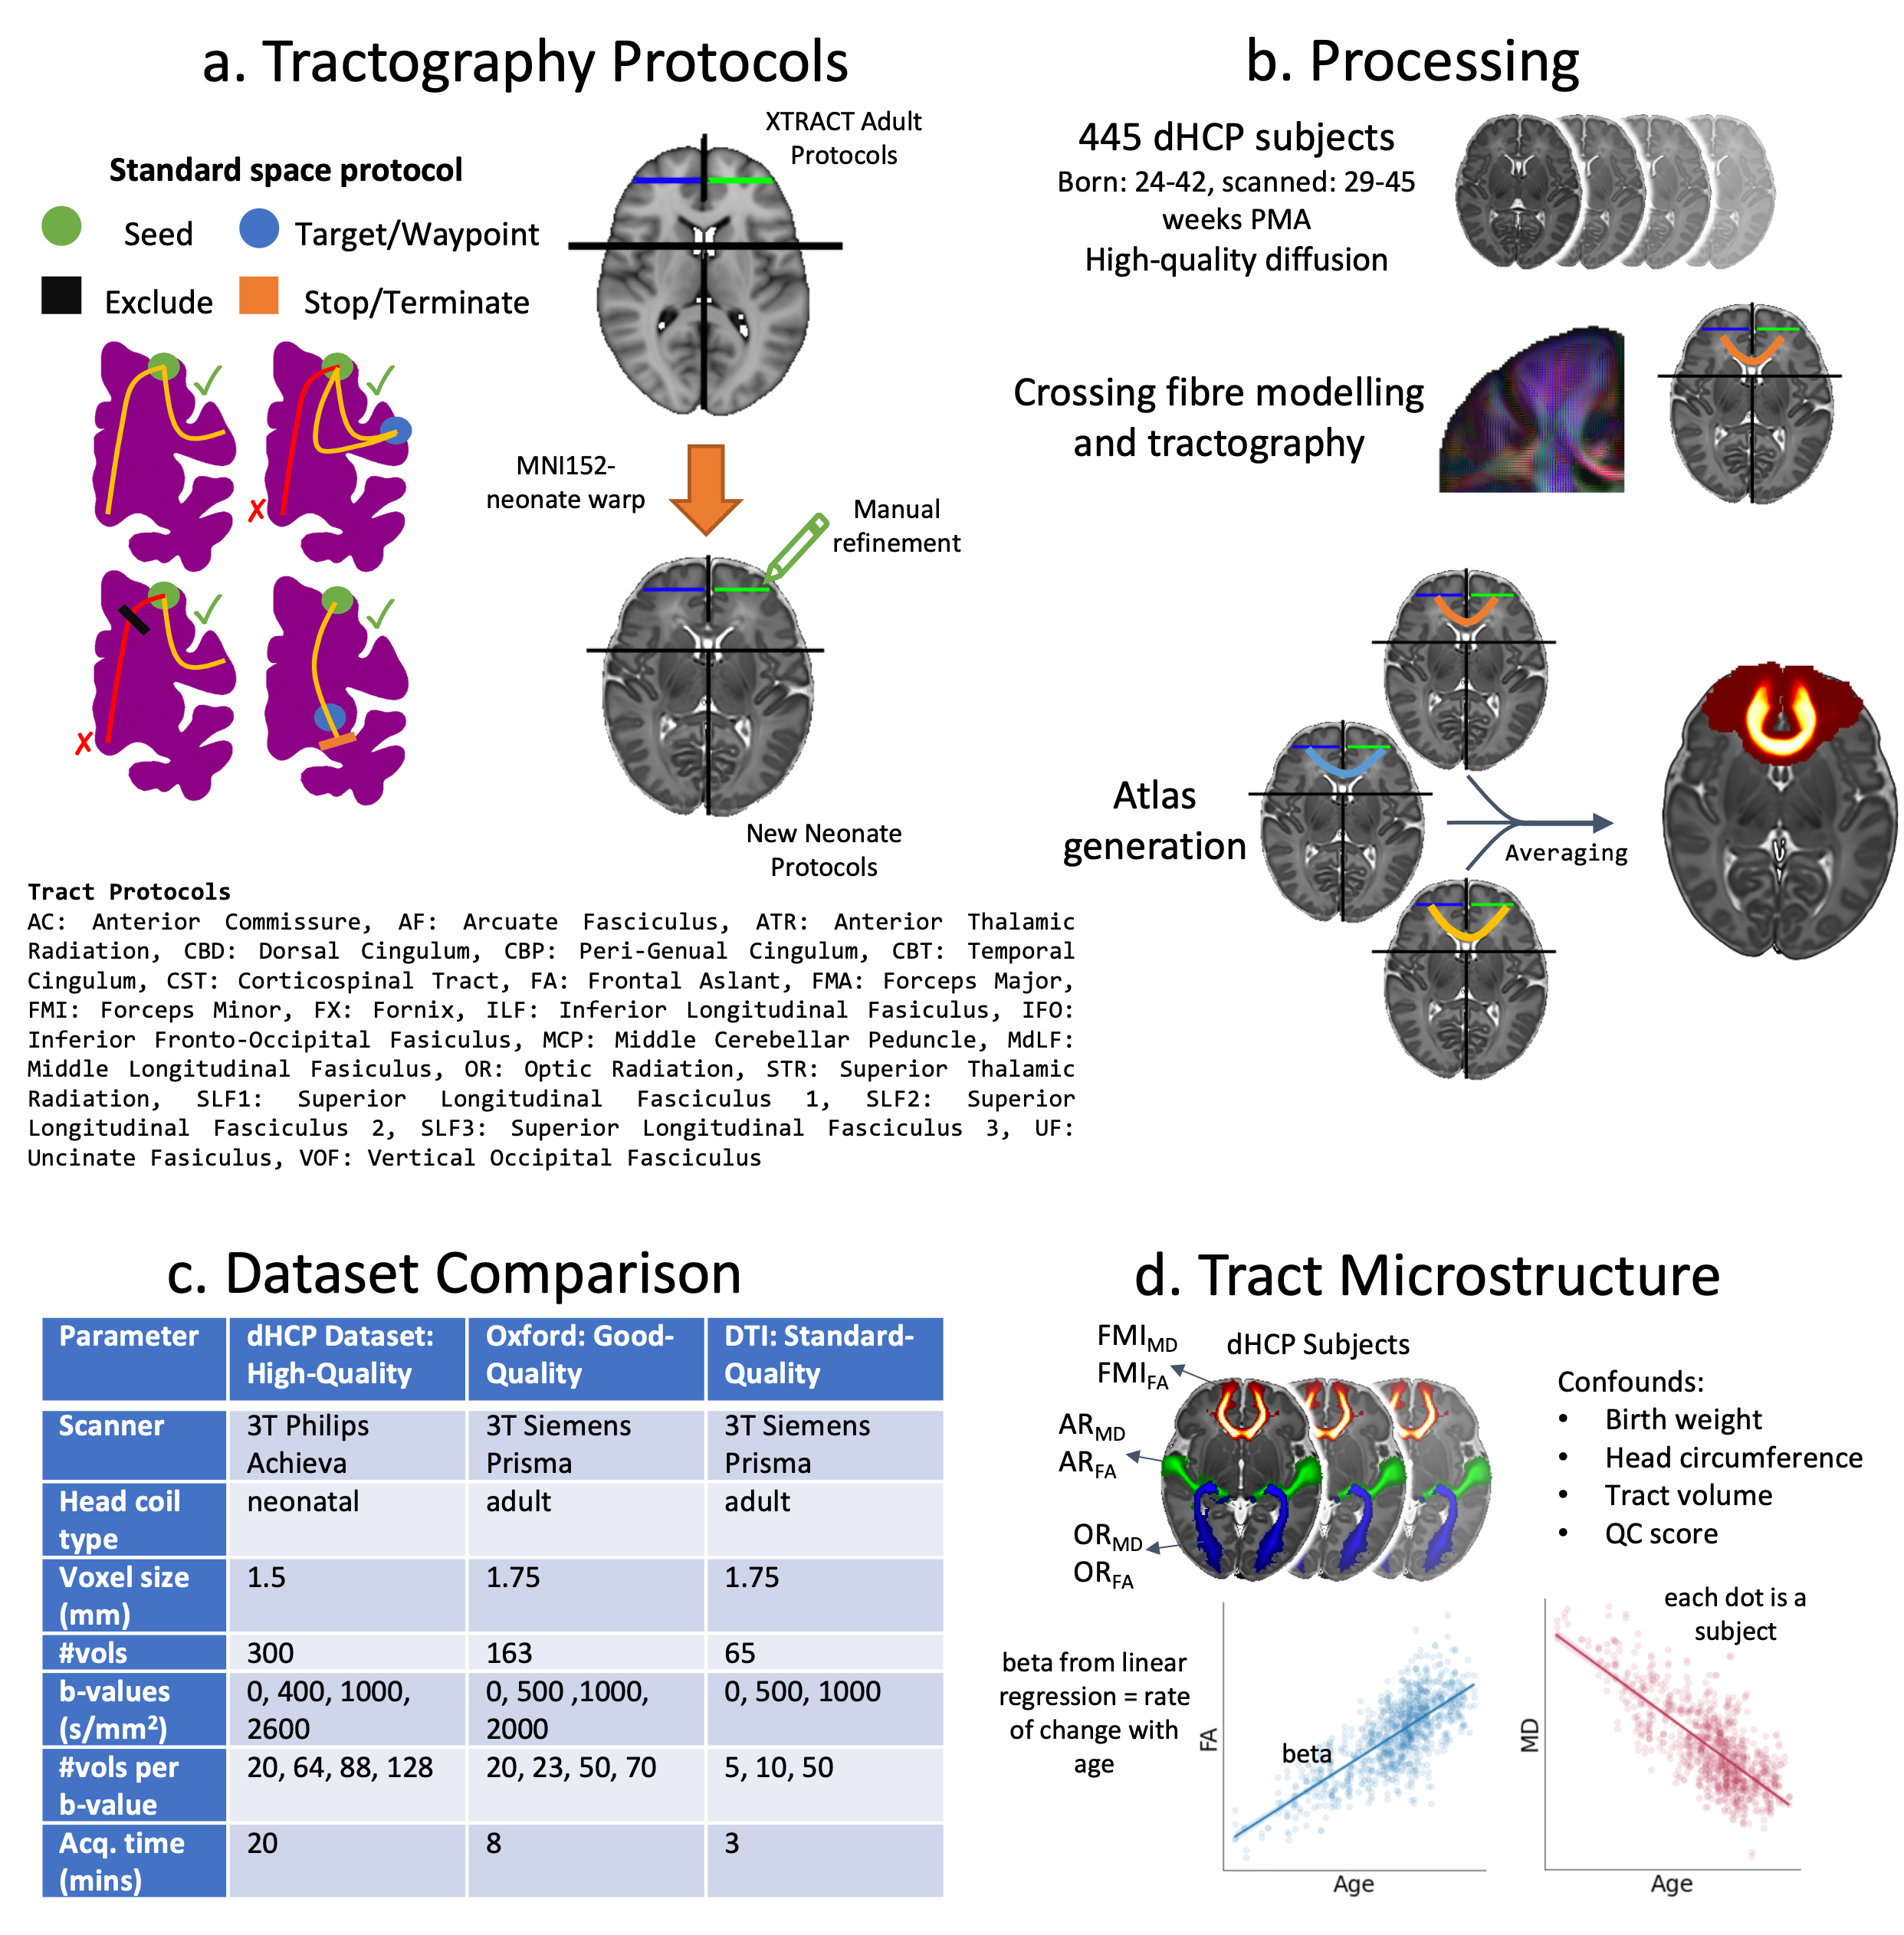
Figure 1. a) Tractography protocols are defined as sets of ROIs and rules, following XTRACT principles. b) Pre-processing for dHCP subjects: crossing-fibre modelling, tractography, and tract-atlas generation. c) Acquisition details for the three datasets used in robustness against data-quality analysis. d) Tract microstructure analysis: tract atlases were warped to the subject’s native space and used as ROIs to calculate tract-wise average FA and MD for each dHCP subject. These were then used to build linear models to estimate the microstructure maturation with age.
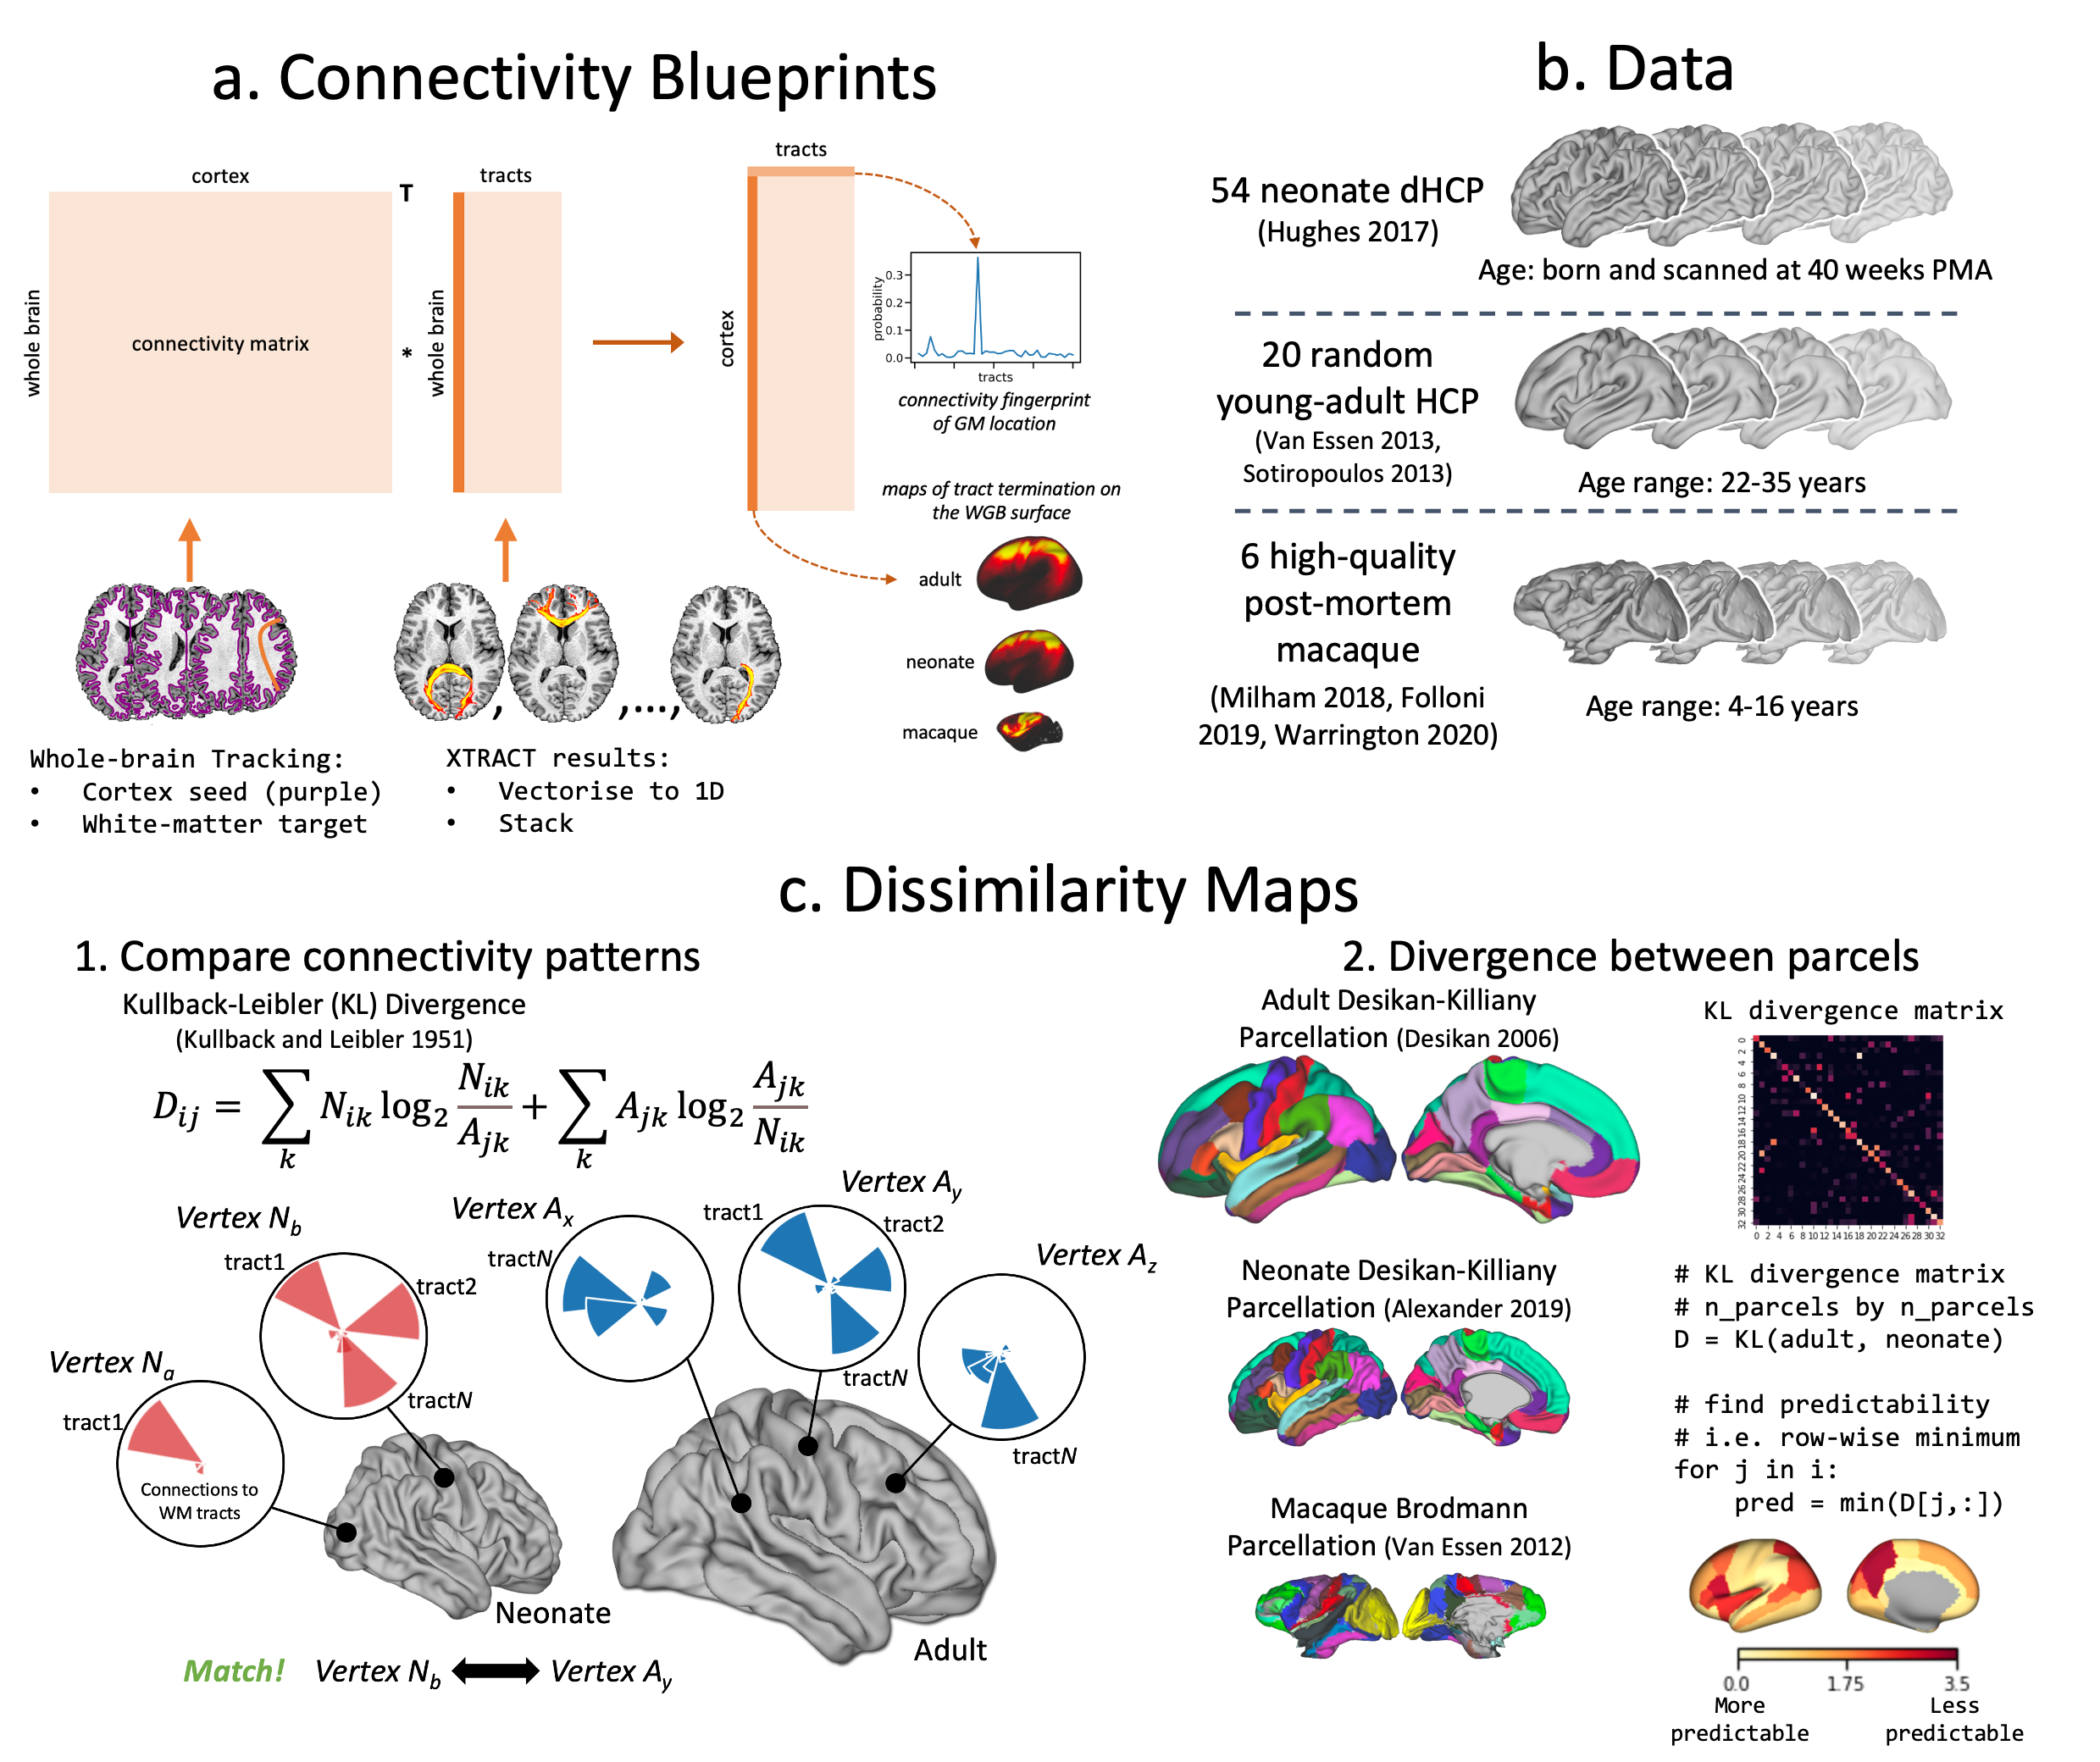
Figure 2. a) Connectivity blueprints (cortical vertices by tracts) built as the dot product of a whole-brain connectivity matrix (whole-brain WM voxels by cortical vertices) and vectorised XTRACT tracts (WM voxels by tracts). Rows are cortical connectivity patterns of a given cortical vertex; columns are cortical territories of tracts. b) Data used for cross-species and lifespan comparisons. c) Blueprints are compared using KLD, a measure of statistical similarity (step 1.), and dissimilarity maps generated by finding the minimum row-wise KLD (step 2.) across parcels.
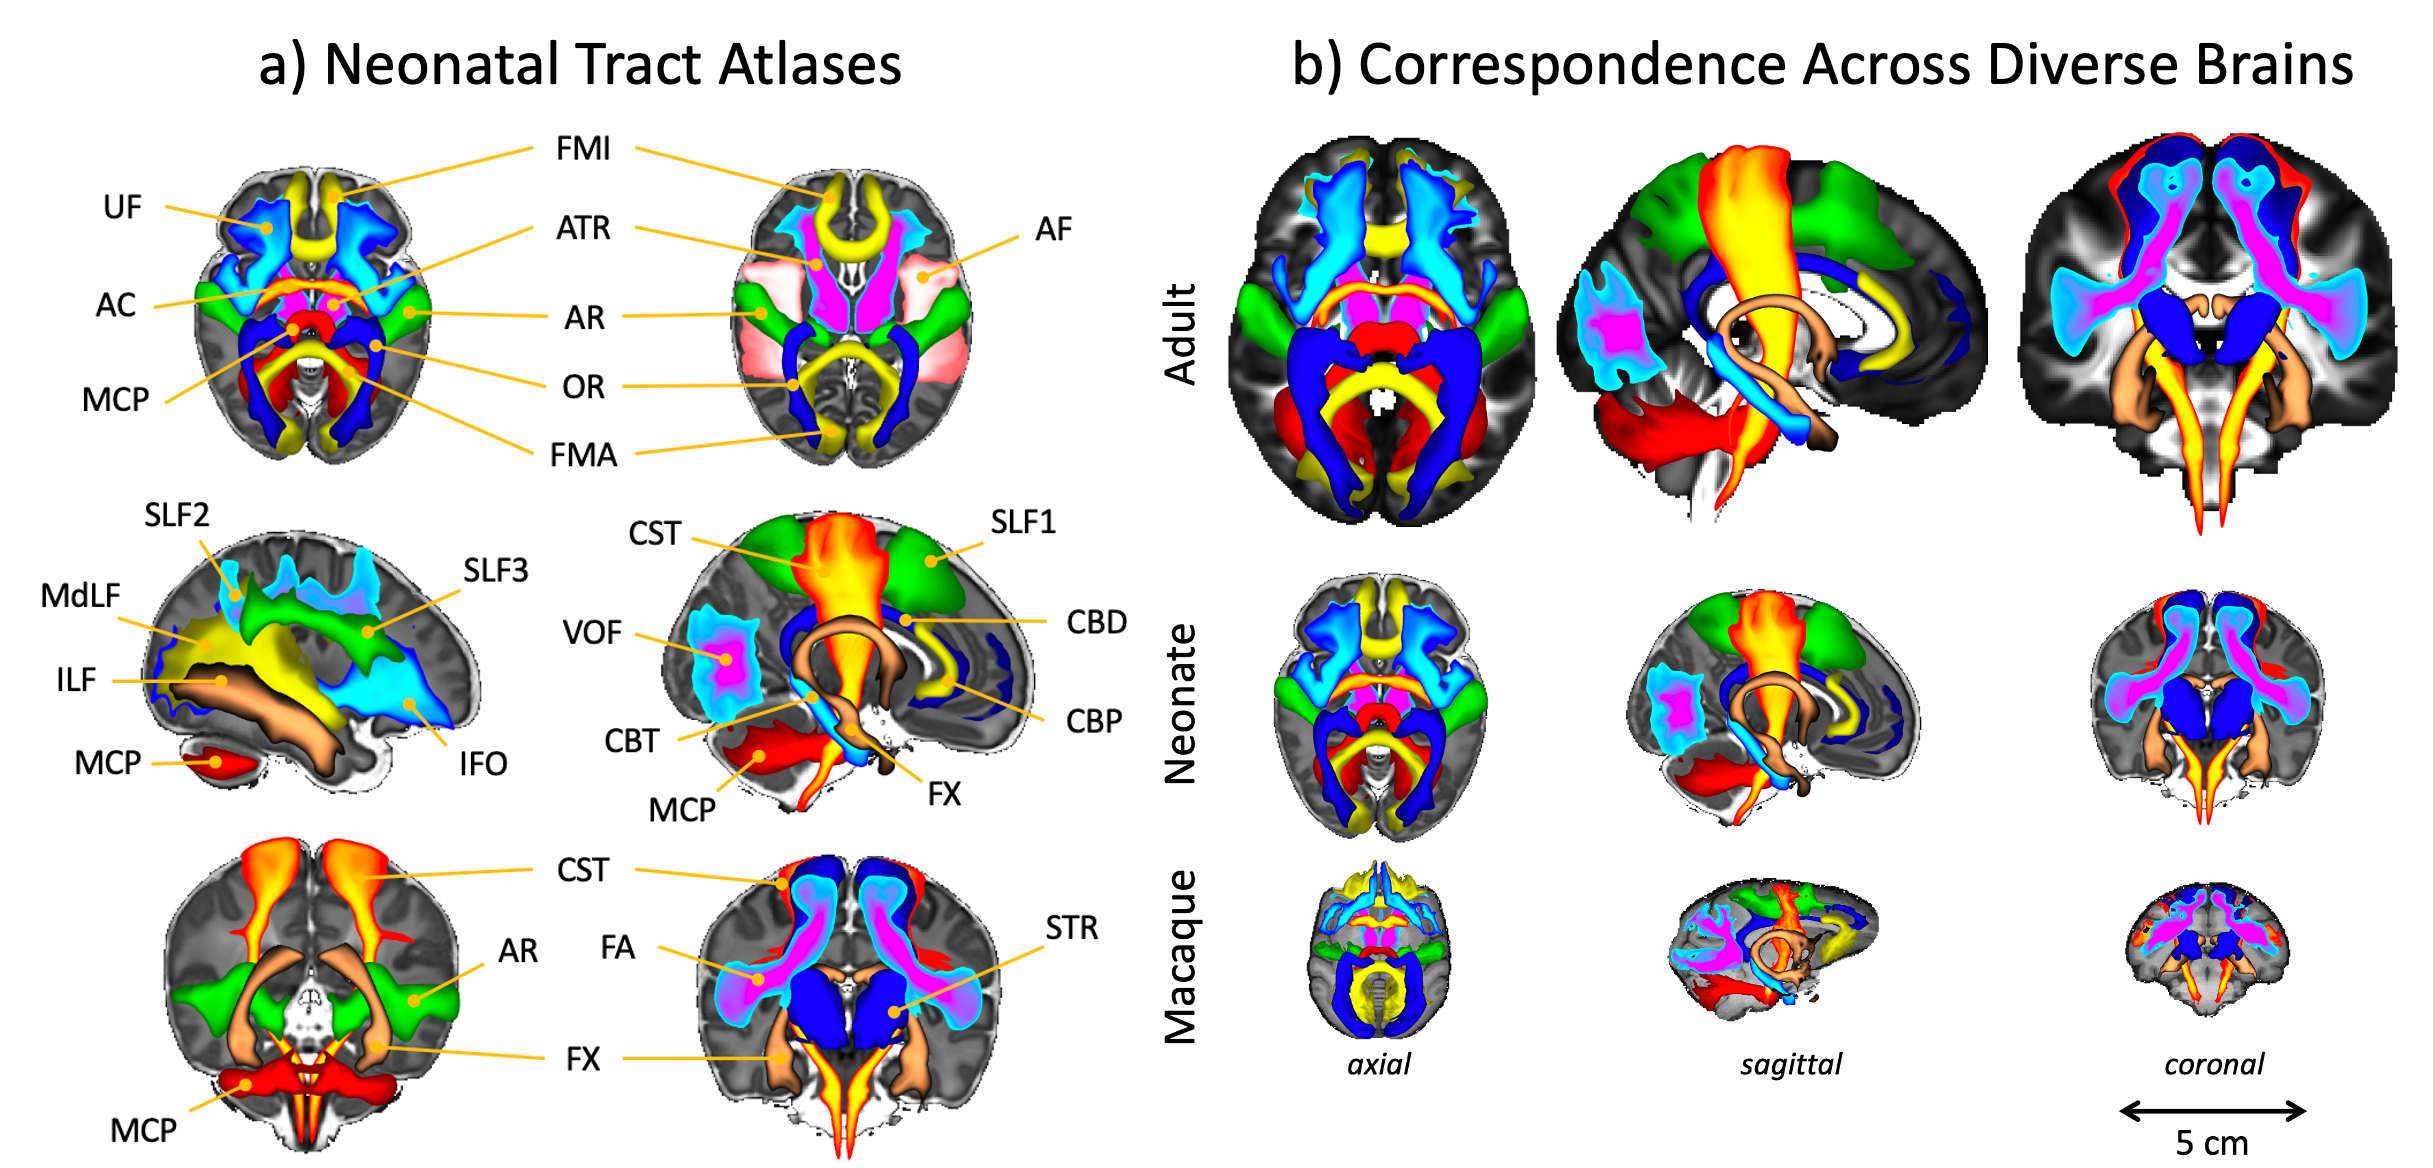
Figure 3. a) Views of the population-percentage tract atlases from the 445 dHCP subjects. The tract atlases are created by averaging binarised (at a threshold of 0.1%) waytotal-normalised tract density maps across subjects. b) Cross age-group and species comparison of results from the adult human and macaque brain (XTRACT tract atlases5). For ease of visualisation, all tracts are viewed as maximal intensity projections with a display range of 30-100% of population coverage.
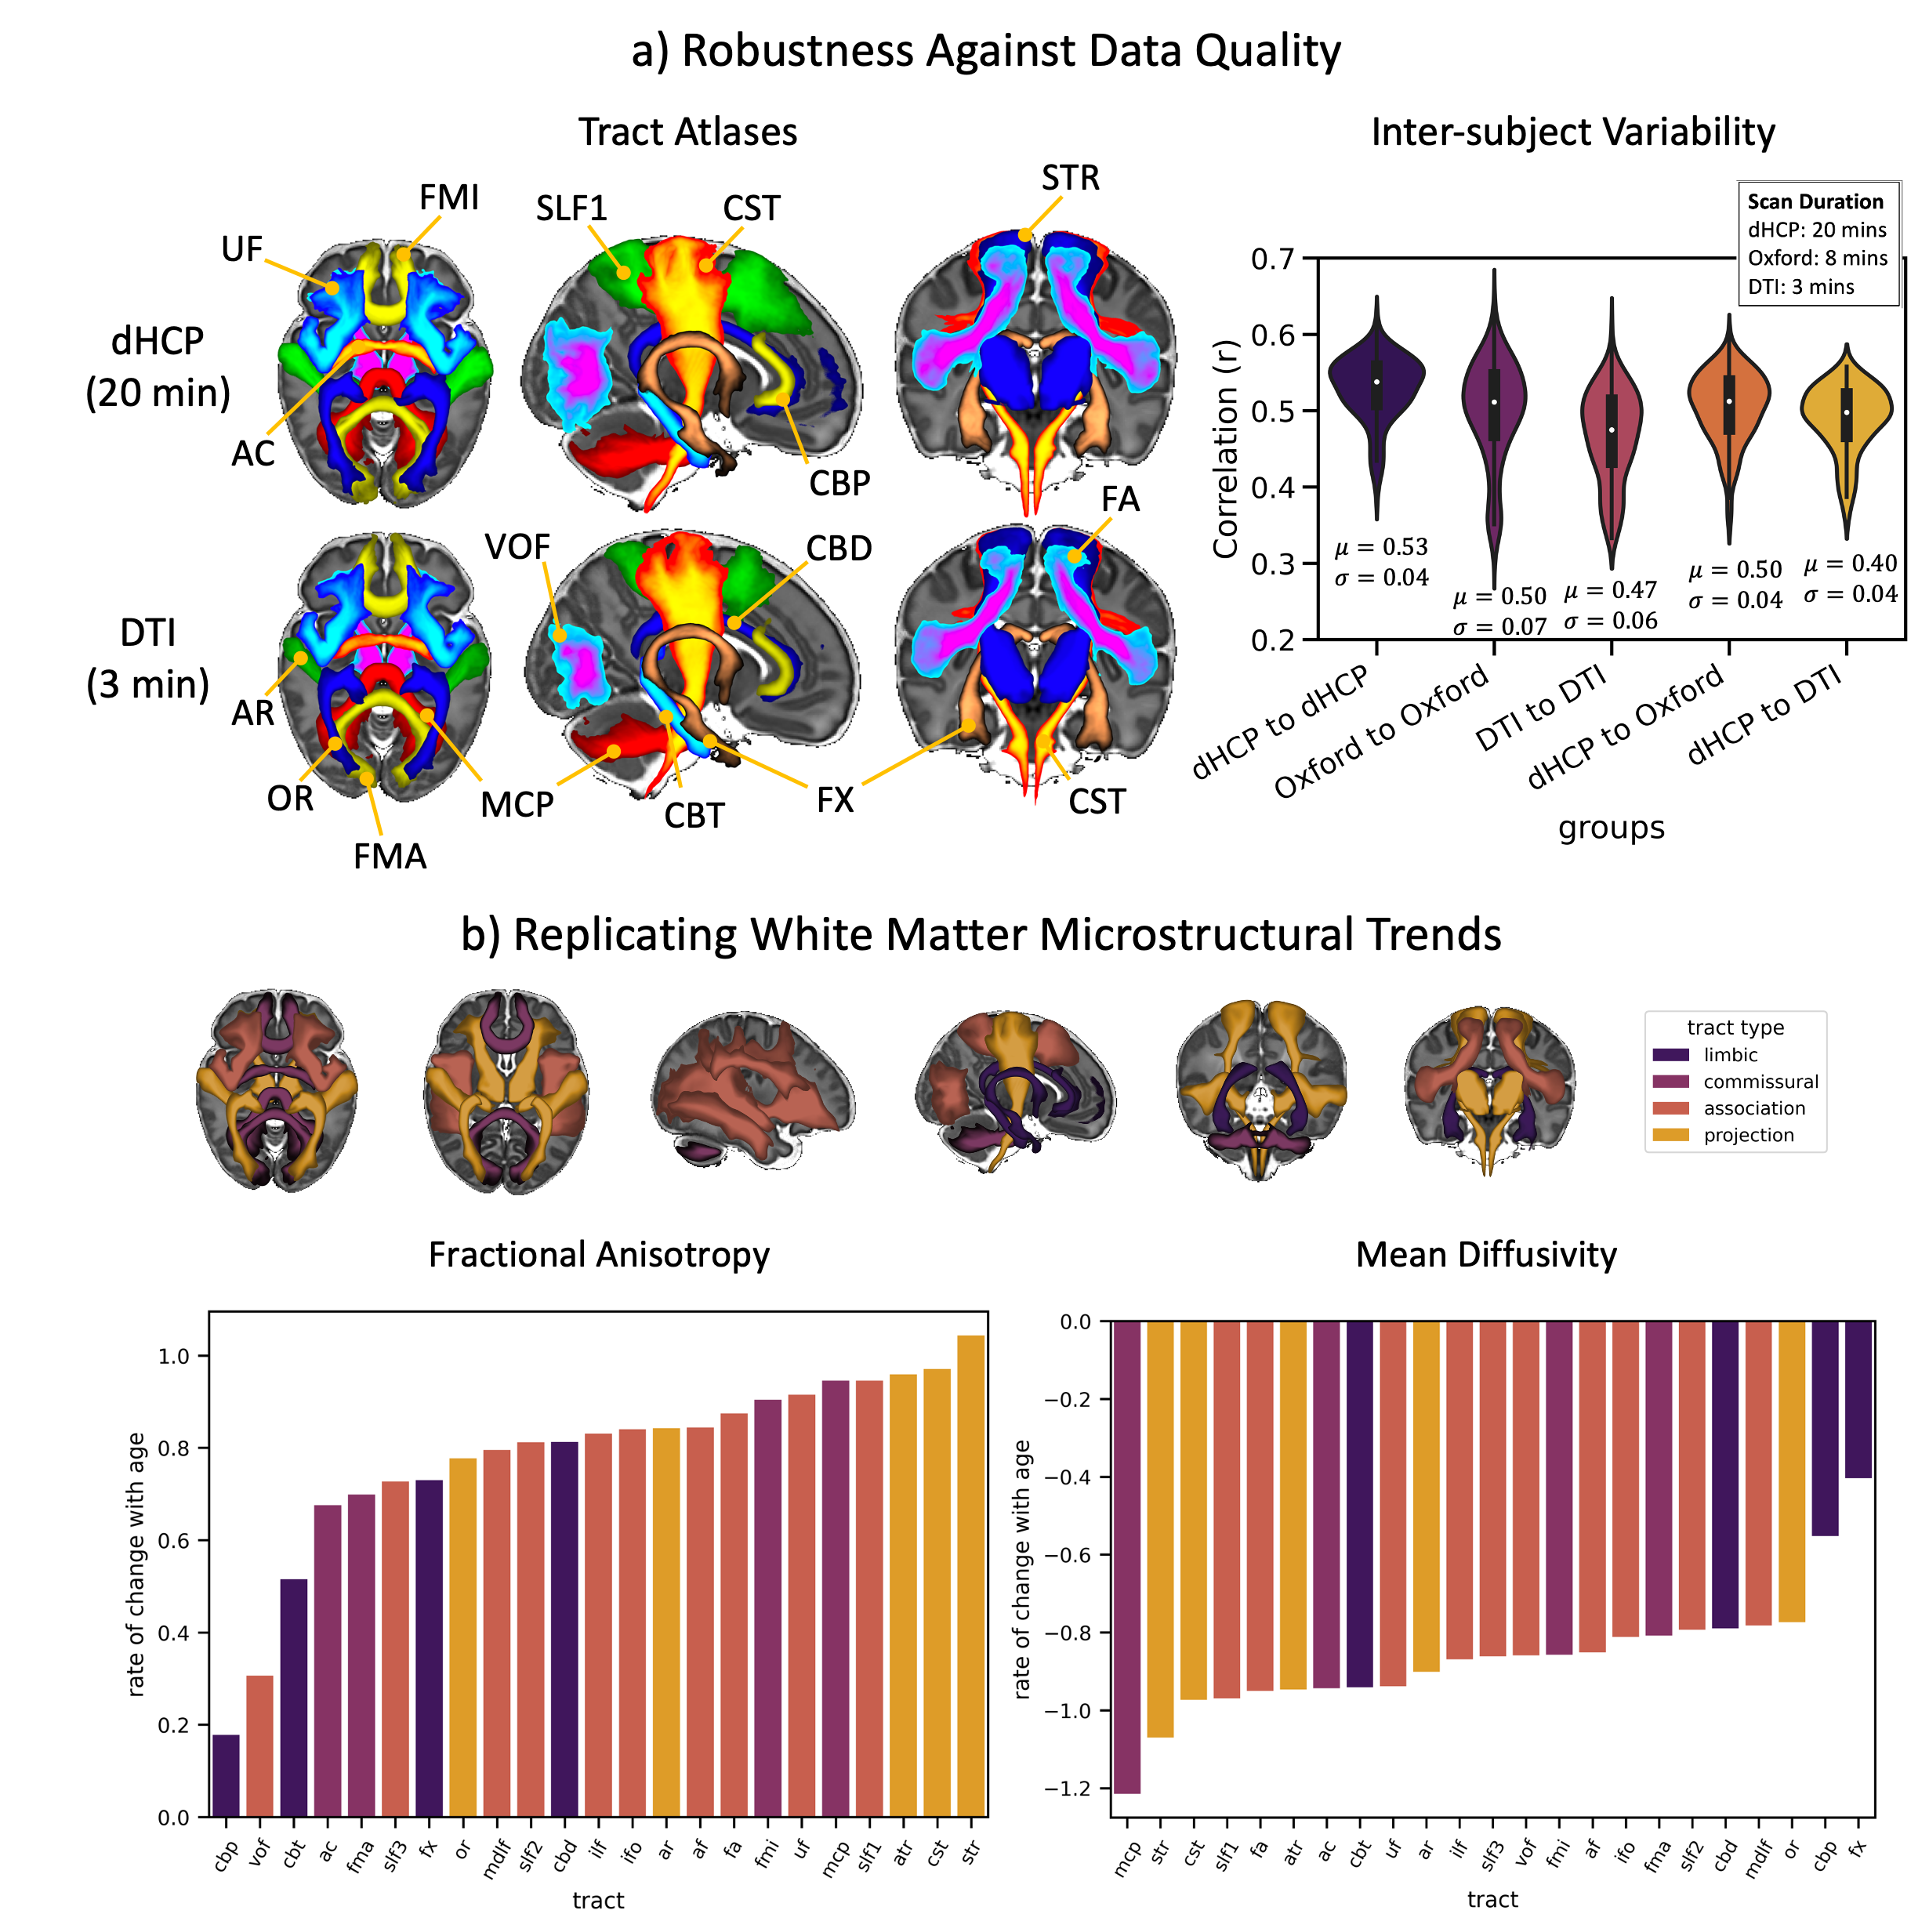
Figure 4. a) Left: Tract atlases from an age and sex matched groups of 22 subjects from the dHCP (top) and DTI (bottom) datasets. Right: Inter-subject comparisons of tracts across datasets: each represents 231 correlations between pairs of subjects, averaged across all tracts, within and across datasets (µ=mean, σ=standard deviation). b) Tract-specific changes (colour coded by tract type – top row) in microstructure (left – FA, right – MD) with age (range = 29.3 - 45.1 weeks PMA at scan) for the dHCP subjects: y-axes correspond to the beta coefficients from the linear models.
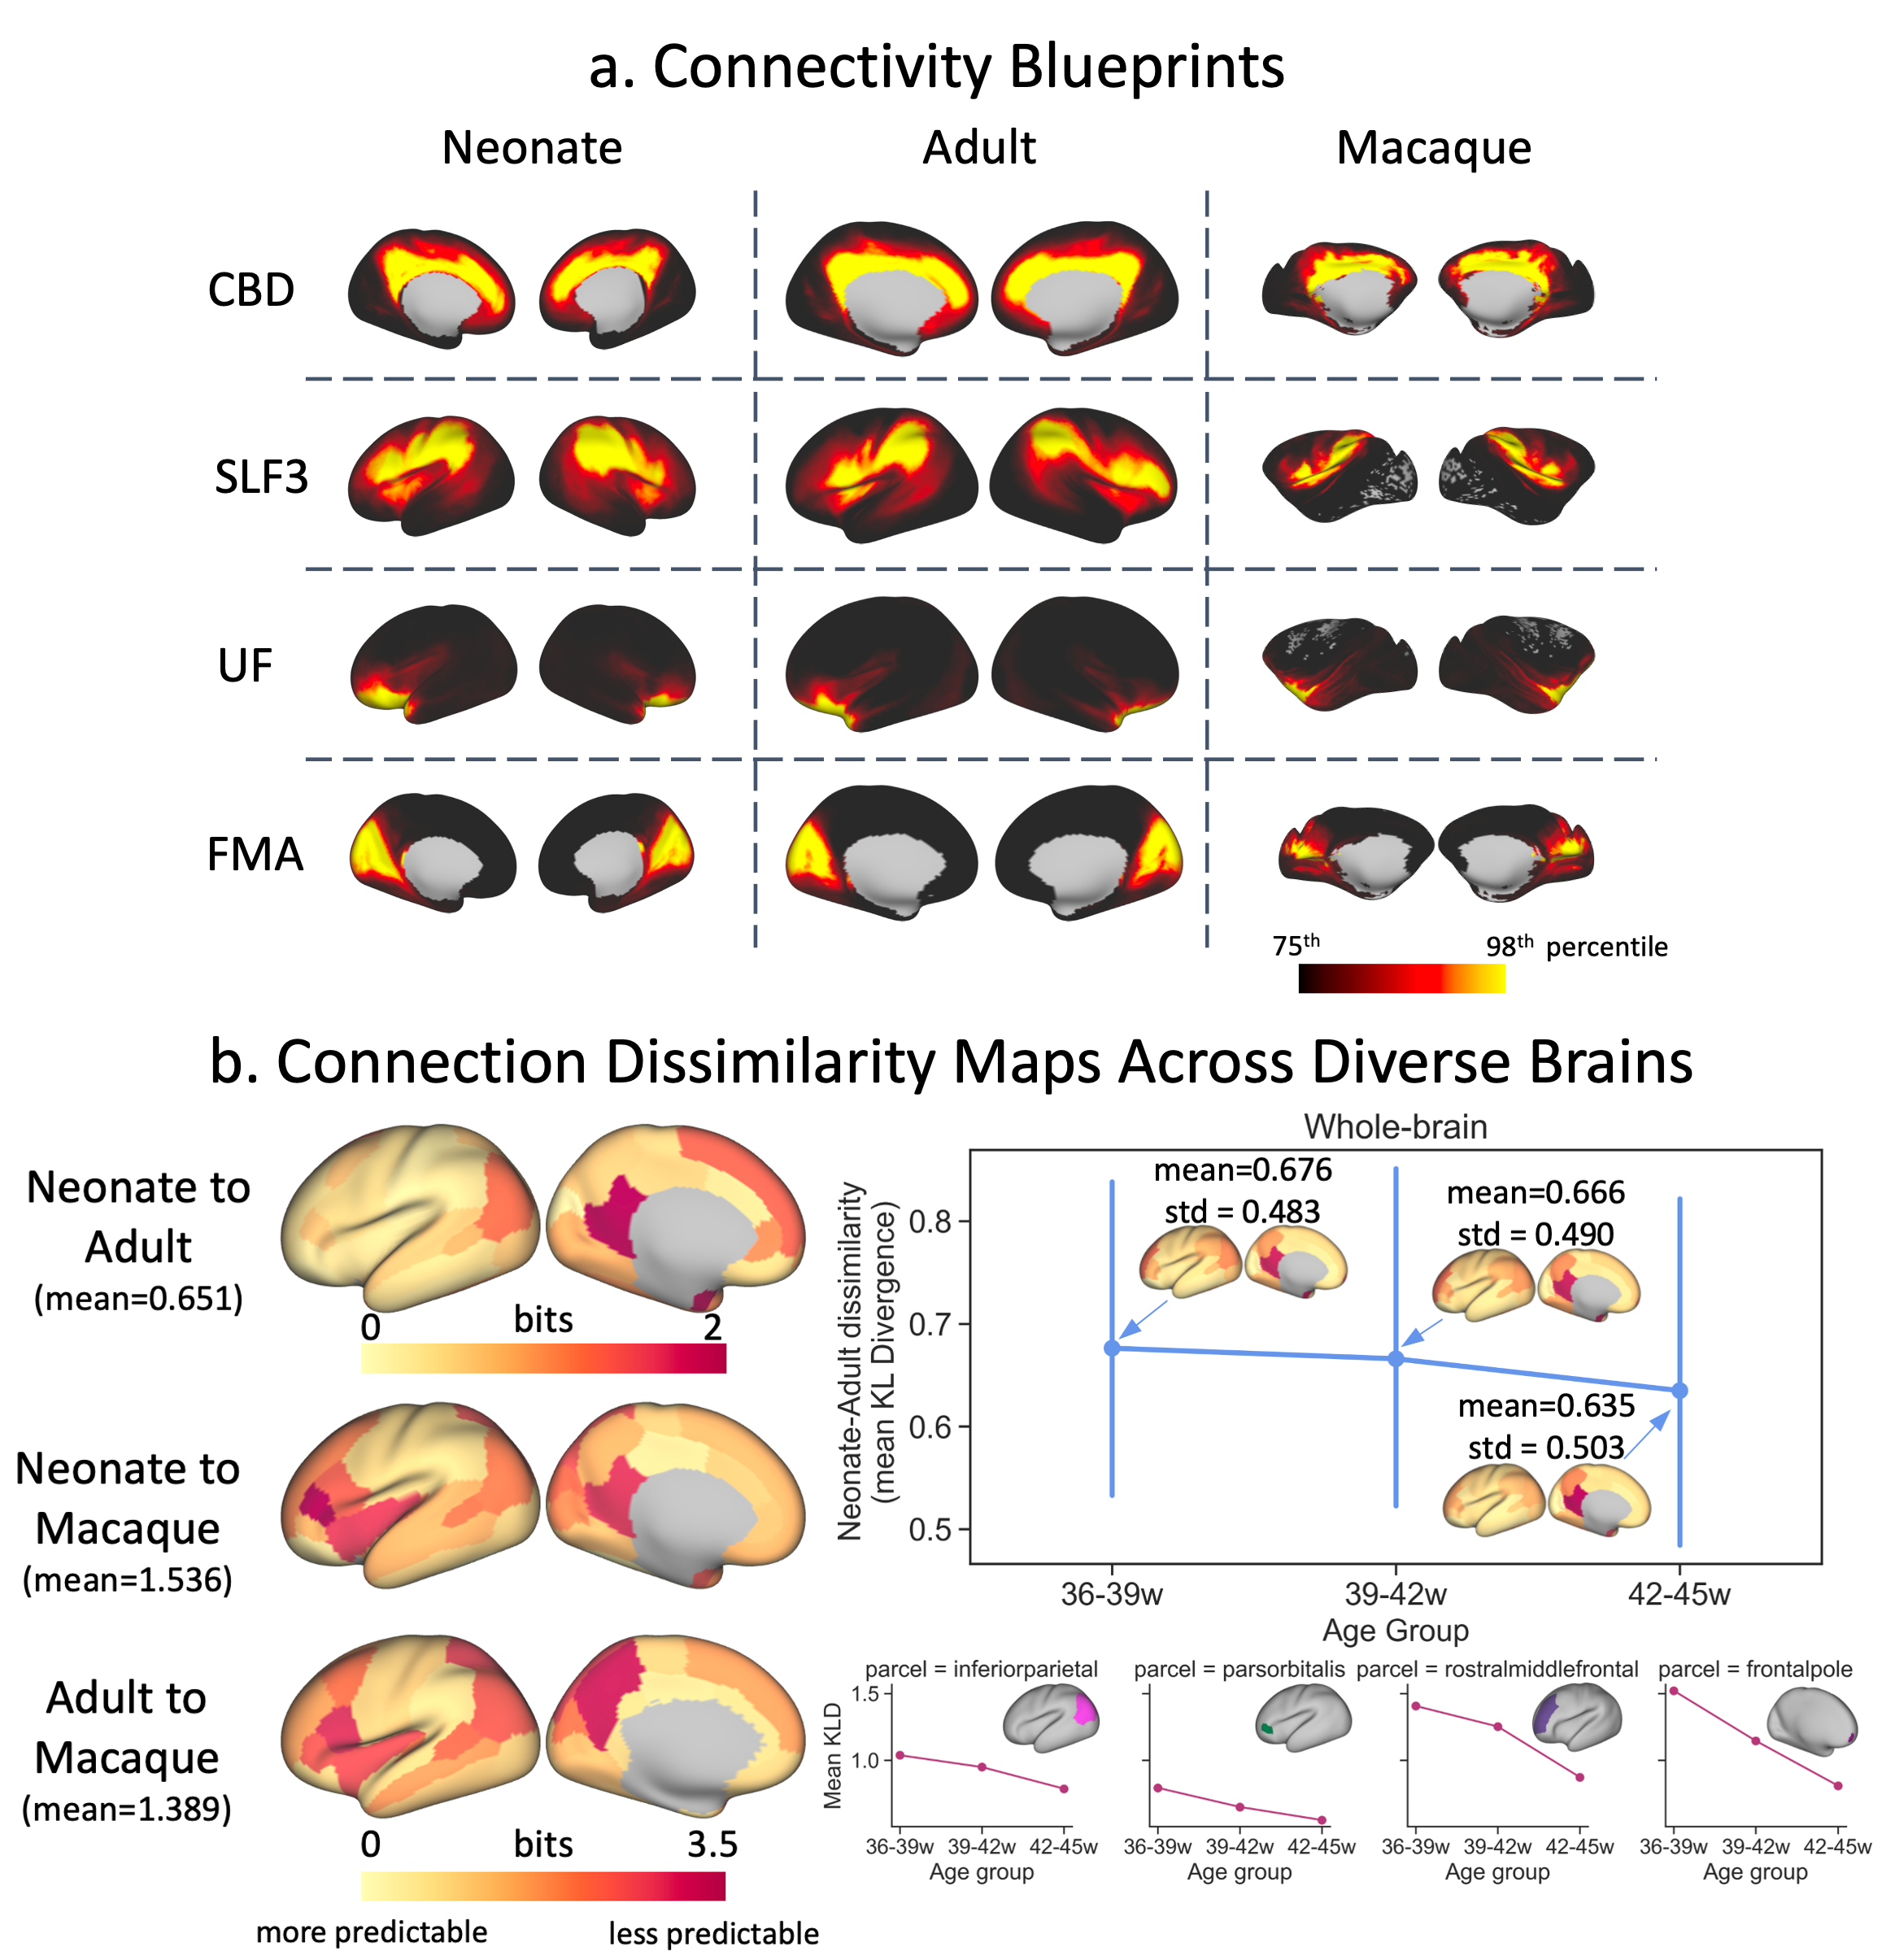
Figure 5. a) Cortical territories of example WM tracts (columns of the connectivity blueprint) for the neonate, adult and macaque. b) Left: Dissimilarity maps (minimum KLD) for neonate-adult (top), neonate-macaque (middle) and adult-macaque (bottom) comparisons. Right: Change in dissimilarity between corresponding parcels with neonatal age (70 neonates per group scanned at 36-39, 39-42, and 42-45 weeks PMA) relative to the adult brain for the whole-brain (top: mean and standard deviation across all parcels) and for example parcels (bottom).