0518
Short superficial U-fiber systems and aging: a longitudinal diffusion MRI study1Vanderbilt University Medical Center, Nashville, TN, United States, 2Vanderbilt University, Nashville, TN, United States, 3University of Pittsburgh Medical Center, Pittsburg, PA, United States, 4National Institute on Aging, Baltimore, MD, United States
Synopsis
Superficial U-fiber systems are understudied using diffusion tractography, despite making up a majority of the white matter connections. Here, we used a large, longitudinal dataset from the Baltimore Longitudinal Study of Aging, in combination with innovations in U-fiber tractography dissection, to study U-fiber systems in an aging population. We characterize microstructural features, and for the first time, macrostructural features of length and volume, and find significant associations with age. Characterizing what changes occur, and where they occur, in U-fiber systems will complement traditional long-range tractography research to better understand the biological mechanisms of normal aging.
Introduction
It is estimated that short association fibers, or “U-shaped” fibers running immediately beneath the cortex, may make up as much as 60% of the total white matter volume [1]. However, these have been understudied relative to the long-range association, projection, and commissural fibers of the brain. This is largely because of limitations of diffusion MRI fiber tractography, which is the primary methodology used to non-invasively study the white matter connections [2, 3]. Inspired by recent anatomical considerations and methodological improvements in U-fiber tractography [4], we aim to characterize changes in these fiber systems in normal aging. Moreover, while there is some evidence that microstructural features change in these systems [5], their geometric and volumetric properties have not been investigated. Thus, we characterize both microstructure and macrostructure features of Ufibers in a large, longitudinal dataset, and describe associations between these features and age.Methods
DataThis study uses data from the Baltimore Longitudinal Study of Aging (BLSA) dataset, with 641 subjects scanned multiple times ranging from 1 and 8 sessions, and time between scans ranging from 1 to 10 years, yielding a total of 1322 diffusion datasets. All datasets included only subjects that were cognitively normal throughout the duration of the study, and filtered to include subjects 50+ years old at baseline. Diffusion MRI data was acquired on a 3T Philips Achieva scanner (32 gradient directions, b-value=700s/mm2, TR/TE=7454/75ms, reconstructed voxel size=0.81×0.81×2.2mm, reconstruction matrix=320×320, acquisition matrix=115× 115, field of view=260×260mm).
Tractography and U-fiber dissection
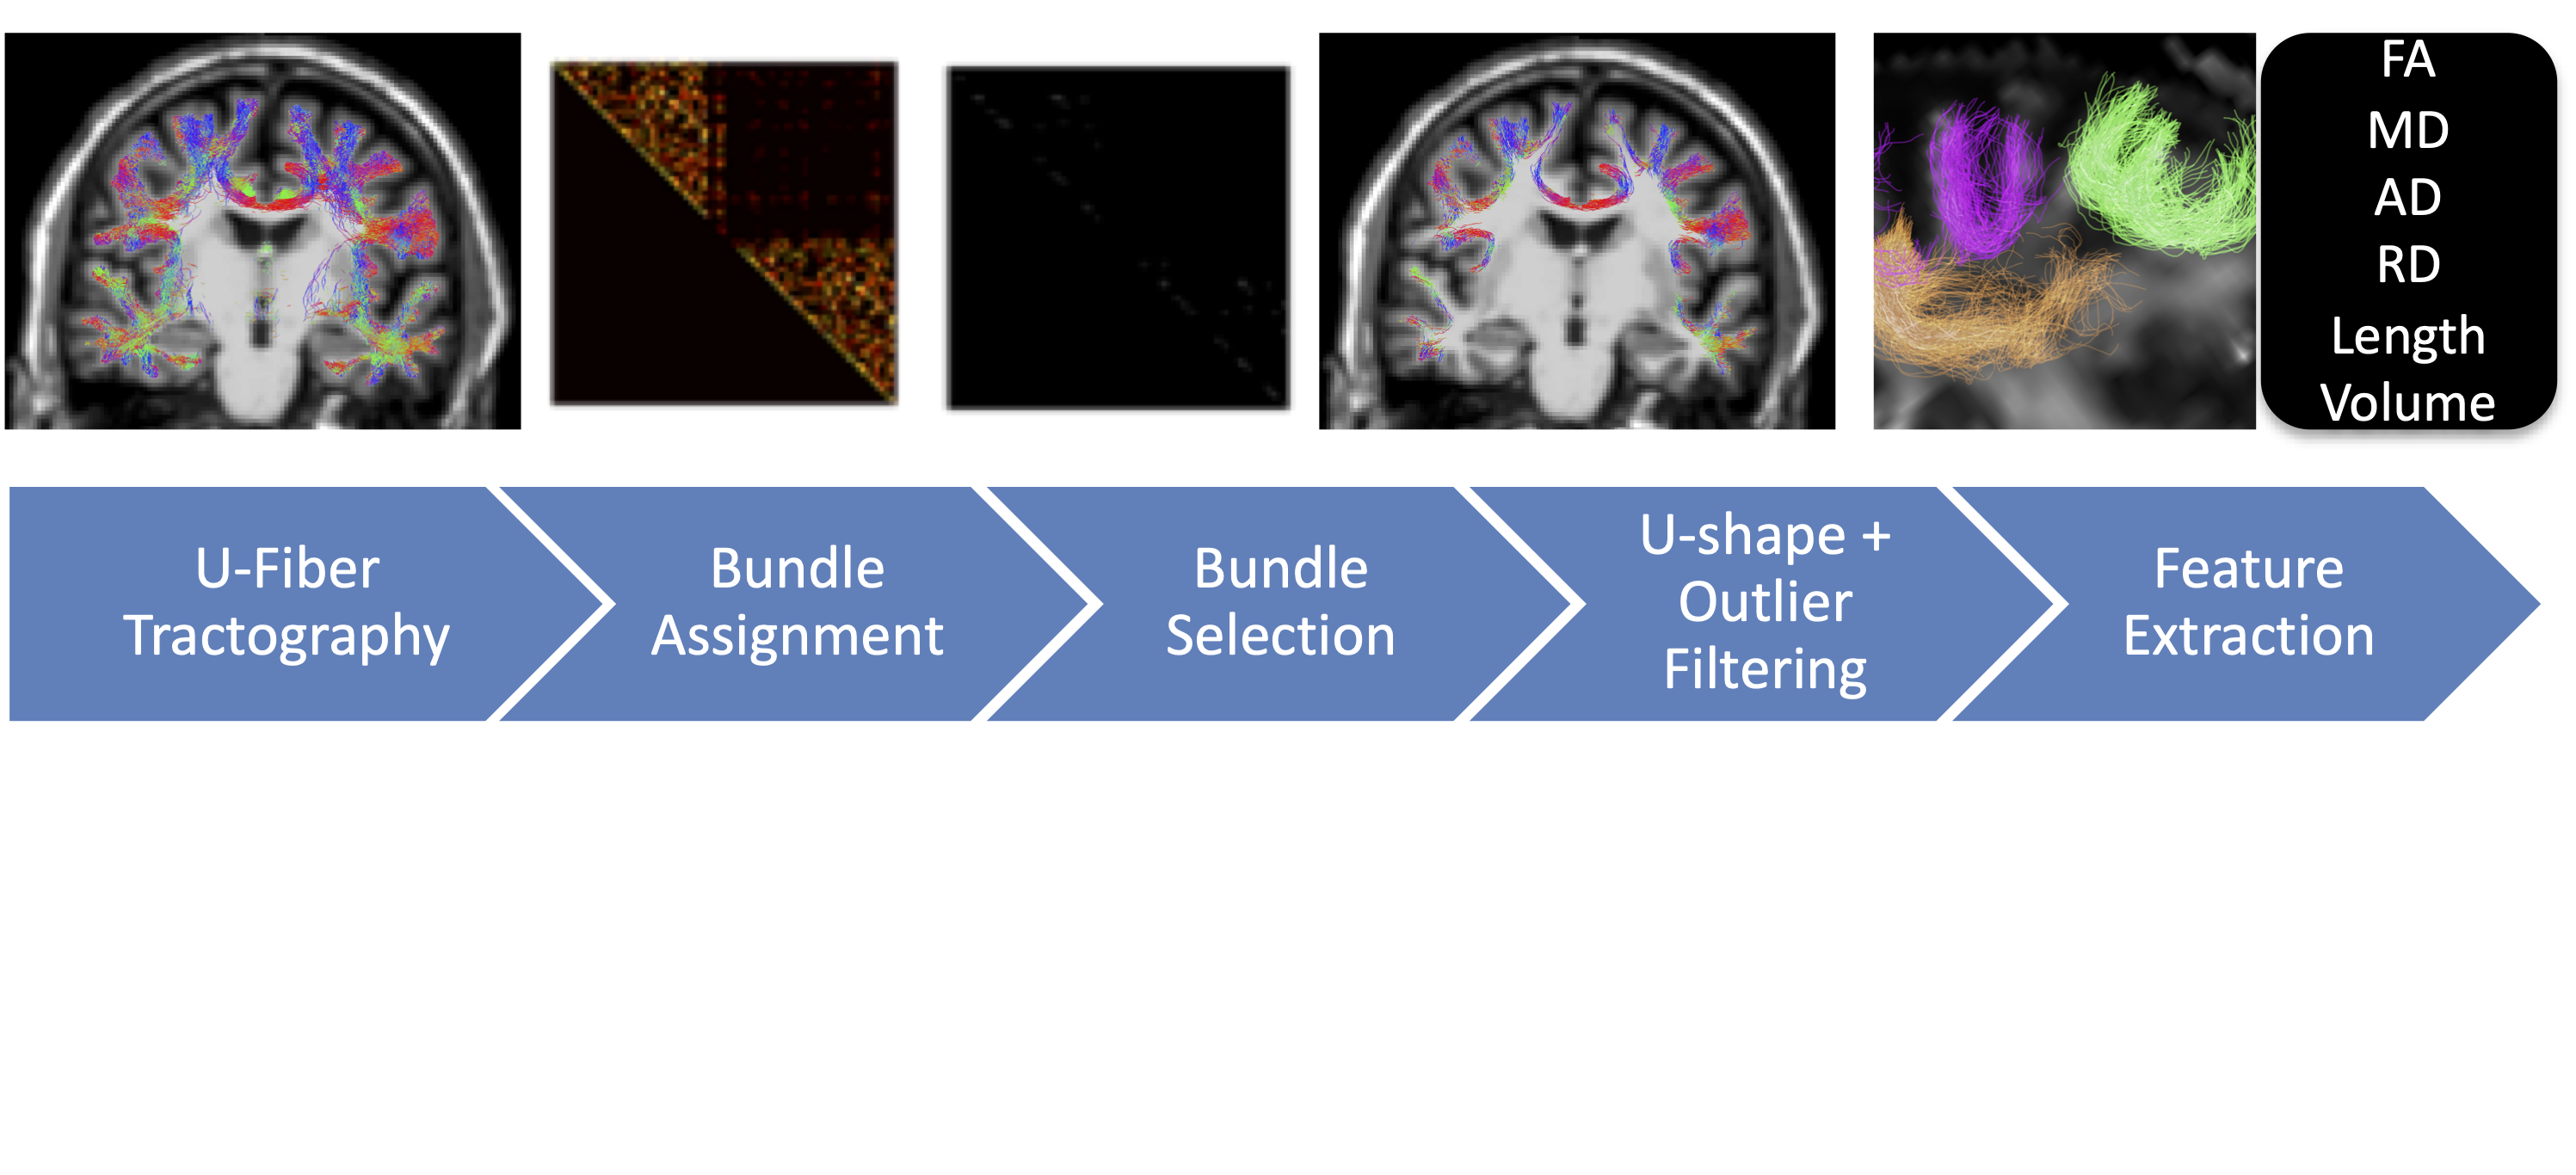
Figure 1 describes the methodological pipeline. Tractography was performed following methodology similar to that of [4] (although without surface-based tracking). This pipeline utilized MRtrix [6] probabilistic tractography to generate 2 million streamlines with a maximum length of 40mm, ensuring anatomically constrained tractography (gray matter to gray matter connections), and assignment to edges in a connection matrix defined by the Destrieux atlas resulting in a potential 164x164 short association bundles. An empirical decision was made to select only those bundles that are reproducible across 90% of the studied population, resulting in 58 U-fiber bundles studied. These bundles were filtered to remove streamlines that were not U-shaped using the scilpy toolbox, and further filtered to remove outlier streamlines.
Feature extraction
From the final 58 bundles for each subject, 6 features were extracted including four DTI microstructural measures of fractional anisotropy (FA), and mean, radial, and axial diffusivities (MD, RD, AD) and two macrostructural measures of length and volume, following the procedures in [7].
Modeling
To investigate the relationship between age and each WM feature, linear mixed effects modeling was performed, with each feature, Y, modeled as a linear function of age, y=β0+β1*Age+β2*Sex+β3*TICV+β4*(SUB) ,where subjects (SUB) were entered as a random effect (i.e., subject-specific random intercept), and subject sex (Sex) and total intra-cranial volume at baseline scan (TICV) as fixed effects. All results are presented as a percent change per year, derived from the slope normalized by the average value across the aging population (from 50-97), and multiplied by 100, which represents the percent change in feature per year. These measures are derived for each pathway and each feature.
Results
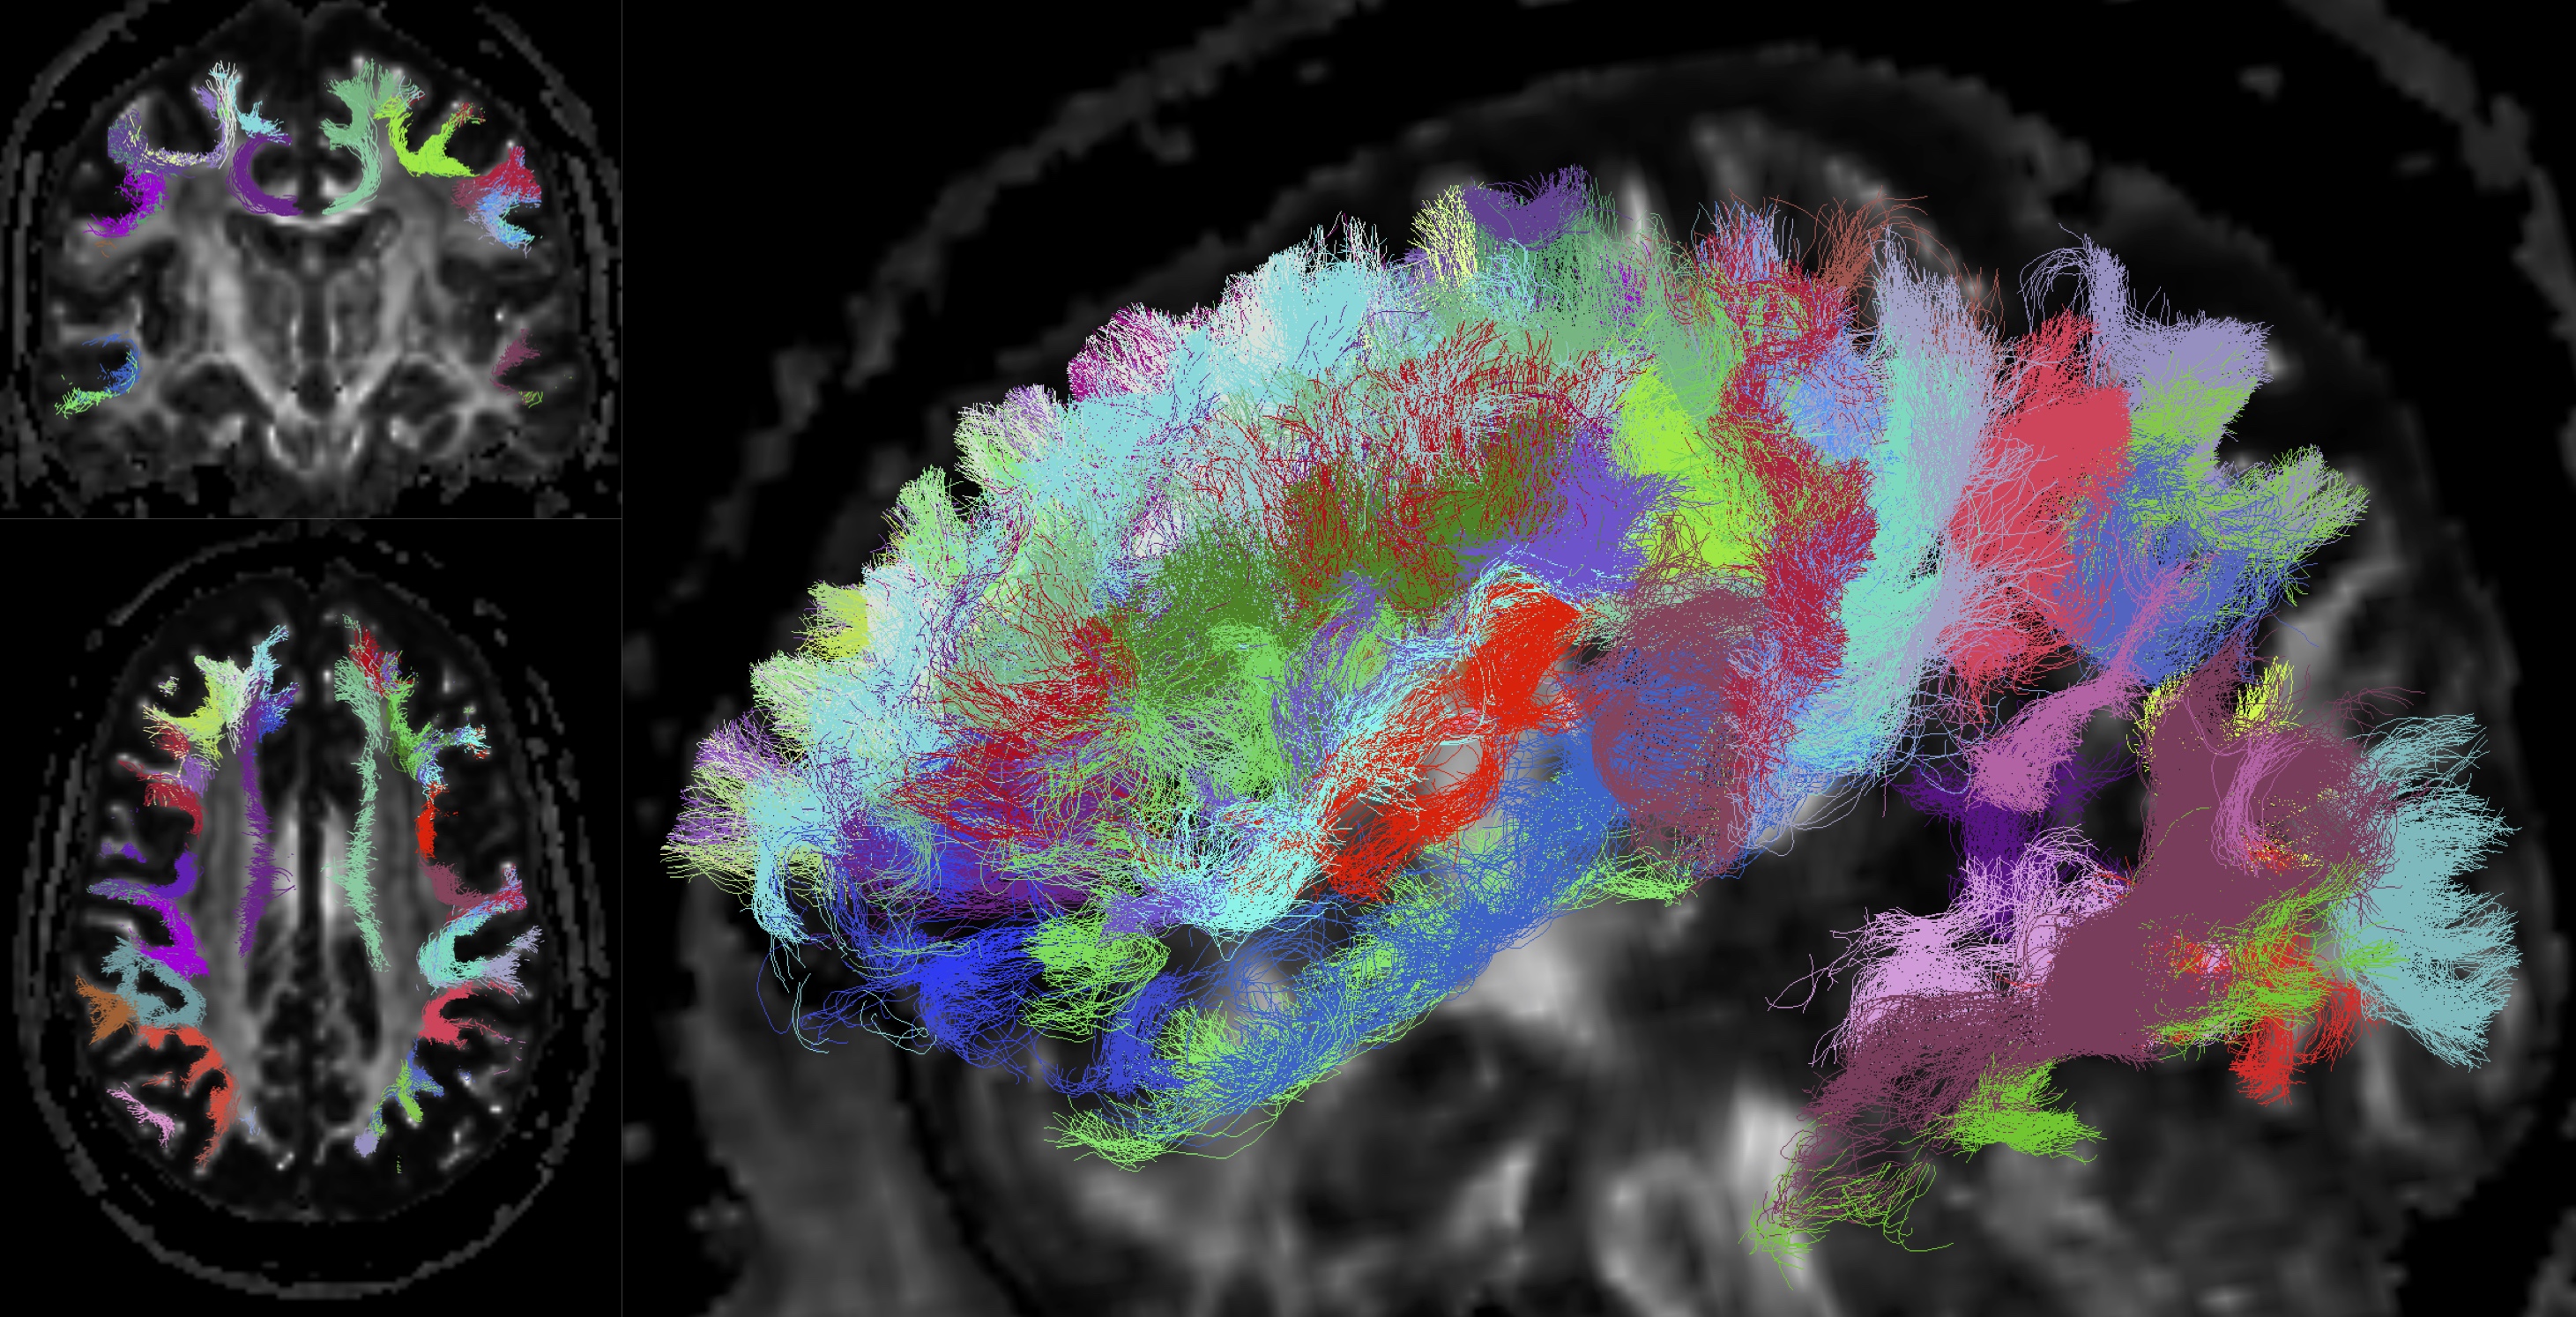
U-fiber systemsExample U-fiber systems that were consistently identified across the sample are shown in Figure 2 for a single example subject. In the coronal and sagittal slices, these fibers run immediately below and adjacent to the cortex in the expected locations and geometries. In the 3D visualization, U-fibers are represented along a majority of the gray matter surface. Notably, many U-fiber systems start and end within the same cortical label (which still meets our definition of superficial systems).
What changes and where?
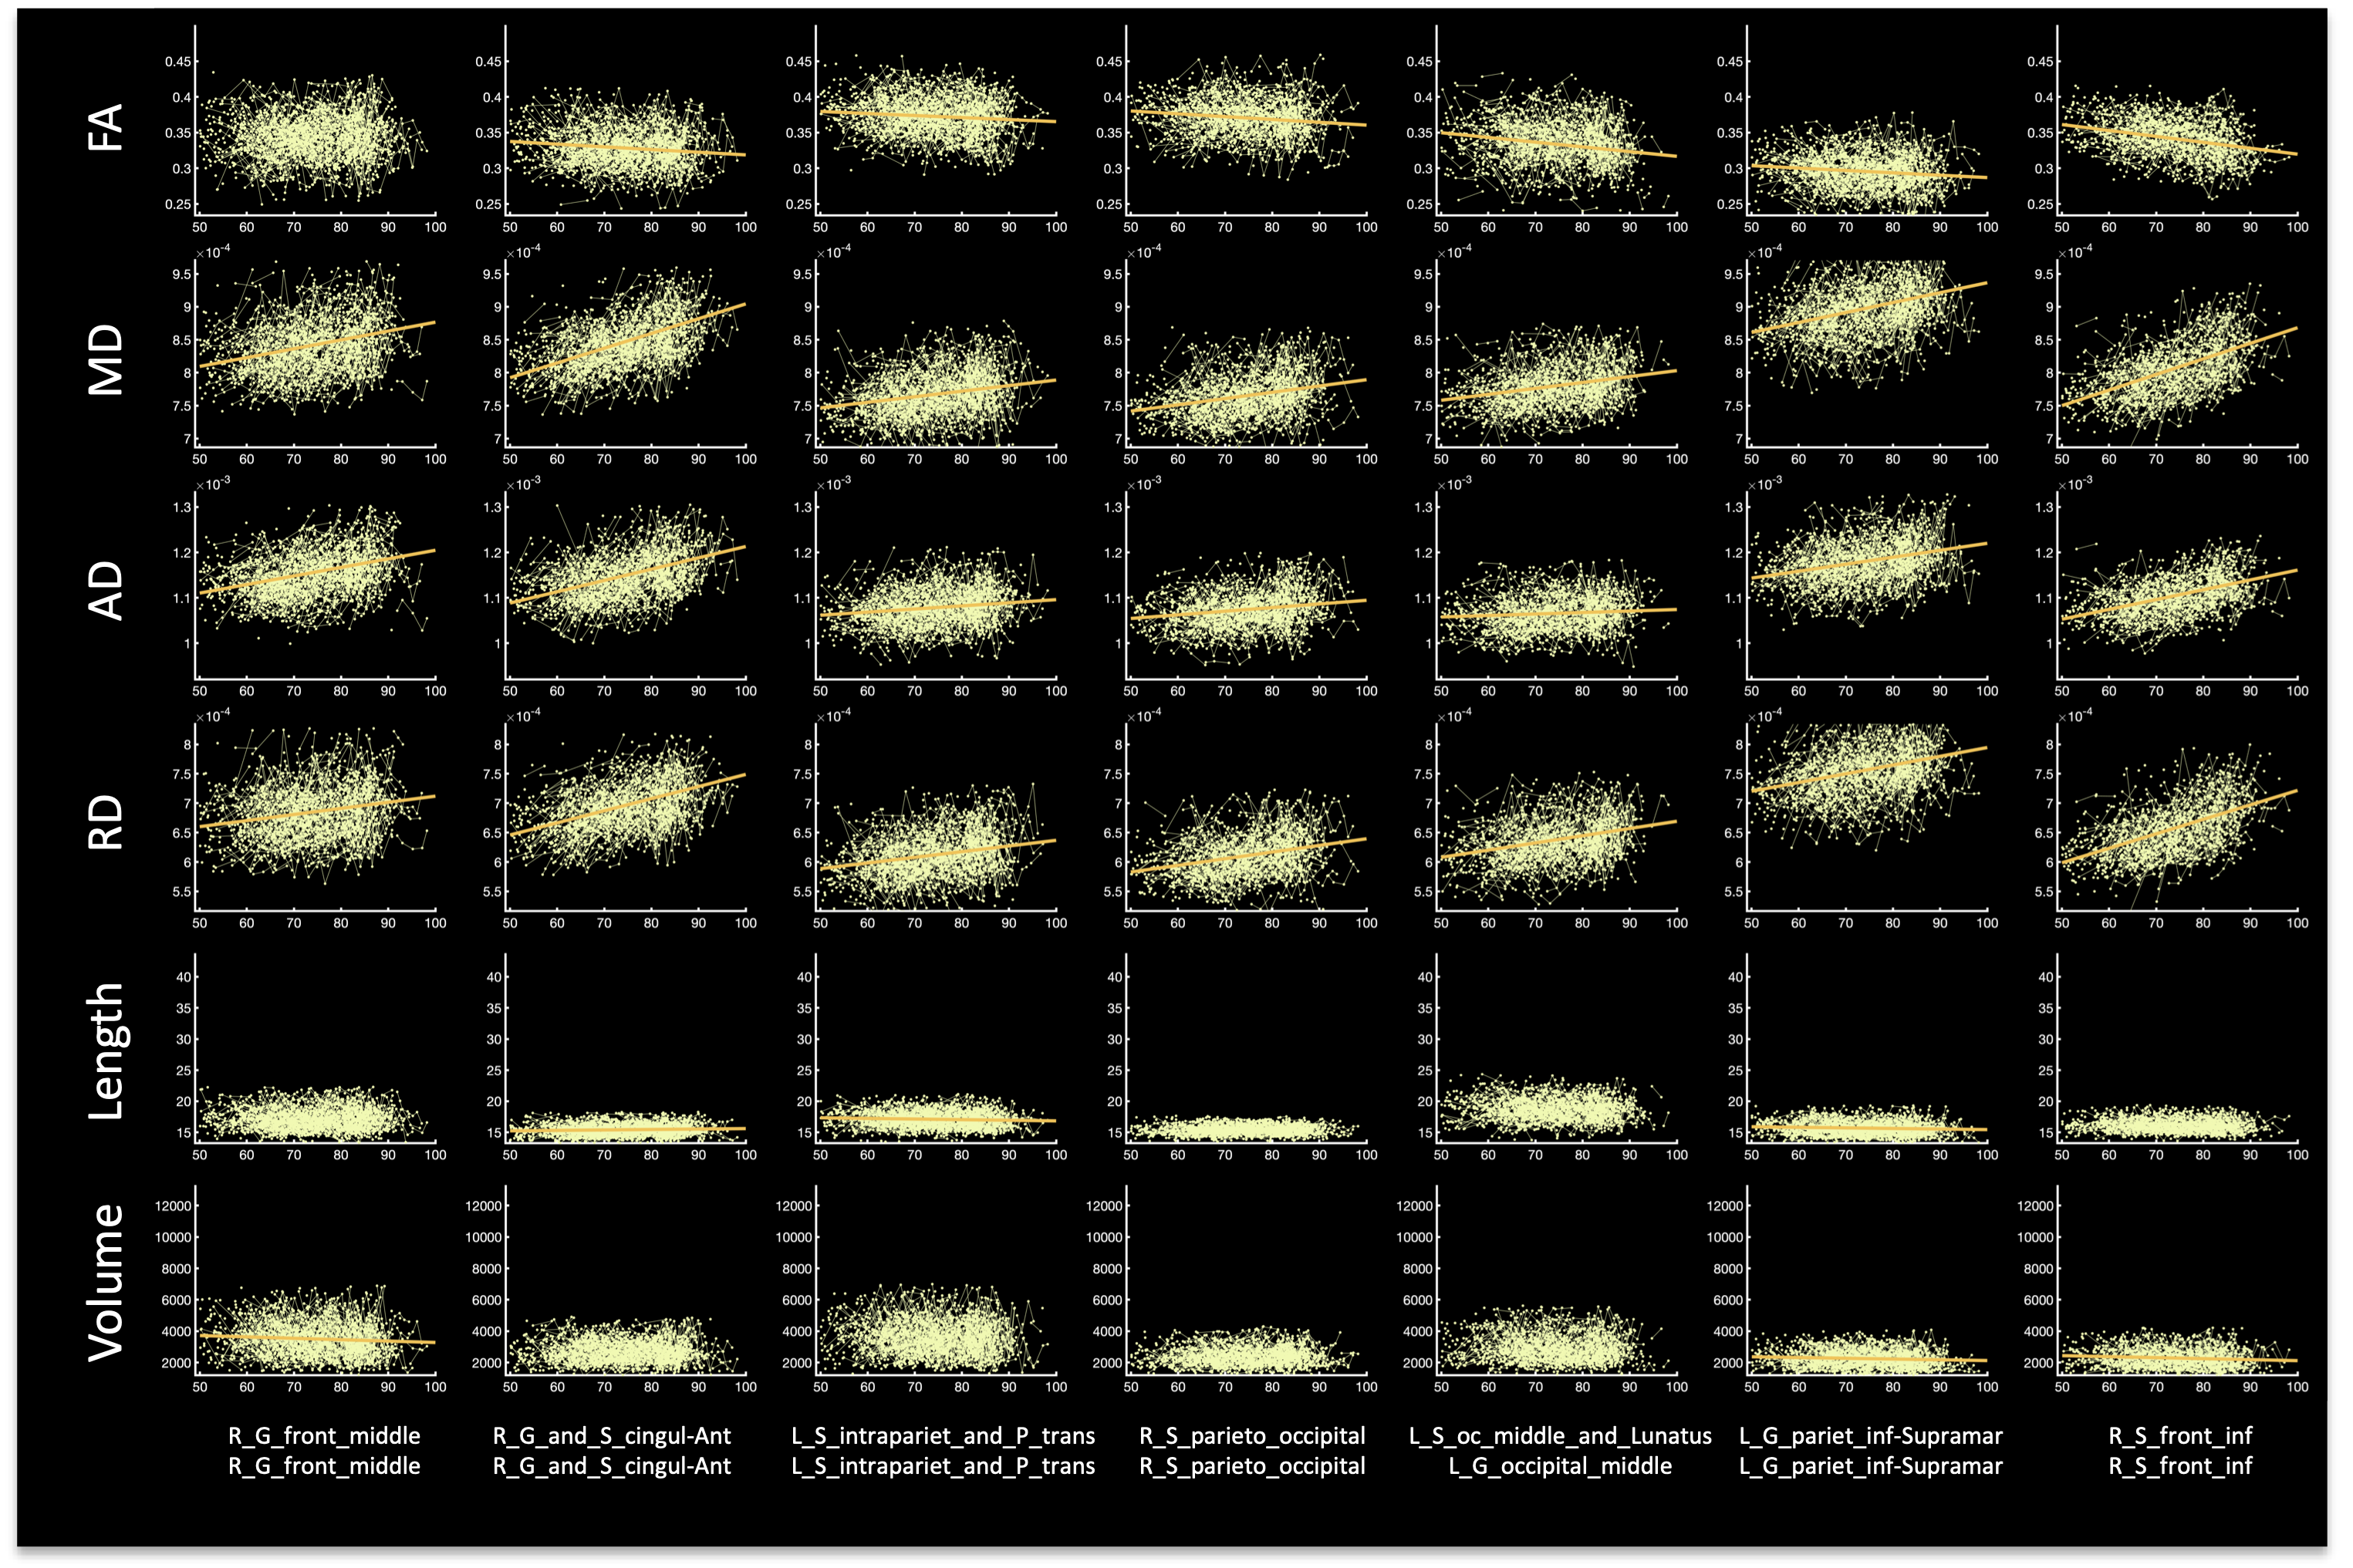
Figure 3 shows associations with age of all measures for 7 randomly selected pathways. In line with previous literature of long-range pathways, FA shows negative associations with age, while all diffusivities show positive associations with age. In general, the U-fiber length and volume tend to be lower at higher ages, even when accounting for TICV, although effects are not significant for all pathways.
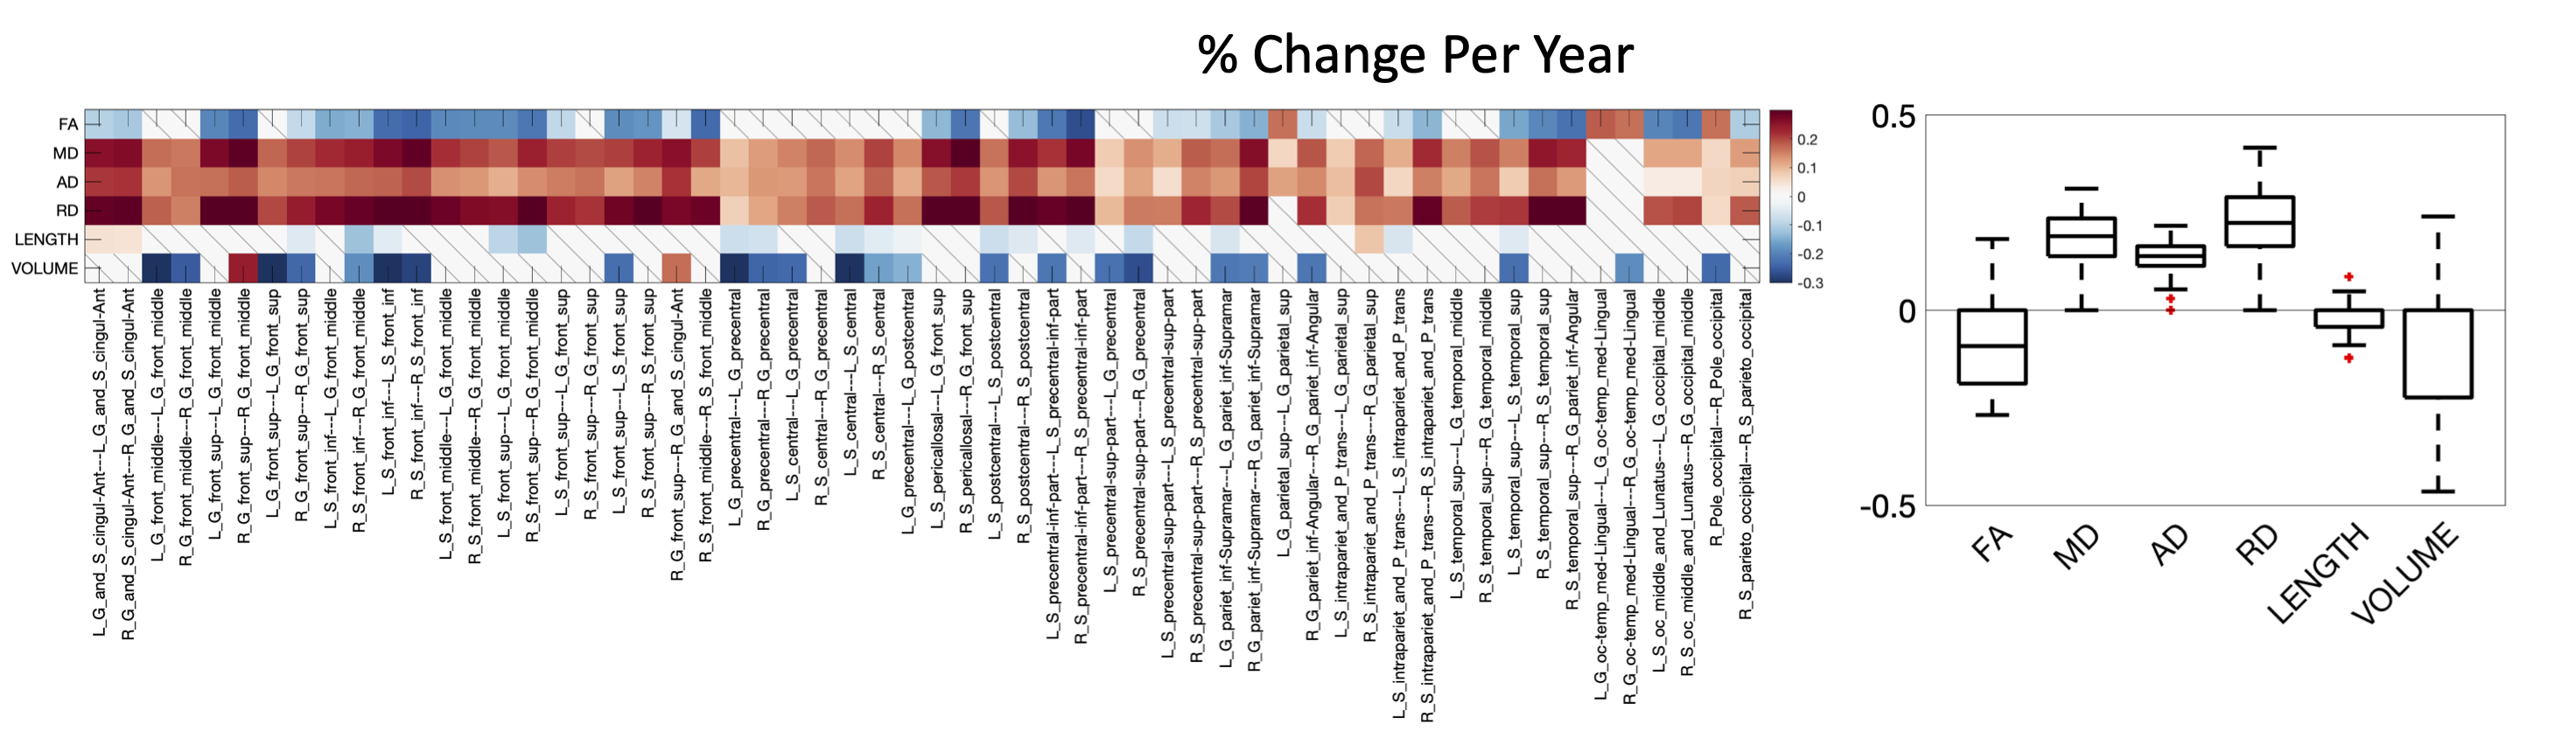
The % change per year is visualized for all feature and all pathways in Figure 4. Nearly all pathways show statistically significant changes in diffusivities with age of ~0.2% change per year, and many pathways show statistically significant decreases in volume of ~0.1-0.3% per year).
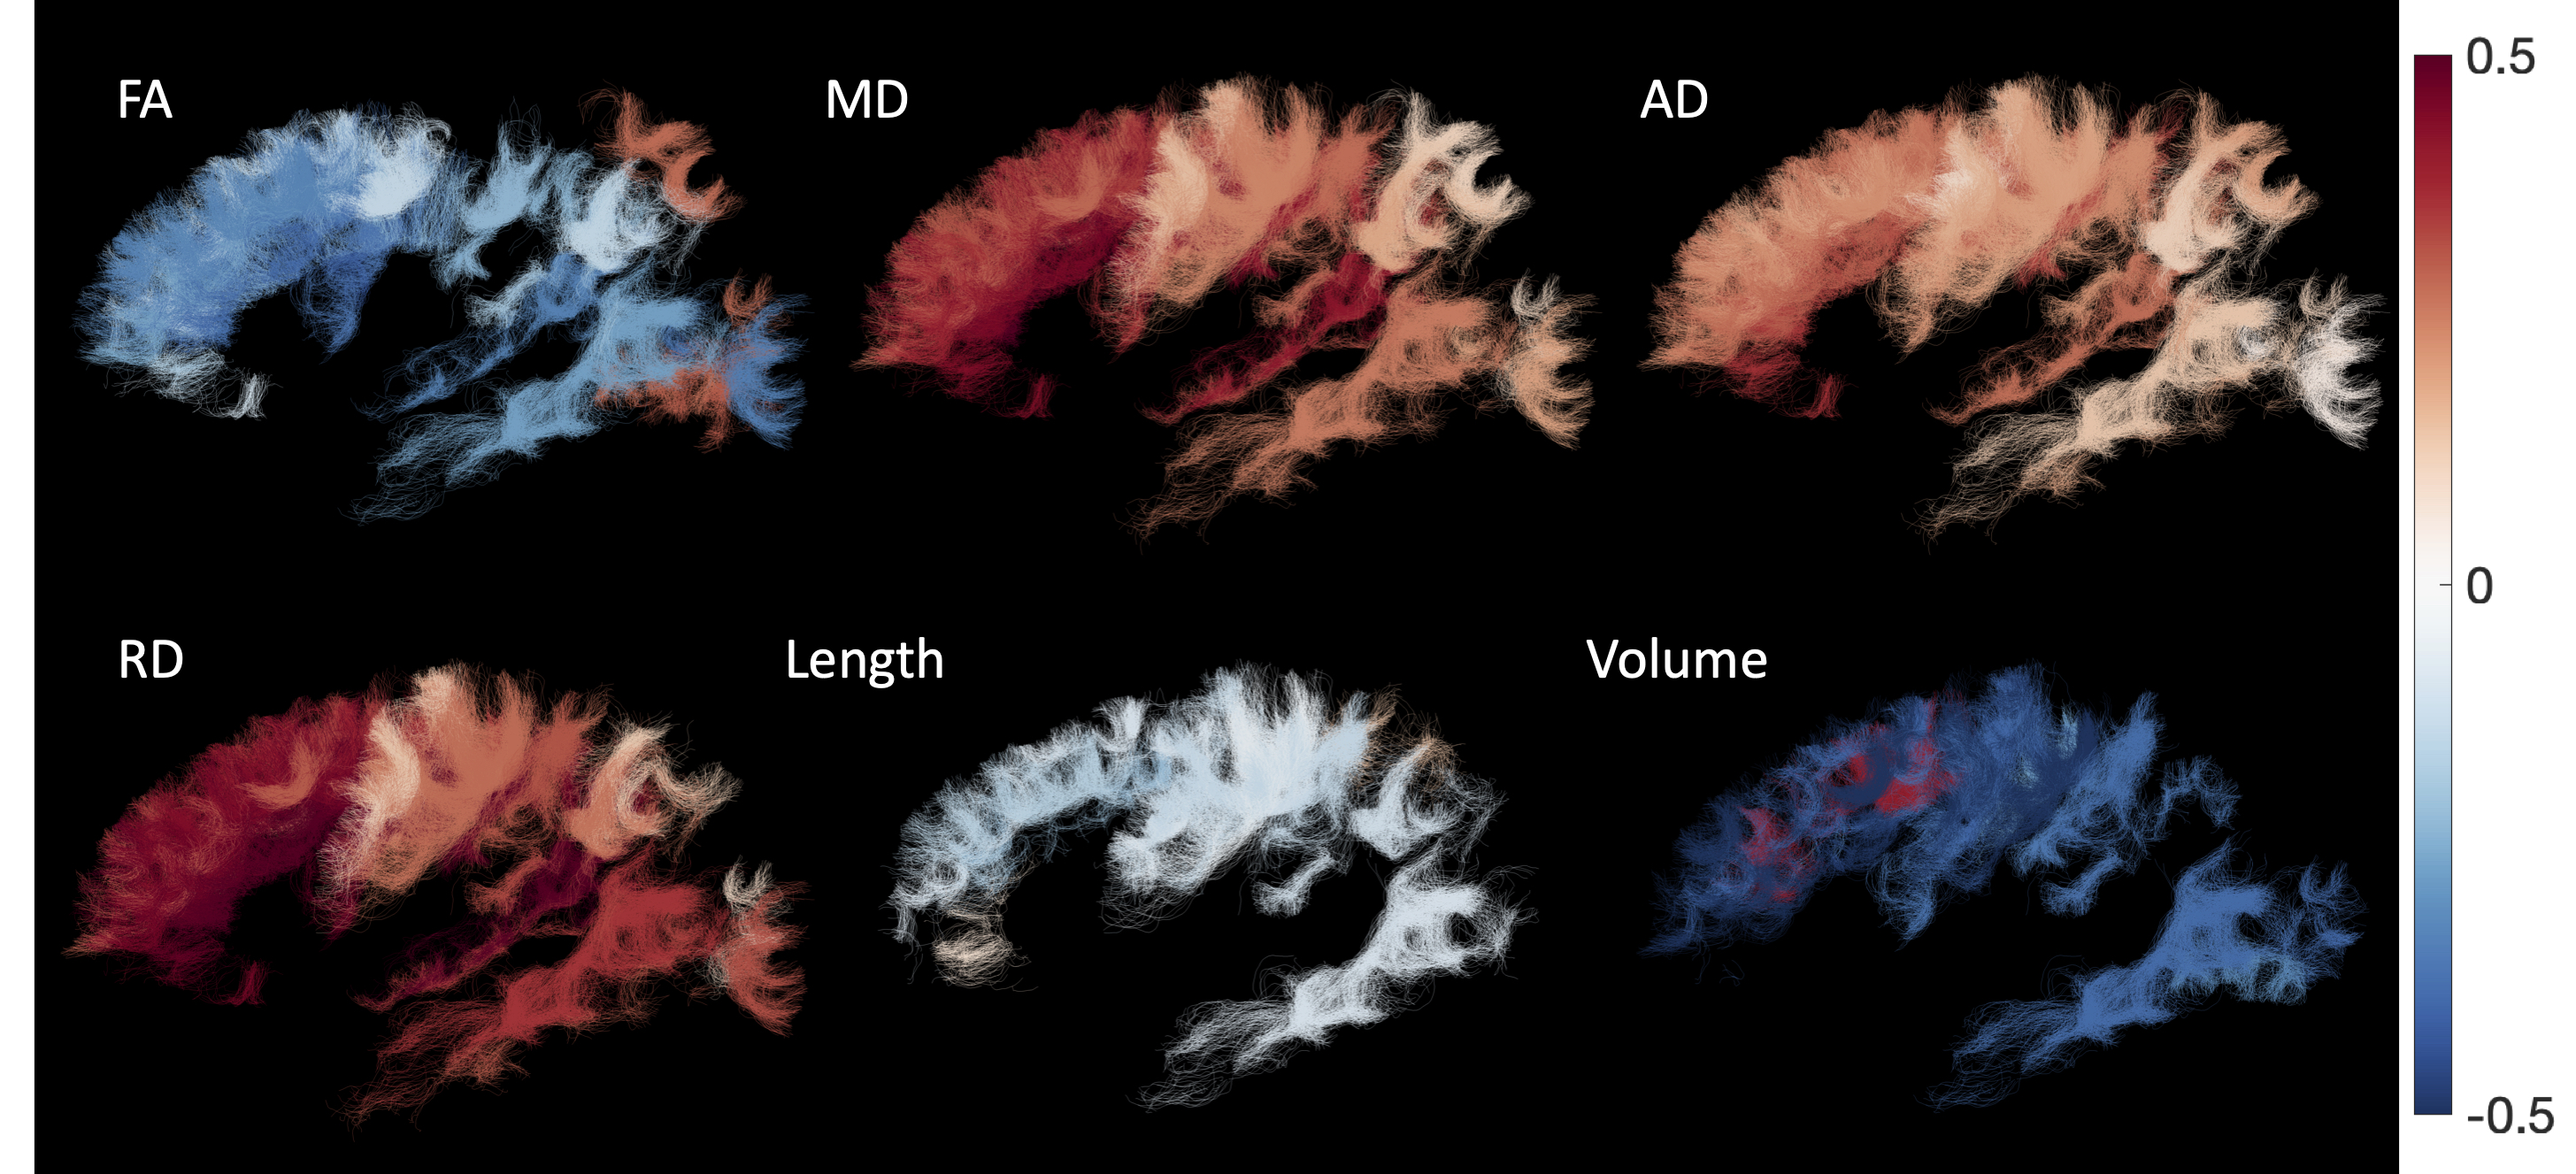
To understand where changes occur, we visualize all pathways, color-coded based on % change per year (Figure 5). Microstructural measures show greatest changes in frontal and temporal lobes, with minimal changes in superficial systems of the pre- and post-central gyri. Likewise, the greatest negative associations with age for length and volume are in the superficial fibers of the frontal lobe.
Discussion
Here, we have used a large, longitudinal dataset, and innovations in tractography generation and filtering, to characterize U-fiber systems in an aging cohort, describing microstructural features and for the first time, macrostructural features. We find robust associations with age for all features, across many fiber systems. These features, and their normal variations with age, may be useful for characterizing abnormal aging, and, in combination with larger association pathways and gray matter microstructural features, lead to insight into fundamental mechanisms associated with aging and cognition.Acknowledgements
This work was supported by the National Institutes of Health under award numbers R01EB017230, and in part by ViSE/VICTR VR3029 and the National Center for Research Resources, Grant UL1 RR024975-01. This research was conducted with support from the Intramural Research Program, National Institute on Aging, NIH. The content is solely the responsibility of the authors and does not necessarily represent the official views of the NIH.References
1. Schüz, A., V. Braitenberg, and R. Miller, The Human Cortical White Matter: Quantitative Aspects of Cortico-Cortical Long-Range Connectivity. Schüz, A.; Miller, R.: In: Cortical Areas: Unity and Diversity, 377-385 (2002), 2002.
2. Guevara, M., et al., Superficial white matter: A review on the dMRI analysis methods and applications. Neuroimage, 2020. 212: p. 116673.
3. Schilling, K., et al., Confirmation of a gyral bias in diffusion MRI fiber tractography. Hum Brain Mapp, 2018. 39(3): p. 1449-1466.
4. Shastin, D., et al., Short Association Fibre Tractography. bioRxiv, 2021: p. 2021.05.07.443084. 5. Phillips, O.R., et al., Superficial white matter: effects of age, sex, and hemisphere. Brain Connect, 2013. 3(2): p. 146-59.
6. Tournier, J.D., et al., MRtrix3: A fast, flexible and open software framework for medical image processing and visualisation. Neuroimage, 2019. 202: p. 116137.
7. Yeh, F.-C., Shape Analysis of the Human Association Pathways. bioRxiv, 2020: p. 2020.04.19.049544.
Figures