0516
Oscillating Gradient (OGSE) and Microscopic Anisotropy Diffusion in the in vivo and ex vivo Marmoset Brain1Western University, London, ON, Canada
Synopsis
We investigated OGSE and μFA diffusion techniques for the first time in the common marmoset (Callithrix jacchus) brain, which revealed comparable values to those found in humans. The same animal was scanned in vivo and after fixation of the brain, allowing comparison of in vivo and ex vivo OGSE and μFA parameters for the first time in marmosets. There were differences in kurtosis, μFA, and μA that may be caused by slight neurite beading and tissue shrinkage during perfusion/fixation, and temperature differences.
Introduction
Oscillating gradients spin-echo (OGSE) and microscopic fractional anisotropy (μFA) are promising techniques in diffusion MR that are able to provide further information in the tissue microstructure when compared to traditional diffusion MRI.The OGSE diffusion method allows for reduced effective diffusion times by using a sequence of short diffusion weighting periods, providing additional insight into pathological changes that affect tissue microstructural properties. It has been shown to be sensitive to axon structure1 and tissue changes in diseases such as acute ischemic stroke2, and tumor3.
μFA provides insight into brain microstructure and it is insensitive to neuronal fiber orientation and fiber crossing. For instance, it has shown potential to assess the disease progression in normal-appearing white matter for progressive forms of multiple sclerosis4, predictions of different types of tumor5, and is potentially more sensitive to Parkinson’s disease when compared to the conventional fractional anisotropy6.
In this study, we demonstrate μFA and the OGSE frequency dependence of apparent diffusion and kurtosis for the first time in marmoset brains. Further, the brain of the same animal was scanned both in-vivo and ex-vivo to enable assessment of the effect of fixation on these parameters for the first time.
Methods
Brain fixationOne adult female marmoset (Callithrix jacchus) was perfused with 0.1M sodium cacodylate and Heparin 10,000U/ml (200-300ml) followed by 2% Paraformaldehyde and 2.5% Glutaraldehyde (300ml). The brain was harvested and transferred to 0.1M sodium cacodylate with 0.03% NaN3 after 96 hours, following the methods described elsewhere7.
Image acquisition
The in-vivo images were acquired in the anesthetized animal using an 8-channel receive coil with a built-in birdcage transmit coil and customized 300mT/m 15cm gradient coils in a 9.4T Bruker system. ex-vivo images used a 40 mm quadrature birdcage transceiver (Agilent) and a 1000mT/s gradient insert. The samples were submerged in Christo‐Lube and scanned at room temperature.
OGSE
In-vivo images were acquired with the following parameters: single-shot spin-echo EPI, TE/TR=54/17000ms, acceleration factor = 2, frequencies(directions) = 0(9)/30(9)/57(6)/85(4) Hz, bvalues = 1000 and 2000 s/mm2, resolution = 0.6mm isotropic, total acquisition time = 65min. Repetitions were used so that the total number of scans were balanced among the frequencies. ex-vivo images were acquired with 3-segment spin-echo EPI with TE/TR=51/25000ms, acceleration factor = 1 , frequencies = 0/33/55/81 Hz, bvalues 2000 and 4000 s/mm2, 9 directions, 6 and 3 repetitions in the higher and lower shells respectively, resolution = 0.4mm isotropic, total acquisition time = 7:30h.
μFA
In-vivo images were acquired with single shot spin echo EPI, TE/TR=42.65/6800ms, acceleration factor = 2, resolution = 0.5x0.5x0.6mm3, total acquisition time = 63min, 3 shells, max bvalue = 2000s/mm2. ex-vivo images were acquired with 3-shot spin echo EPI with TE/TR = 35/18000ms, acceleration factor = 1, resolution = 0.3x0.3x0.4mm3, total acquisition time = 4:40h, 3 shells, max bvalue = 4000s/mm2.
Processing
The images were denoised (PCA), Gibbs removal, motion/distortion/eddy current-corrected using MRtrix3 and FSL. kurtosis and ADC from the OGSE sequences and kurtosis, ADC, μFA, and μA (unnormalized microscopic anisotropy) were calculated using non-negative linear least squares using Matlab8. FA maps were calculated using the MRtrix3 package9. To avoid partial volume artifacts that may vary for the different resolutions ex vivo versus in vivo, ROIs were chosen in large regions with homogeneous tissue contrast.
Results
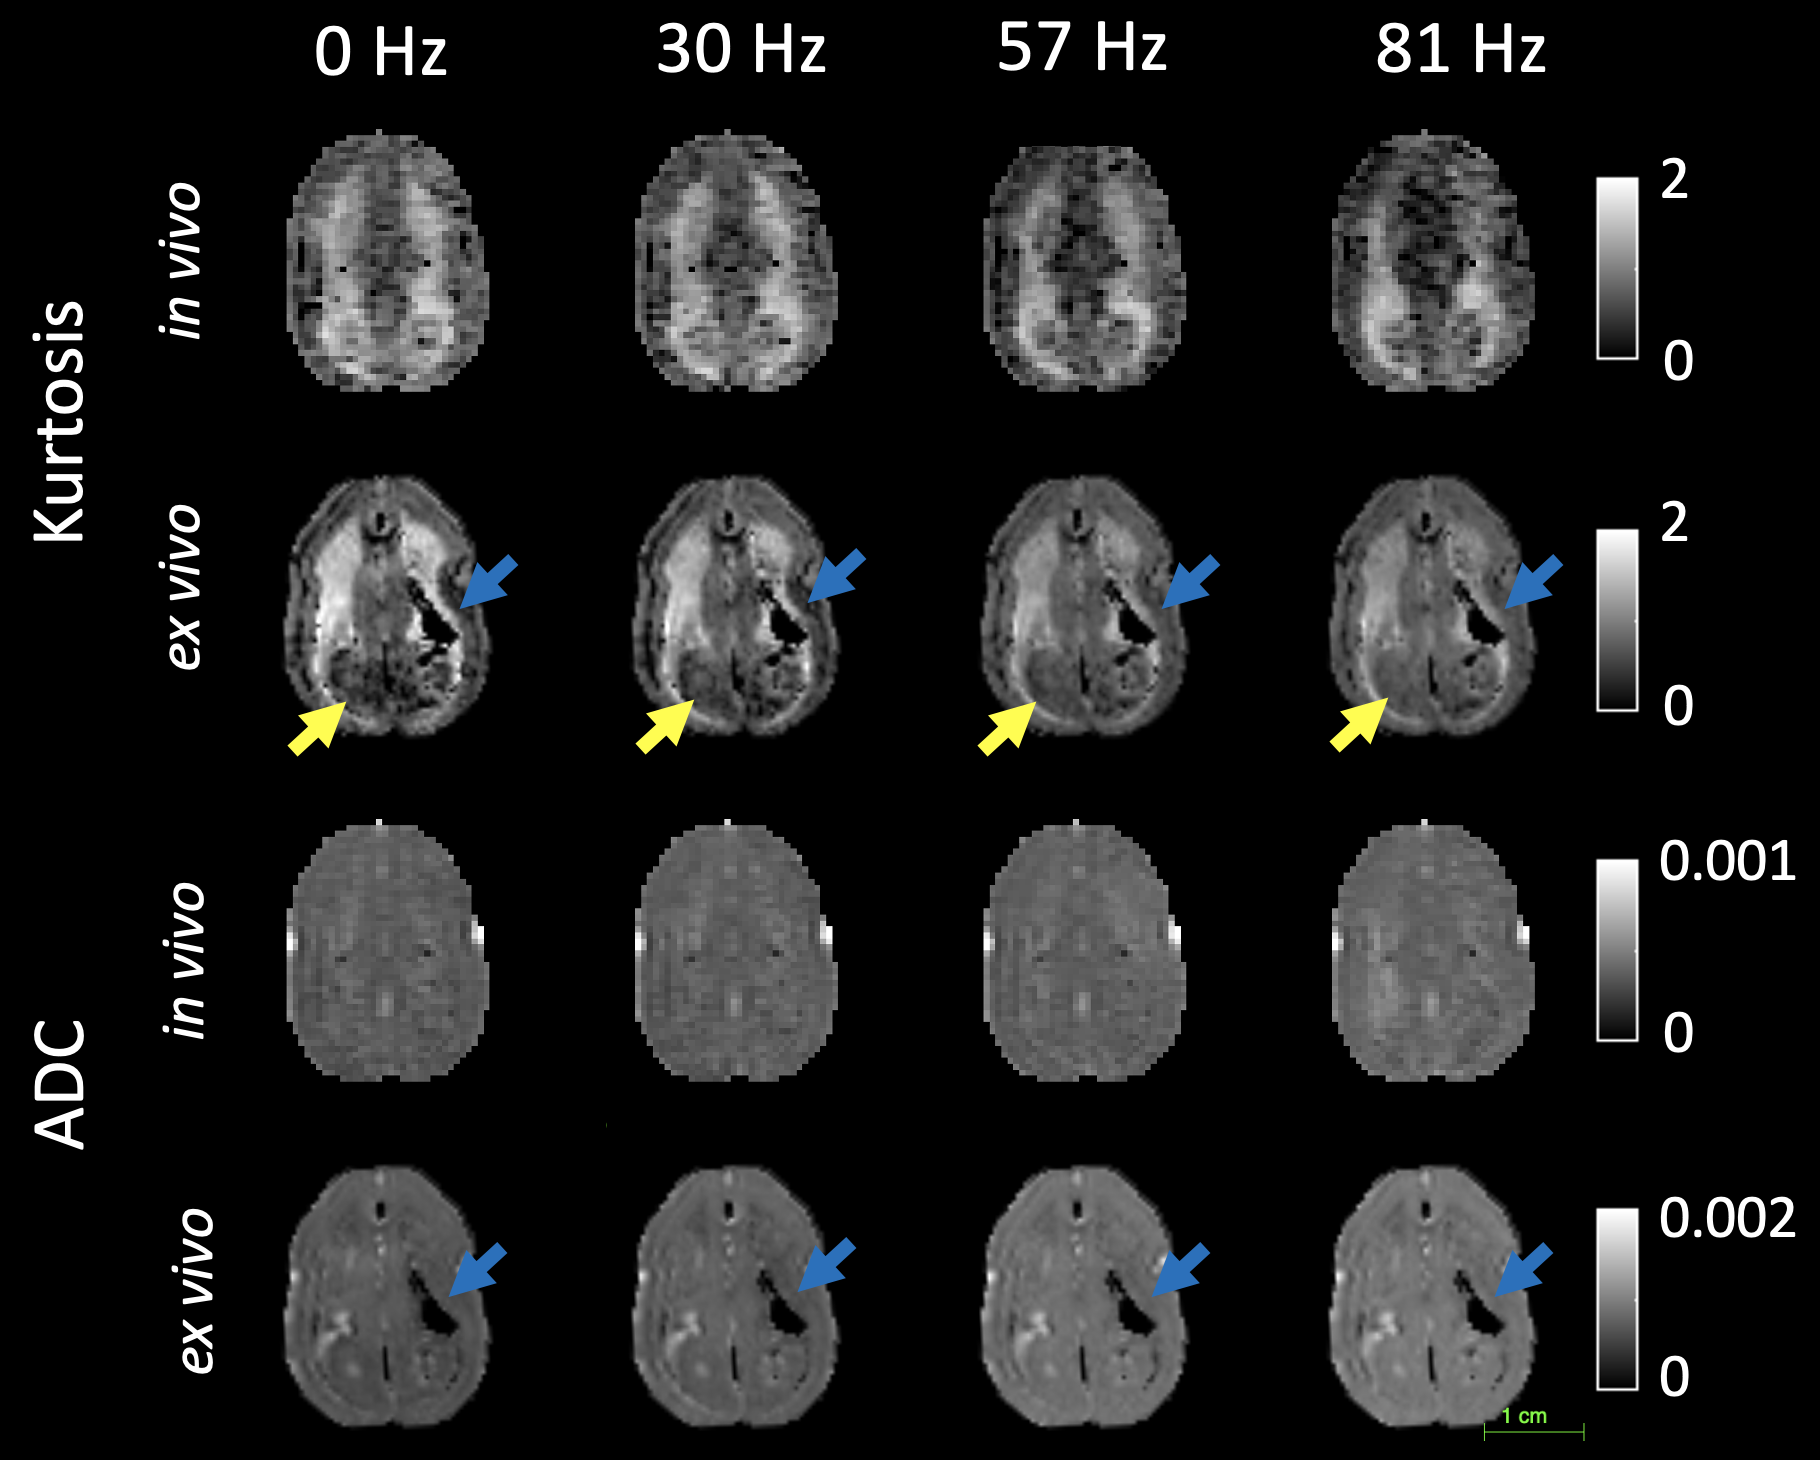
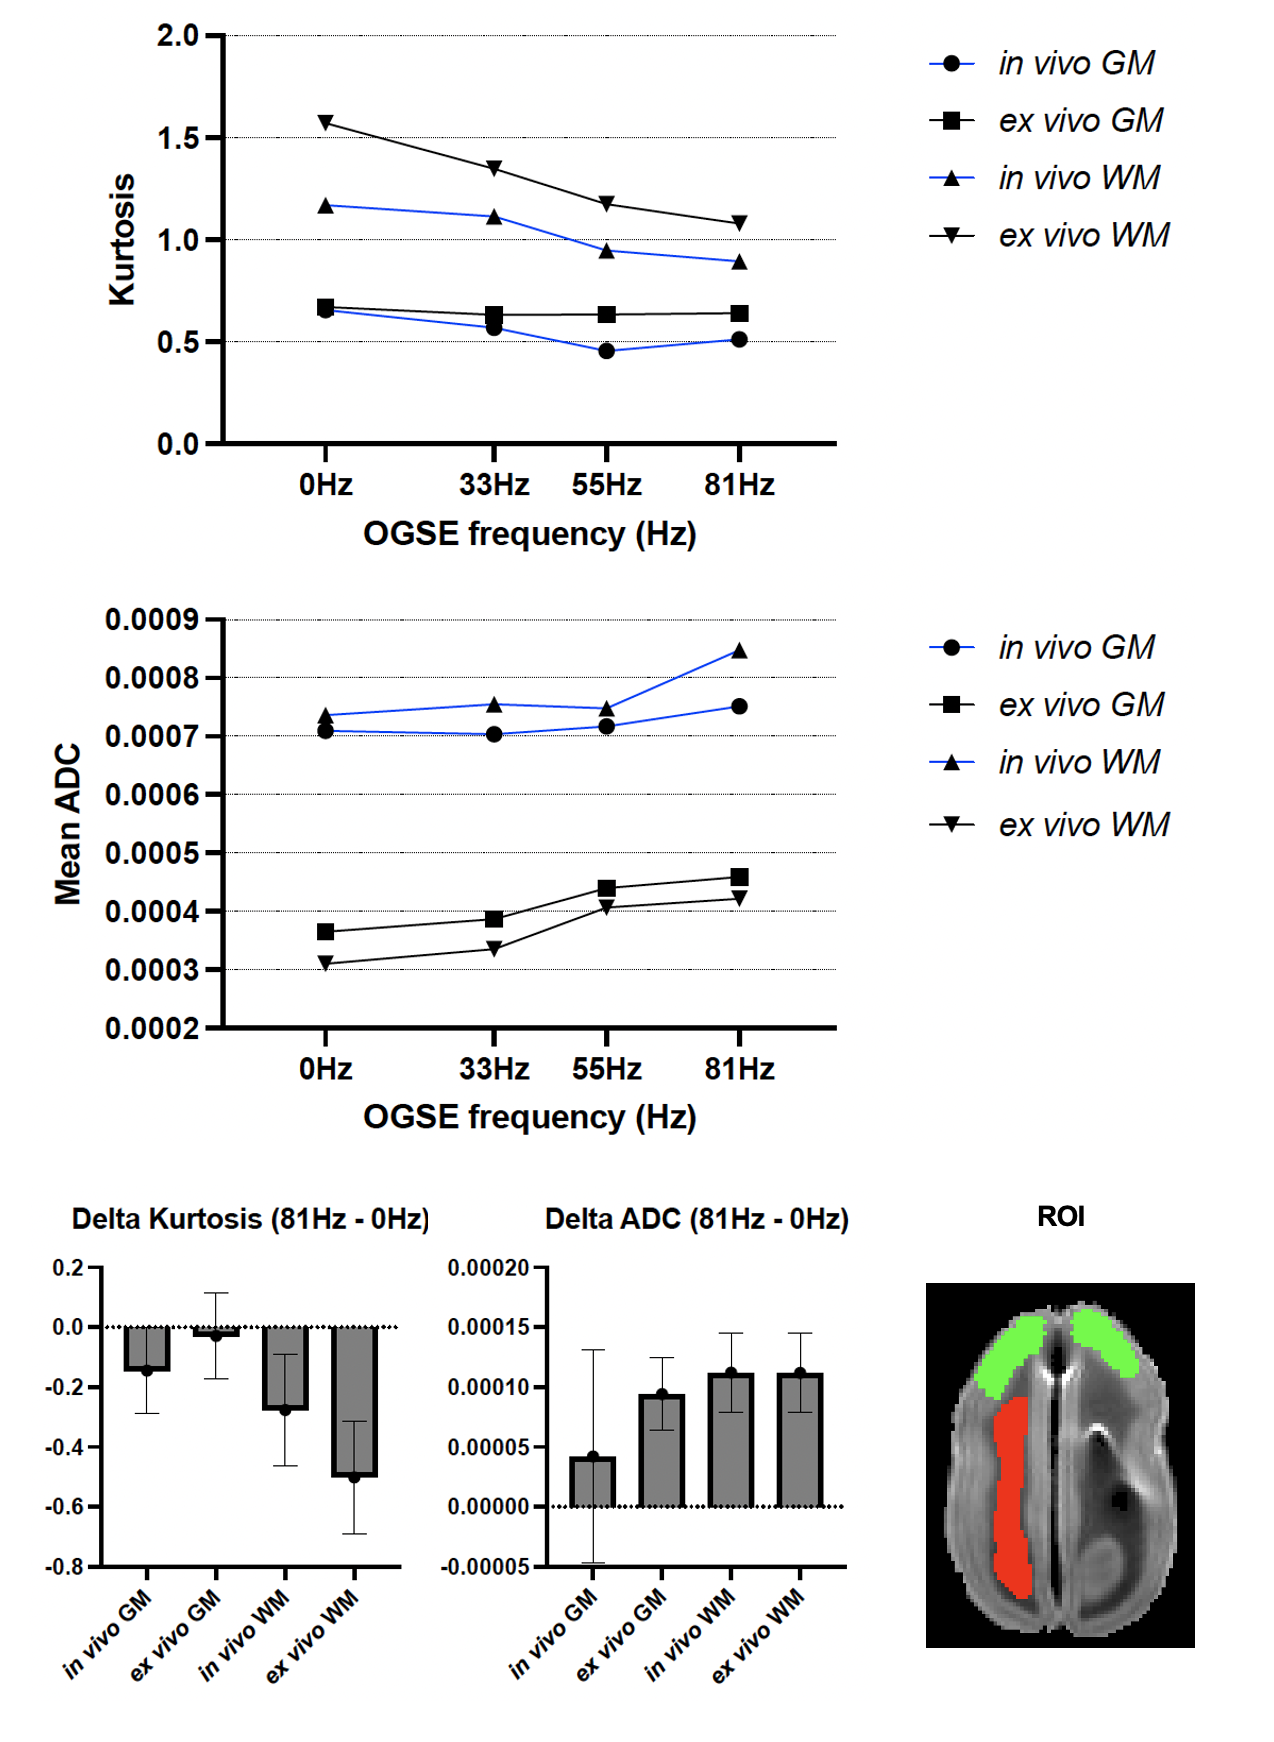
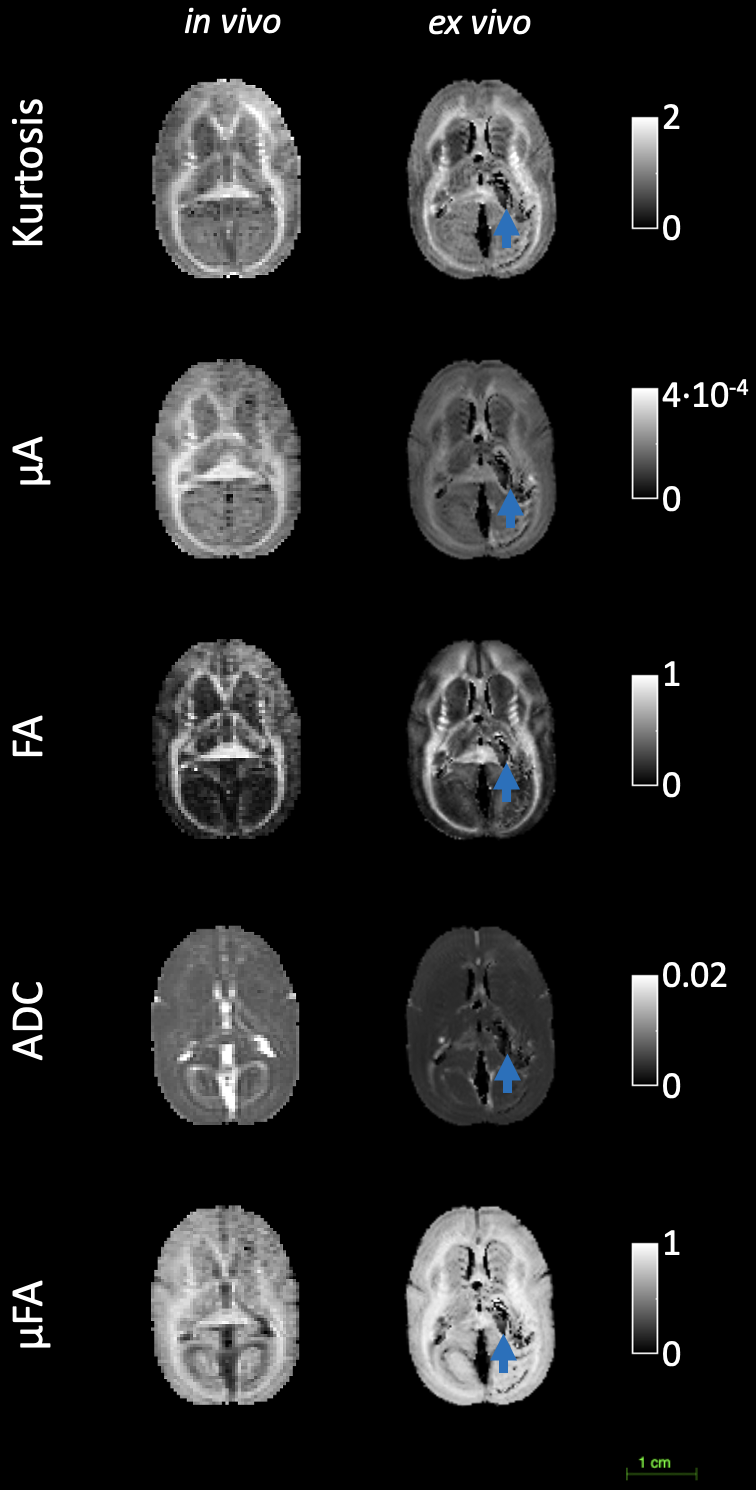
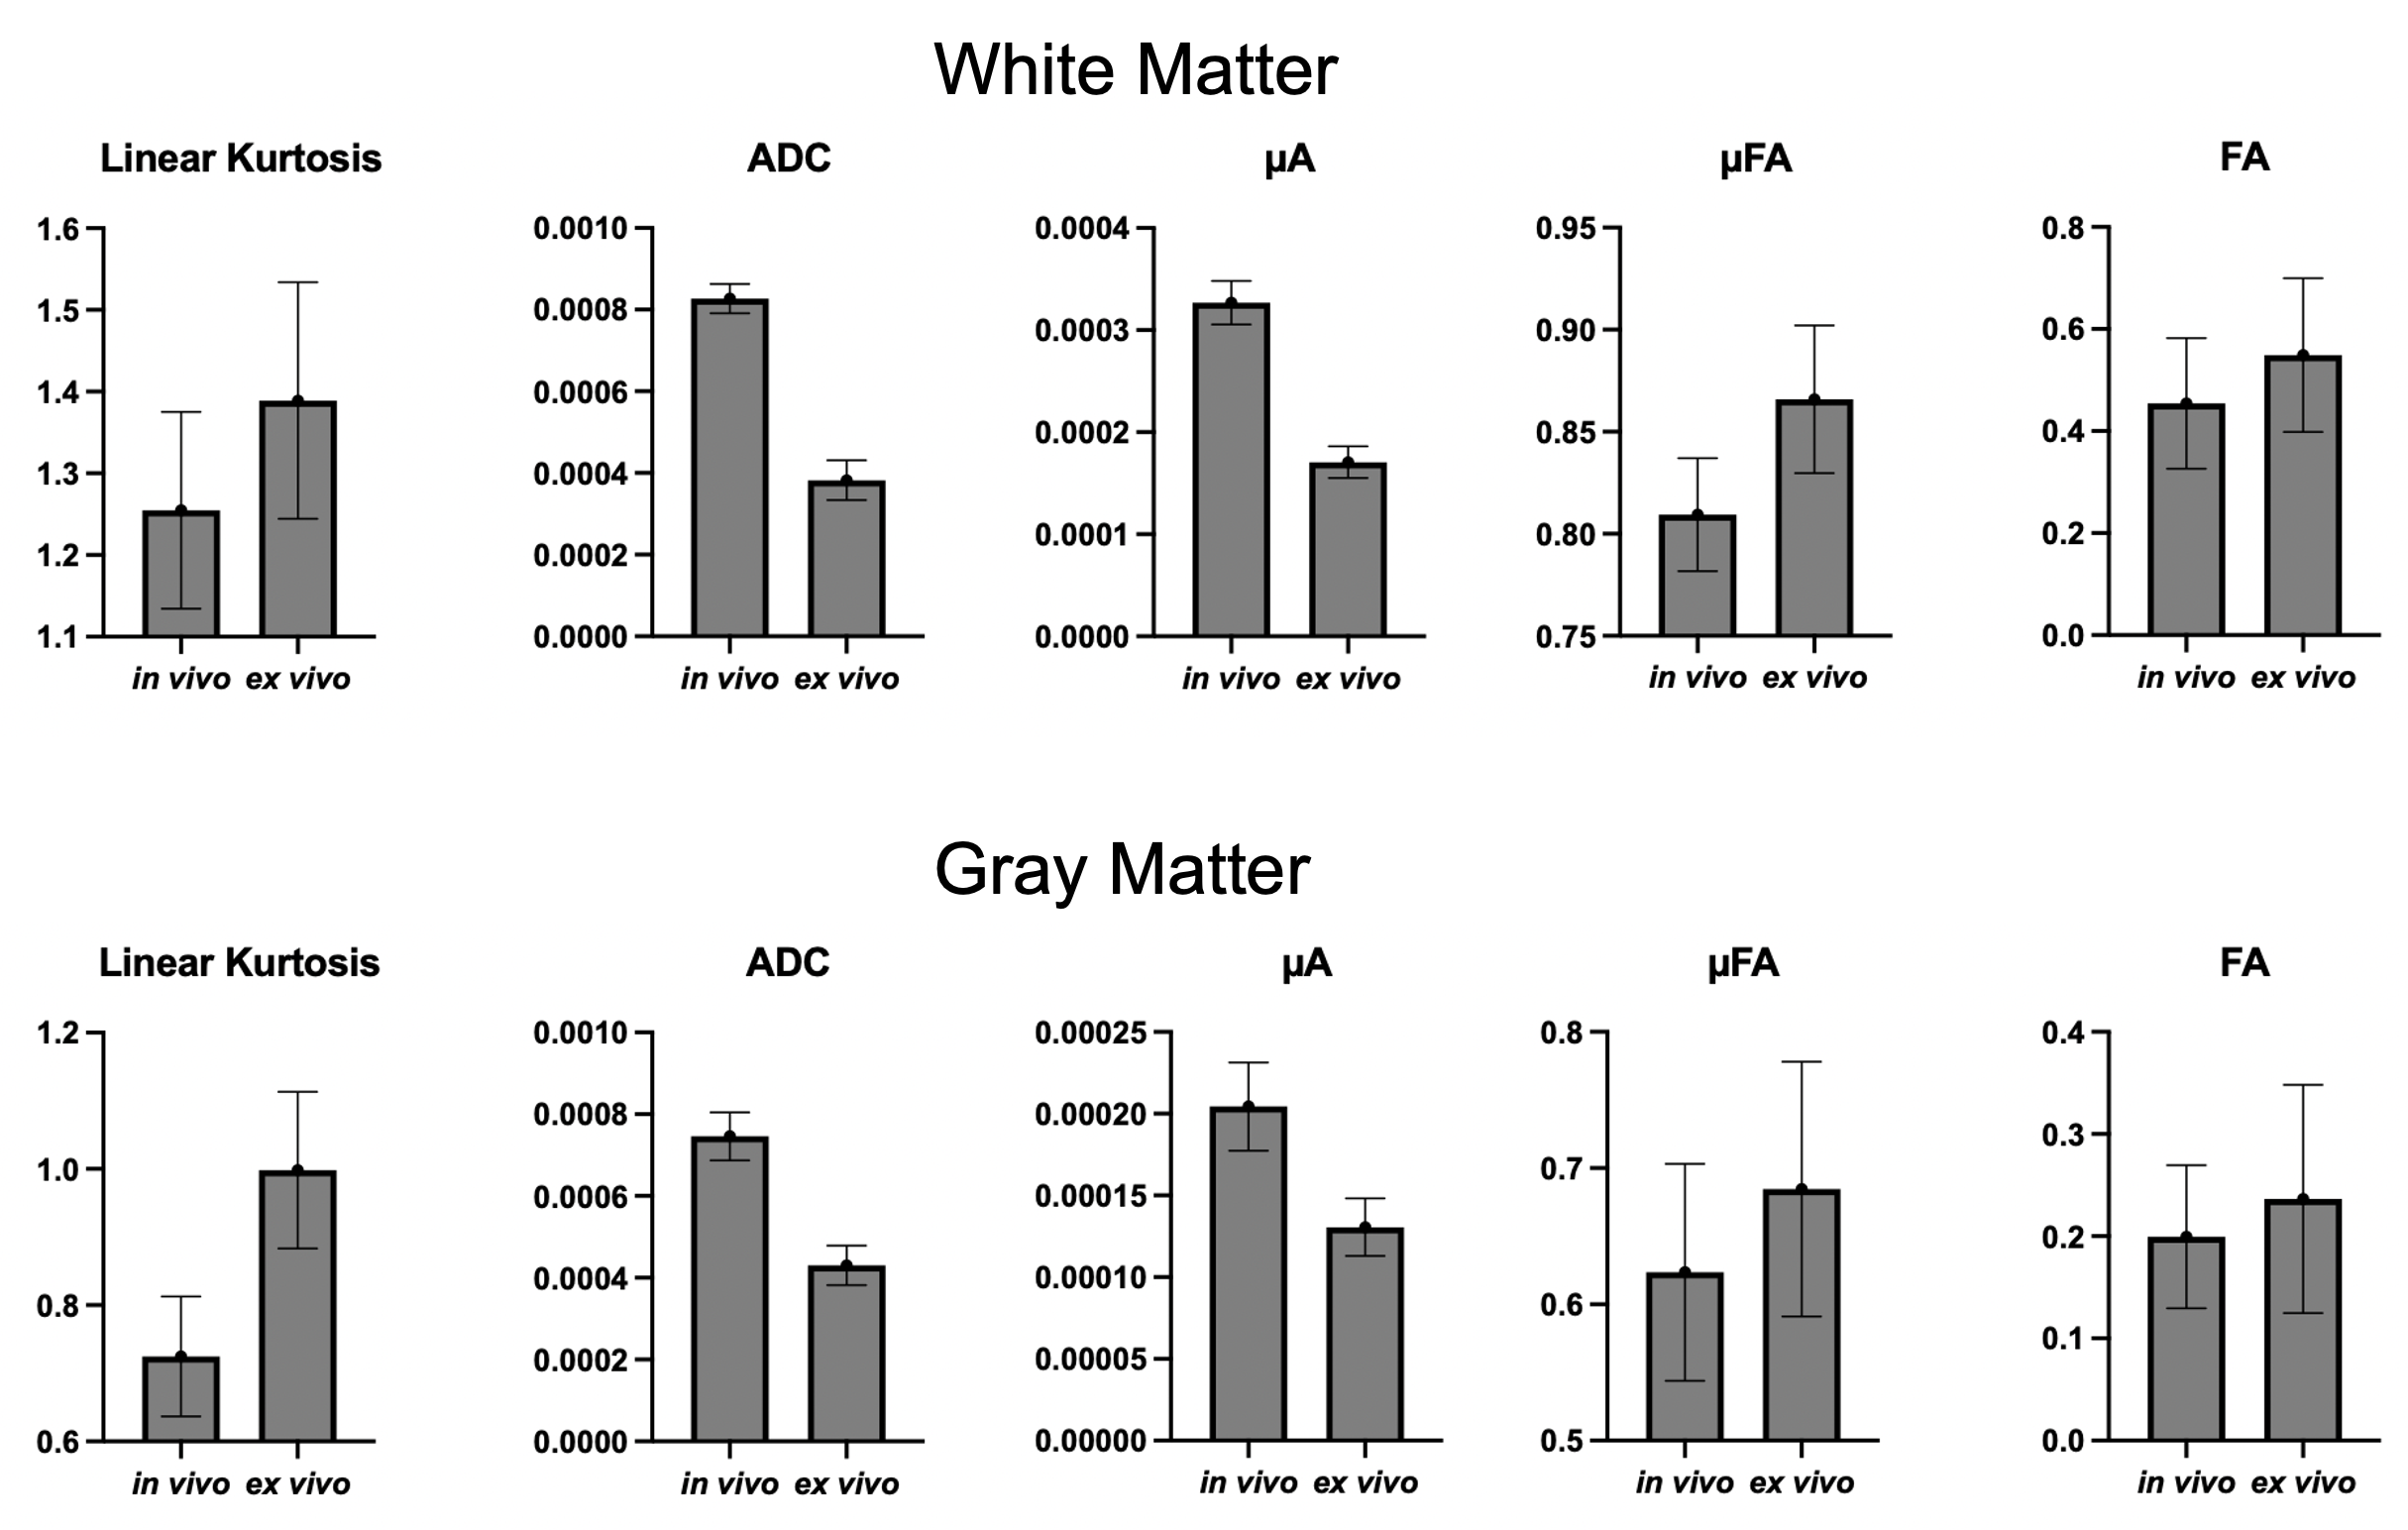
Figure 1 shows the kurtosis and ADC for the 4 OGSE frequencies, for both in-vivo and ex-vivo. Figure 2 shows the mean kurtosis and ADC in cerebral white matter (WM) and cortical gray matter (GM). Figure 3 shows a comparison of the μFA derived metrics while Figure 4 provides a detailed comparison of the values of the metrics in the GM and WM.Discussion
Overall, there were larger changes in kurtosis and ADC with respect to frequency for ex-vivo compared to in-vivo. A possible explanation is slight neurite beading2,10 being induced by the fixation process or changes in exchange11, which could perhaps be elucidated via microstructural modeling. The ADC values are almost 2x higher in-vivo, which is likely mostly related to temperature differences in the acquisitions; however, beading would also be expected to contribute to a reduced ADC.Both linear kurtosis and μFA showed a reduced value in-vivo while the FA values were similar. The large difference between in-vivo and ex-vivo for μA is compatible with the large difference in ADC because a higher free water ADC will increase μA for the same microstructure. The increase in μFA for ex-vivo compared to in-vivo may be due to tissue shrinkage, but more investigation is warranted.
The in vivo values for kurtosis, ADC, and μFA are similar to those found in the human brain8,12, however, it may be possible there exist localized and/or small differences.
Conclusion
In this work, we presented the acquisition of advanced diffusion techniques for the first time in marmoset brains. Future studies will investigate the origin of the differences observed between in-vivo and ex-vivo and how these parameters are related to tissue structure and disease progression/recovery.Acknowledgements
The authors would like to acknowledge the Canada First Research Excellence Fund (BrainsCAN) and the Canada Research Chairs Program.References
1. Novikov, D. S., Jensen, J. H., Helpern, J. A. & Fieremans, E. Revealing mesoscopic structural universality with diffusion. Proc. Natl. Acad. Sci. 111, 5088–5093 (2014).
2. Baron, C. A. et al. Reduction of Diffusion-Weighted Imaging Contrast of Acute Ischemic Stroke at Short Diffusion Times. Stroke 46, 2136–2141 (2015).
3. Colvin, D. C. et al. New Insights into Tumor Microstructure Using Temporal Diffusion Spectroscopy. Cancer Res. 68, 5941–5947 (2008).
4. Andersen, K. W. et al. Disentangling white-matter damage from physiological fibre orientation dispersion in multiple sclerosis. Brain Commun. 2, (2020).
5. Szczepankiewicz, F. et al. Quantification of microscopic diffusion anisotropy disentangles effects of orientation dispersion from microstructure: Applications in healthy volunteers and in brain tumors. NeuroImage 104, 241–252 (2015).
6. Ikenouchi, Y. et al. Evaluation of white matter microstructure in patients with Parkinson’s disease using microscopic fractional anisotropy. Neuroradiology 62, 197–203 (2020).
7. Foxley, S. et al. Multi-modal imaging of a single mouse brain over five orders of magnitude of resolution. NeuroImage 238, 118250 (2021).
8. Arezza, N. J. J., Tse, D. H. Y. & Baron, C. A. Rapid microscopic fractional anisotropy imaging via an optimized linear regression formulation. Magn. Reson. Imaging 80, 132–143 (2021).
9. Tournier, J.-D. et al. MRtrix3: A fast, flexible and open software framework for medical image processing and visualisation. NeuroImage 202, 116137 (2019).
10. Budde, M. D. & Frank, J. A. Neurite beading is sufficient to decrease the apparent diffusion coefficient after ischemic stroke. Proc. Natl. Acad. Sci. 107, 14472–14477 (2010).
11. Aggarwal, M., Smith, M. D. & Calabresi, P. A. Diffusion-time dependence of diffusional kurtosis in the mouse brain. Magn. Reson. Med. 84, 1564–1578 (2020).
12. Borsos, K. B., Tse, D. H. Y., Dubovan, P. I. & Baron, C. A. Frequency tuned bipolar oscillating gradients for mapping diffusion kurtosis dispersion in the human brain. ArXiv210914027 Phys. (2021).
Figures