0515
Correlation Tensor MRI reveals dynamic changes in diffusion kurtosis sources along stroke progression1Champalimaud Research, Champalimaud Centre for the Unknown, Lisbon, Portugal, 2Center of Functionally Integrative Neuroscience (CFIN) and MINDLab, Department of Clinical Medicine, Aarhus University, Aarhus, Denmark, 3Department of Physics and Astronomy, Aarhus University, Aarhus, Portugal
Synopsis
Correlation Tensor Imaging is emerging as a novel methodology for resolving diffusional kurtosis sources. Here, we decouple the anisotropic (Kaniso), isotropic (Kiso), and microscopic kurtosis (μK) sources and map them along the progression of experimental ischemia. Our results indicate that μK and Kaniso, associated with cross sectional variance (tentatively associated with neurite beading) and Kiso, likely reflecting edema formation, are pivotal markers for pathology. Our findings are promising for more specific characterizations of stroke lesions and a better understanding of tissue injury.
Introduction
Stroke progression and outcome greatly vary across individuals, mainly due to the heterogeneity of the associated lesions1. Despite remarkable sensitivity towards severely damaged tissue, Diffusion Tensor Imaging (DTI) and Diffusion Kurtosis Imaging (DKI) are limited in specificity, and their metrics2,3 are difficult to interpret vis-à-vis beading, cytotoxic/vasogenic edema, core and penumbra4.Correlation tensor MRI (CTI)5 has been recently proposed to resolve kurtosis sources, thereby potentially enhancing specificity. CTI probes the Z and KT tensors6-10 (related to the diffusion variance tensor and the total kurtosis tensor, respectively), from which the anisotropic, isotropic, and microscopic kurtosis sources (Kiso, Kaniso and μK, respectively) can be resolved with minimal assumptions, including in stroke11. Here, we investigated how kurtosis sources progress from acute (3h) to chronic (3w) phases post stroke.
Methods
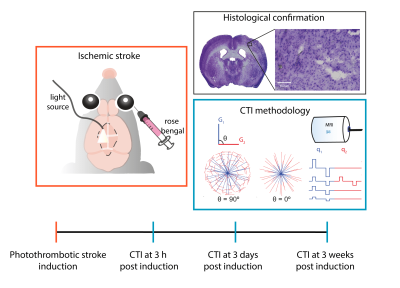
All animal experiments were preapproved by the competent national and international authorities and were carried out according to EU Directive 2010/63.Animal preparation: Adult male C57BL/6 mice (24.6 ± 2.4g) were used (N = 5). In the photothrombotic stroke model12 a focal infarct in S1bf13 is induced by injecting Rose Bengal dye (Sigma Aldrich, Portugal) (15 mg/ml) delivered intravenously (10 μl/g) followed by 15 min irradiation with a cold light source (without craniectomy, Fig. 1).
MRI experiments: Mice were scanned at 3h, 3d, and 3w post ischemic induction. The in-vivo diffusion data were acquired under anaesthesia (~2.5% isoflurane, 52% oxygen) on a pre-clinical 9.4 T Bruker Biospec scanner, equipped with a gradient system able to produce up to 660 mT/m isotropically. A DDE-EPI pulse sequence was used for CTI acquisitions, which consisted of 4 gradient pair combinations, repeated for 135 unique directions (Fig. 1) (total bmax of 1.4, 1.6, 2.8, and 3.2 ms/μm2, gradient pulse separation Δ = τm = 10 ms, δ = 4 ms)14. Other parameters included: TE/TR = 58/3000 ms, FOV = 16.6 × 16.6 mm2, in-plane resolution = 181 × 181 μm2, slice thickness = 0.85 mm, 2 averages, bandwidth = 250 kHz.
Data analysis: Raw complex diffusion data were phase unwrapped and denoised15, and aligned16. CTI metrics (mean diffusivity (MD), KT, μK, Kaniso, Kiso) were estimated pixelwise using linear-least squares fitting5. ROIs were manually defined, and interhemispheric percent changes were calculated. A Kruskal-Wallis analysis followed by a Dunn–Šidák post-hoc test (p-value < 0.05) was used for statistical analyses. Kurtosis source contribution was calculated from Kj/KT*100 where Kj corresponds to kurtosis from source j17.
Results
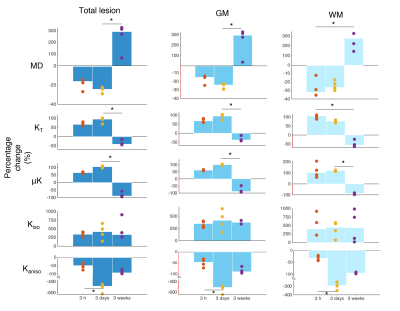
Fig. 2 shows the raw non-diffusion and diffusion-weighted powder-averaged CTI data for b-values from 1.4 to 3.2 ms/μm2, revealing an average SNR of 38±8 for the non-diffusion weighted and 3±2 for the highest b-value data (46±7 and 5±2 after denoising, respectively). Lesion progression is clearly observed in all diffusion weightings.MD and kurtosis sources in the acute, subacute, and chronic phases are shown in Fig. 3. MD pseudo-normalization in WM is observed in the 3d time point. KT and μK sharply increase in the first two timepoints, more in WM at 3h and more in GM at 3d post onset.
Quantification of interhemispheric ratios revealed that μK and KT were significantly different statistically between the subacute and chronic phases for GM; the Kaniso decreases were also statistically significant between the 3h timepoint and the 3d timepoint (Fig. 4).
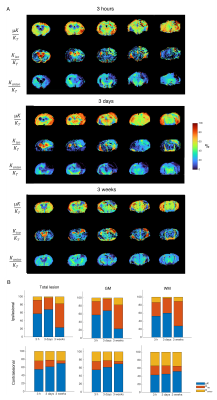
Source contribution maps (Fig. 5) revealed that μK is the dominant contributor to KT in the lesion in the acute and subacute phases, while Kiso dominates KT in the chronic time points.
Discussion
This study provides, to our knowledge, the first kurtosis source separation in stroke over the entire relevant time course (acute to chronic). Although many studies have mapped the time course of the diffusion tensor18-20 in stroke, only very few studies followed KT progression2,21,22. Our study provides an interesting observation of KT decreases at the chronic phase (which is plausible given that a cystic lesion can be expected to be quite homogeneous), but more importantly, reveals the sources contributing to KT in all stages. At 3h, the lesion KT increases are mainly driven by increased μK, tentatively linked with increased dendritic beading23 due to the associated increase in cross-sectional variance. At 3d, vasogenic edema24 and on-going inflammatory processes25,26 – and perhaps further beading – may be responsible for the striking Kaniso decreases and the further increases in μK and Kiso. Thus, the kurtosis sources provide enhanced specificity compared with MD/KT.Conclusion
CTI-driven kurtosis source separation shows great potential for resolving different mechanisms contributing to lesion heterogeneity in-vivo.Acknowledgements
This study was funded by the European Research Council (ERC) under the European Union’s Horizon 2020 research and innovation programme (Starting Grant, agreement No. 679058). We acknowledge the vivarium of the Champalimaud Centre for the Unknown, a facility of CONGENTO financed by Lisboa Regional Operational Programme (Lisboa 2020), project LISBOA01-0145-FEDER-022170. The authors also want to thank Ms. Renata Cruz for assistance in data acquisition.
References
1. Wheeler HM, et al. The growth rate of early DWI lesions is highly variable and associated with penumbral salvage and clinical outcomes following endovascular reperfusion. Int J Stroke, vol. 10, pp. 723-729, 2015.
2. Hui E S, et al. Stroke assessment with diffusional kurtosis imaging. Stroke, vol. 43, pp. 2968–2973, 2012.
3. Rudrapatna U, et al. Can diffusion kurtosis imaging improve the sensitivity and specificity of detecting microstructural alterations in brain tissue chronically after experimental stroke? Comparisons with diffusion tensor imaging and histology. NeuroImage, vol. 97, pp. 363-373, 2014.
4. Leigh R, et al. Imaging the physiological evolution of the ischemic penumbra in acute ischemic stroke. J Cerebr Blood Flow Metab, vol.38, pp. 1500-1516, 2018.
5. Henriques R N, Jespersen S N, Shemesh N. Correlation tensor magnetic resonance imaging. Neuroimage, vol. 211, 2020.
6. Jespersen S N, Buhl N. The displacement correlation tensor: Microstructure, ensemble anisotropy and curving fibers. Journal of Magnetic Resonance, vol. 208, pp. 34-43, 2011.
7. Jespersen S N. Equivalence of double and single wave vector diffusion contrast at low diffusion weighting. NMR in Biomedicine, vol. 25, pp. 813-818, 2011.
8. Jespersen S N, et al. Orientationally invariant metrics of apparent compartment eccentricity from double pulsed field gradient diffusion experiments. NMR in Biomedicine, vol. 26, pp. 1647-1662, 2013.
9. Jensen J H, Hui E S, Helpern J A. Double-pulsed diffusional kurtosis imaging. NMR in Biomedicine, vol. 27, pp. 363-370, 2014.
10. Hui E S, Jensen J H. Double-pulsed diffusional kurtosis imaging for the in vivo assessment of human brain microstructure. NeuroImage, vol. 120, pp. 371-381, 2015.
11. Alves R, et al. Unraveling micro-architectural modulations in neural tissue upon ischemia by Correlation Tensor MRI. bioRxiv 2021.02.20.432088.
12. Watson B D, et al. Induction of reproducible brain infarction by photochemically initiated thrombosis. Ann. Neurol., vol. 17, pp. 497–504, 1985.
13. Franklin K, Paxinos G. Paxinos and Franklin’s the Mouse Brain in Stereotaxic Coordinates, 5th ed. 2019.
14. Henriques R N, Jespersen S N, Shemesh N. Evidence for microscopic kurtosis in neural tissue revealed by correlation tensor MRI. Magnetic Resonance in Medicine, vol. 86, pp. 3111– 3130, 2021.
15. Veraart J, et al. Denoising of diffusion MRI using random matrix theory. NeuroImage, vol. 142, pp. 394–406, 2016.
16. Guizar-sicairos M, Thurman S T, Fienup J R. Efficient subpixel registration. Optics Letters, vol. 33, pp. 156–158, 2008.
17. Novello L, et al. In vivo Correlation Tensor MRI reveals microscopic kurtosis in the human brain on a clinical 3T scanner. bioRxiv 2021.11.02.466950.
18. Chen Z Q, et al. Evaluating ischemic stroke with diffusion tensor imaging. Neurological Research, vol. 30, pp. 720-726, 2008.
19. Dijkhuizen R M, et al. Functional MRI and Diffusion Tensor Imaging of Brain Reorganization After Experimental Stroke. Translational Stroke Research, vol. 3, pp. 36-43, 2012.
20. Moura L M, et al. Diffusion Tensor Imaging Biomarkers to Predict Motor Outcomes in Stroke: A Narrative Review. Frontiers in Neurology, vol. 10, 2019.
21. Hui E S, et al. Spatiotemporal dynamics of diffusional kurtosis, mean diffusivity and perfusion changes in experimental stroke. Brain research, vol. 1451, pp. 100-109, 2012.
22. Weber R A, et al. Diffusional kurtosis and diffusion tensor imaging reveal different time-sensitive stroke-induced microstructural changes. Stroke, vol 46, pp. 545-550, 2015.
23. Budde M D, Frank J A. Neurite beading is sufficient to decrease the apparent diffusion coefficient after ischemic stroke. Proceedings of the National Academy of Sciences of the United States of America, vol. 107, pp. 14472–14477, 2010.
24. Michinaga S, Koyama Y. Pathogenesis of brain edema and investigation into anti-edema drugs. Int J Mol Sci., vol. 16, pp. 9949-75, 2015.
25. Hossmann K A. Pathophysiology and therapy of experimental stroke. Cell Mol Neurobiol, vol. 26, pp. 1057-83, 2006.
26. Jin R, Yang G, Li G. Inflammatory mechanisms in ischemic stroke: role of inflammatory cells. J Leukoc Biol. vol. 87, pp. 779-789, 2010.
Figures

Fig. 1 - Study design. In the photothrombotic stroke model a well delimited and reproducible focal infarct is induced by injecting a light sensitive dye and illuminating the area to be stroked without craniotomy for 15 minutes. After stroke induction, CTI data were acquired according to the scheme from Henriques et al.14 at three distinct time points post onset: 3h (acute), 3 days (subacute) and 3 weeks (chronic).

Fig. 2 - Quality of Raw data. (A) Non-diffusion weighted images from one of the acquired slices in a representative animal at 3h, 3 days and 3 weeks post stroke onset. (B-E) Powder-averaged data computed by averaging the diffusion-weighted signals decays over 135 directions of diffusion wave vectors at 3h, 3d and 3w post onset for b-value = (B) 1.4, (C) 1.6, (D) 2.8 and (E) 3.2 ms/μm2.


