0513
Gray matter microstructure imaging by b-tensor encoding at high b-values and high spatial resolution1Department of Diagnostic Radiology, Clinical Sciences Lund, Lund University, Lund, Sweden, 2Clinical Memory Research Unit, Department of Clinical Sciences, Lund University, Lund, Sweden
Synopsis
Studying gray matter microstructure with dMRI is challenging because of partial volume effects and high orientation dispersion. In this work, we propose a novel method that combines spherical b-tensor encoding, strong diffusion weighting and super-resolution reconstruction to perform high-resolution microstructure imaging of gray matter. We map the tissue mean diffusivity and the microscopic anisotropy which, by their design, are unaffected by partial volume effects and intra-voxel orientation dispersion. We demonstrate the approach in human brain in vivo at a resolution of 1.4 mm isotropic.
Introduction
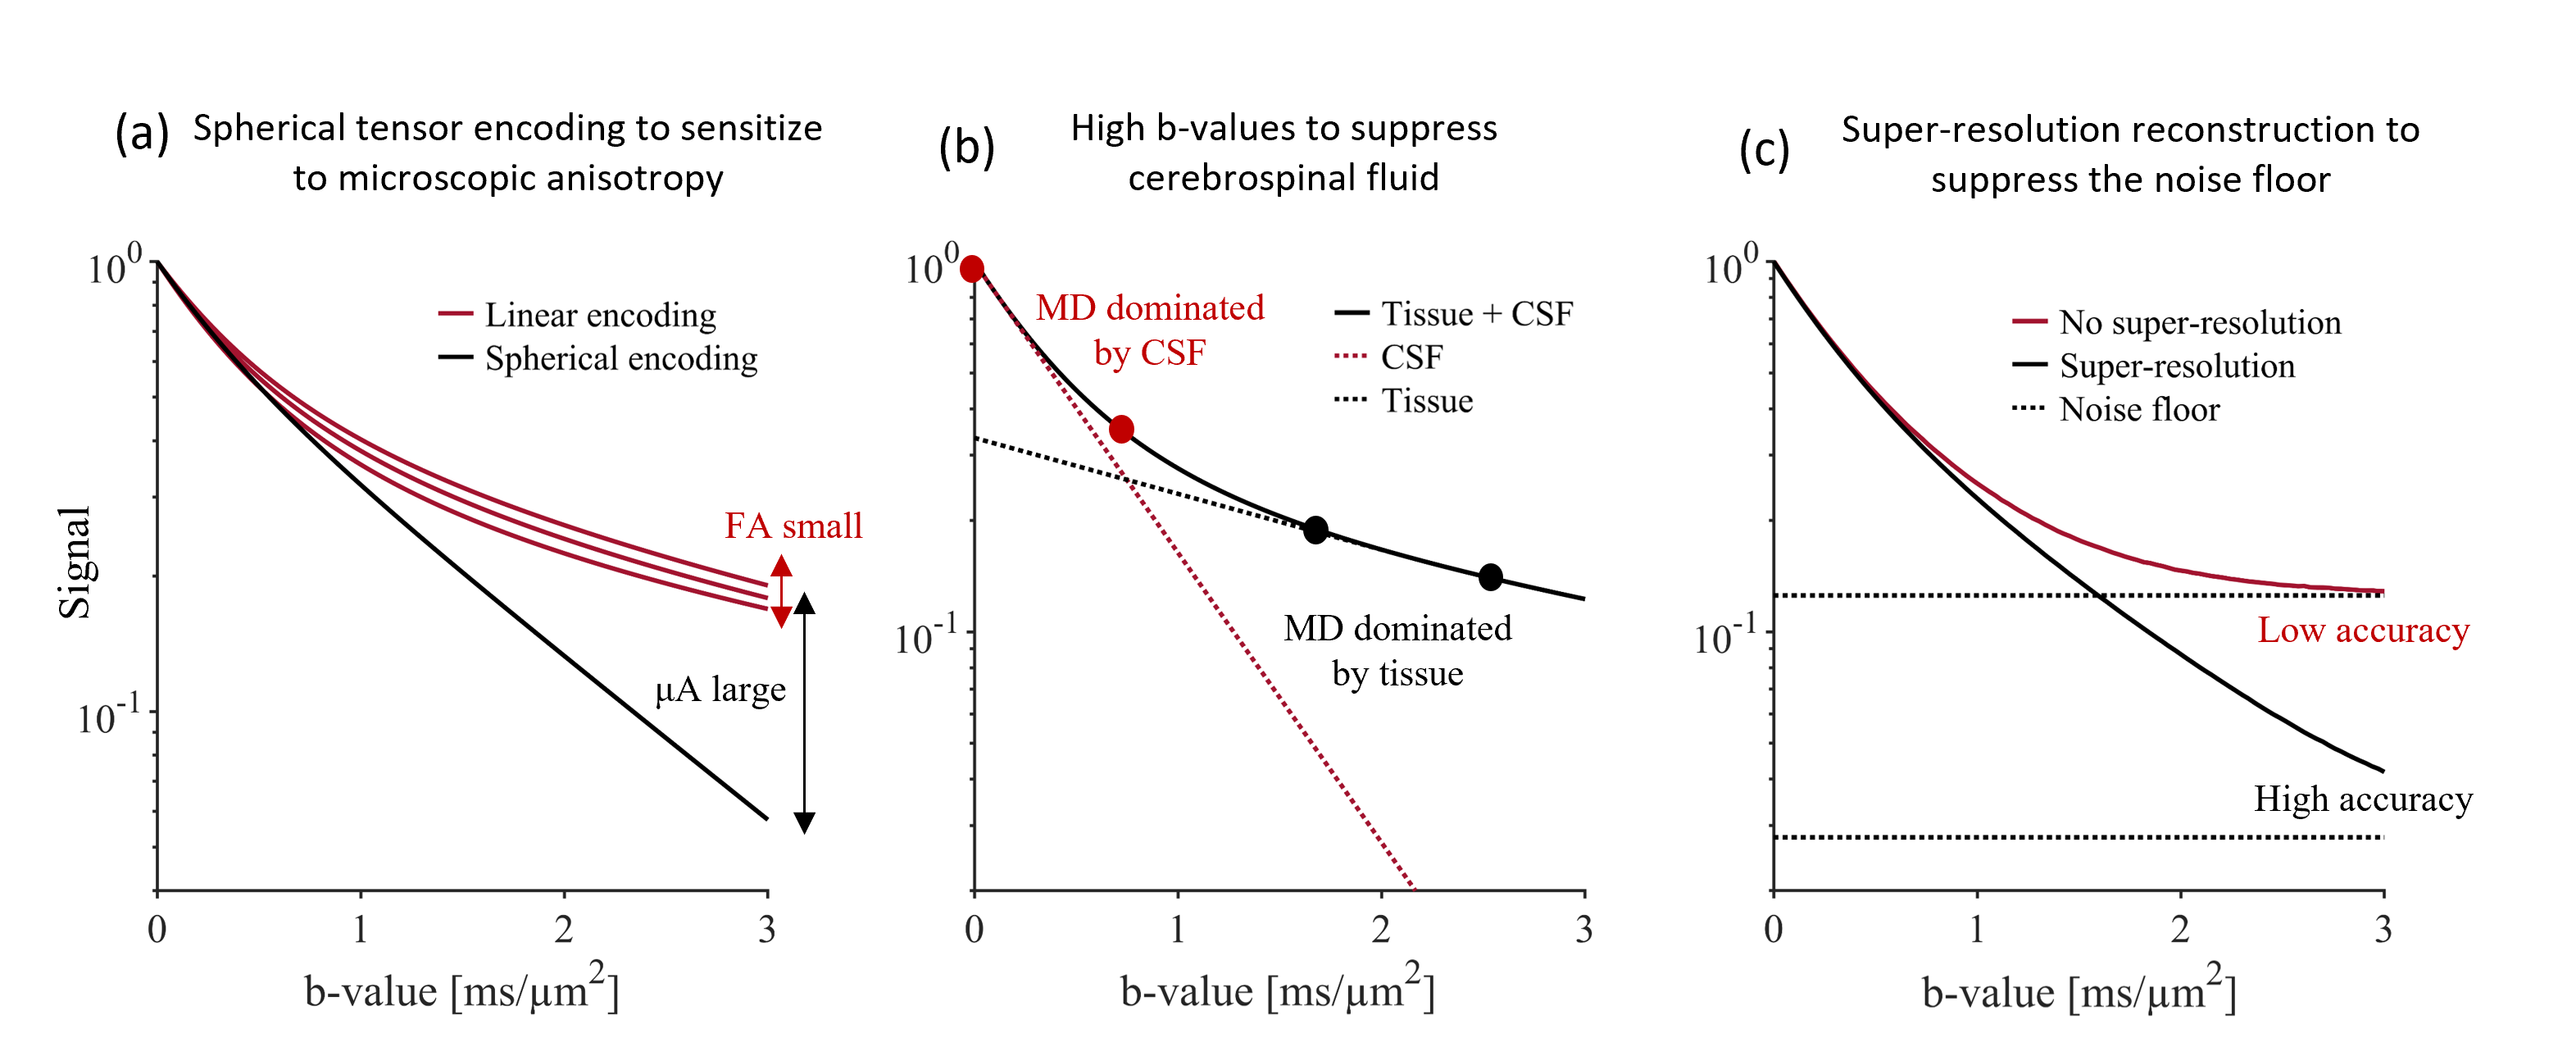
Diffusion MRI of gray matter is gaining interest but remains relatively unexplored. There are two main challenges. First, the average cortical thickness is approximately 2.5 mm which renders cortical dMRI metrics inaccurate due to partial volume effects with both white matter and cerebrospinal fluid (CSF) [1]. Second, gray matter microstructure is heterogenous across its different layers and its anisotropic constituents have high orientation dispersion [2]. This prevents accurate mapping of cortical diffusion anisotropy by, e.g., diffusion tensor imaging. In this work, we aim to address these challenges by combining three techniques. We capture microscopic anisotropy by tensor-valued diffusion encoding [3][4] (Fig. 1a). We suppress CSF by basing analysis on high-b-value data (Fig. 1b). We use a super-resolution technique to resolve the fine details of gray matter (1.4 mm3 isotropic) and to improve the signal-to-noise-floor-ratio (Fig. 1c). Together, these techniques yield a novel perspective on gray matter microstructure.Methods
Data acquisitionA healthy volunteer was scanned on a 3T MAGNETOM Prisma using a 64-channel coil (Siemens Healthcare, Erlangen, Germany). We used a prototype spin-echo EPI pulse sequence that enables b-tensor encoding [5]. dMRI was performed with whole-brain coverage, eight equally spaced FOV-rotations, resolution 1.4x1.4x6.3 mm3 with TR/TE=2.3s/108ms. For each FOV-rotation, we performed spherical and linear b-tensor encoding (STE and LTE) at b = [0, 1.0, 1.5, 2.5] ms/μm2 along nrot = [4, 8, 16, 24] rotations, respectively. Total acquisition time was 32 minutes.
Data reconstruction and analysis
Data were denoised [6][7] and reconstructed to a resolution of 1.4x1.4x1.4 mm3 using super-resolution reconstruction (SRR) [8]. SRR produces a high-resolution image from multiple low-resolution images, which have higher SNR per shot and thus reduced noise-floor effects. Reconstructed data were averaged per b-shell and corrected for field inhomogeneity distortions [9][10]. To compute a metric of mean diffusivity unaffected by CSF, we calculated the ‘tissue mean diffusivity’ MDt at high b-values where CSF is suppressed, according to $$ MD_{t} =\frac{\text{ -log(}S(b_2) -S(b_1))}{b_2-b_1},$$
where S is the acquired signal, b1 = 1.5 ms/μm2 and b2 = 2.5 ms/μm2. This was calculated for both LTE and STE. We also compare the obtained MDt maps to ‘conventional’ MD maps calculated at b1 = 0 ms/μm2 and b2 = 1 ms/μm2. To capture microscopic diffusion anisotropy, we computed μA according to $$\mu A=\frac{S_{LTE}(b_2) -S_{STE}(b_2))}{(S_{LTE}(b_1)+S_{STE}(b_1))/2},$$
where b1 = 1.5 ms/μm2 and b2 = 2.5 ms/μm2. We compared μA to the FA obtained from DTI [11]. Both MDt and μA were mapped to a surface representation of the cortex obtained by applying the FreeSurfer pipeline (v7.1.1) [12] to a morphological scan. Median values were extracted from cortical parcels of the Desikan-Killiany-Tourville atlas and compared between regions known to feature different cyto- and myeloarchitecture (the primary sensory-motor cortex and regions involved in higher cognitive functions such as frontal and cingulate gyri).
Results
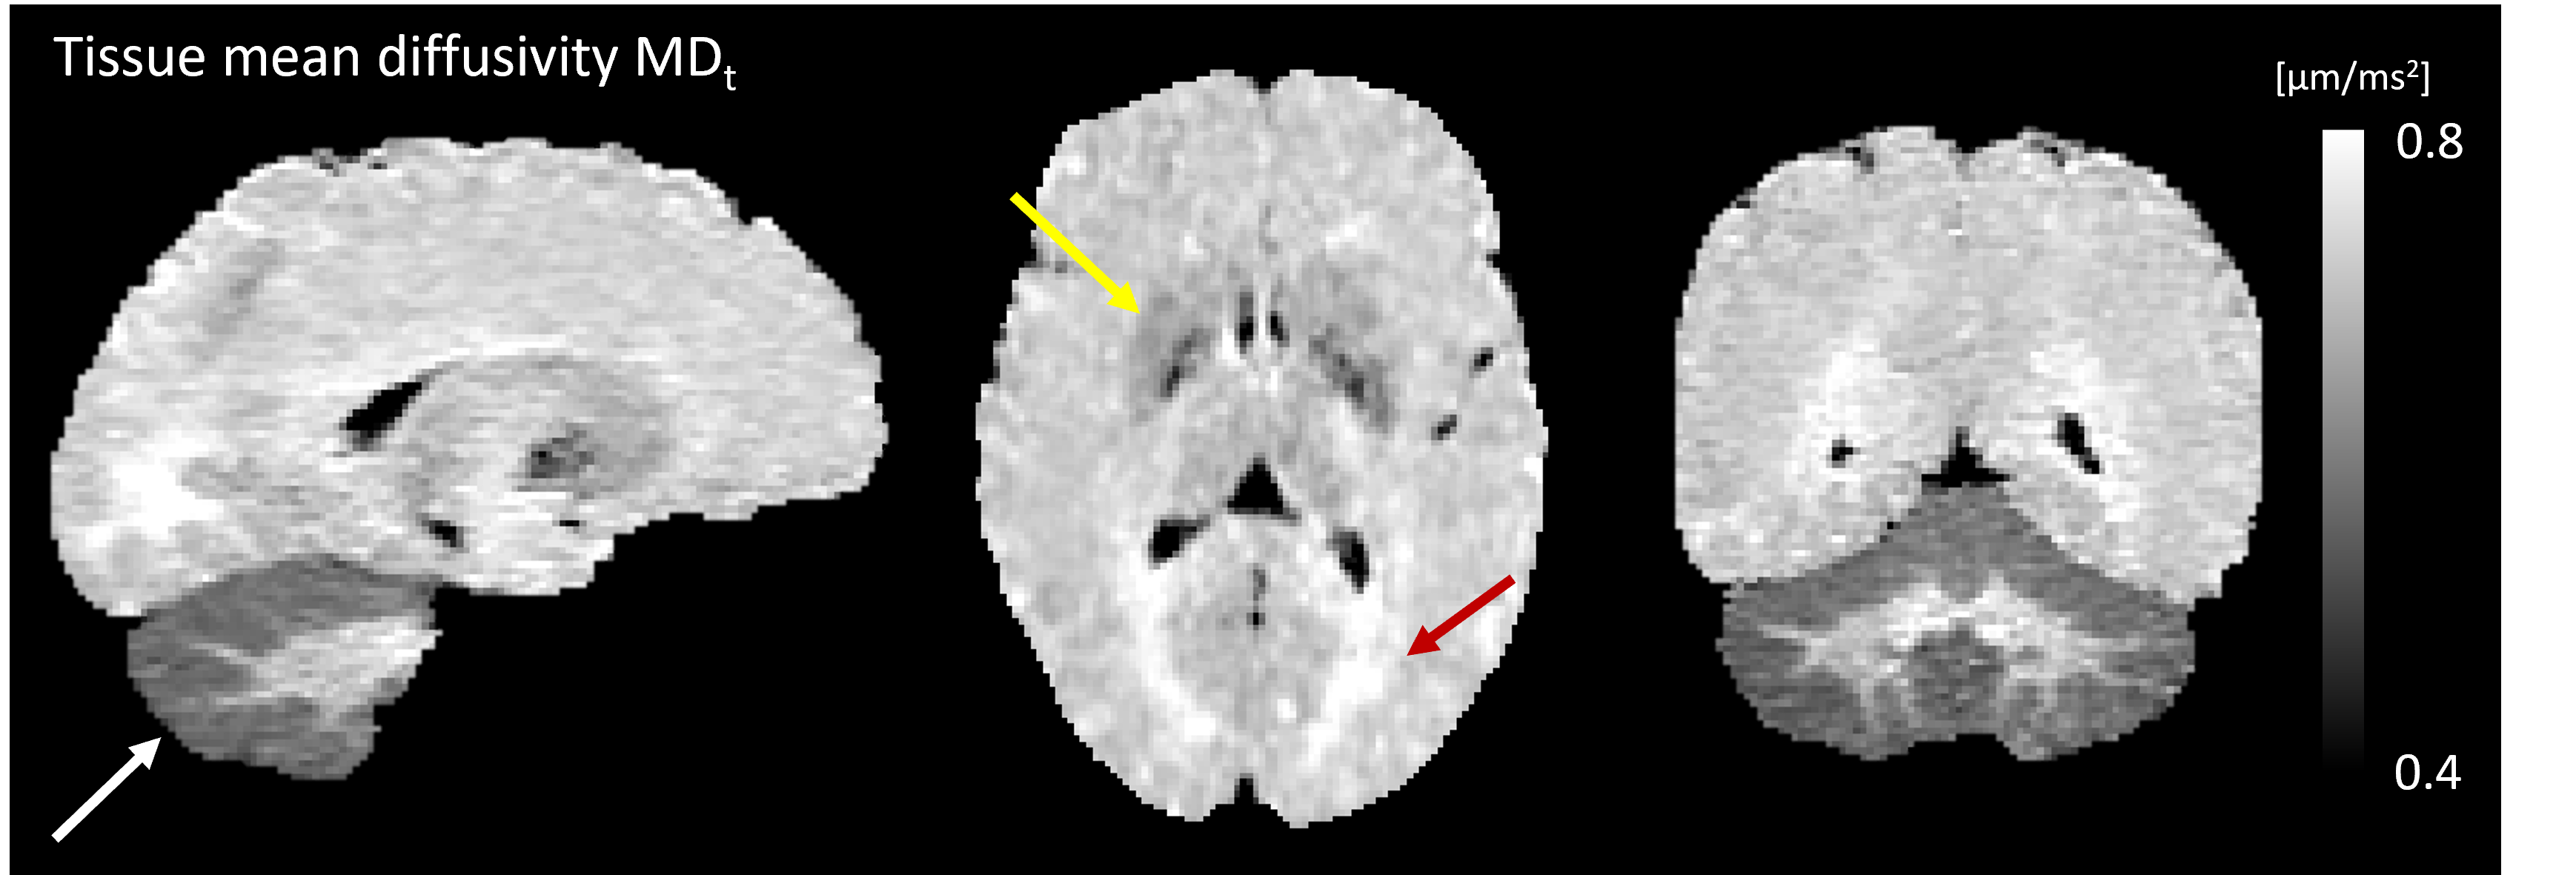
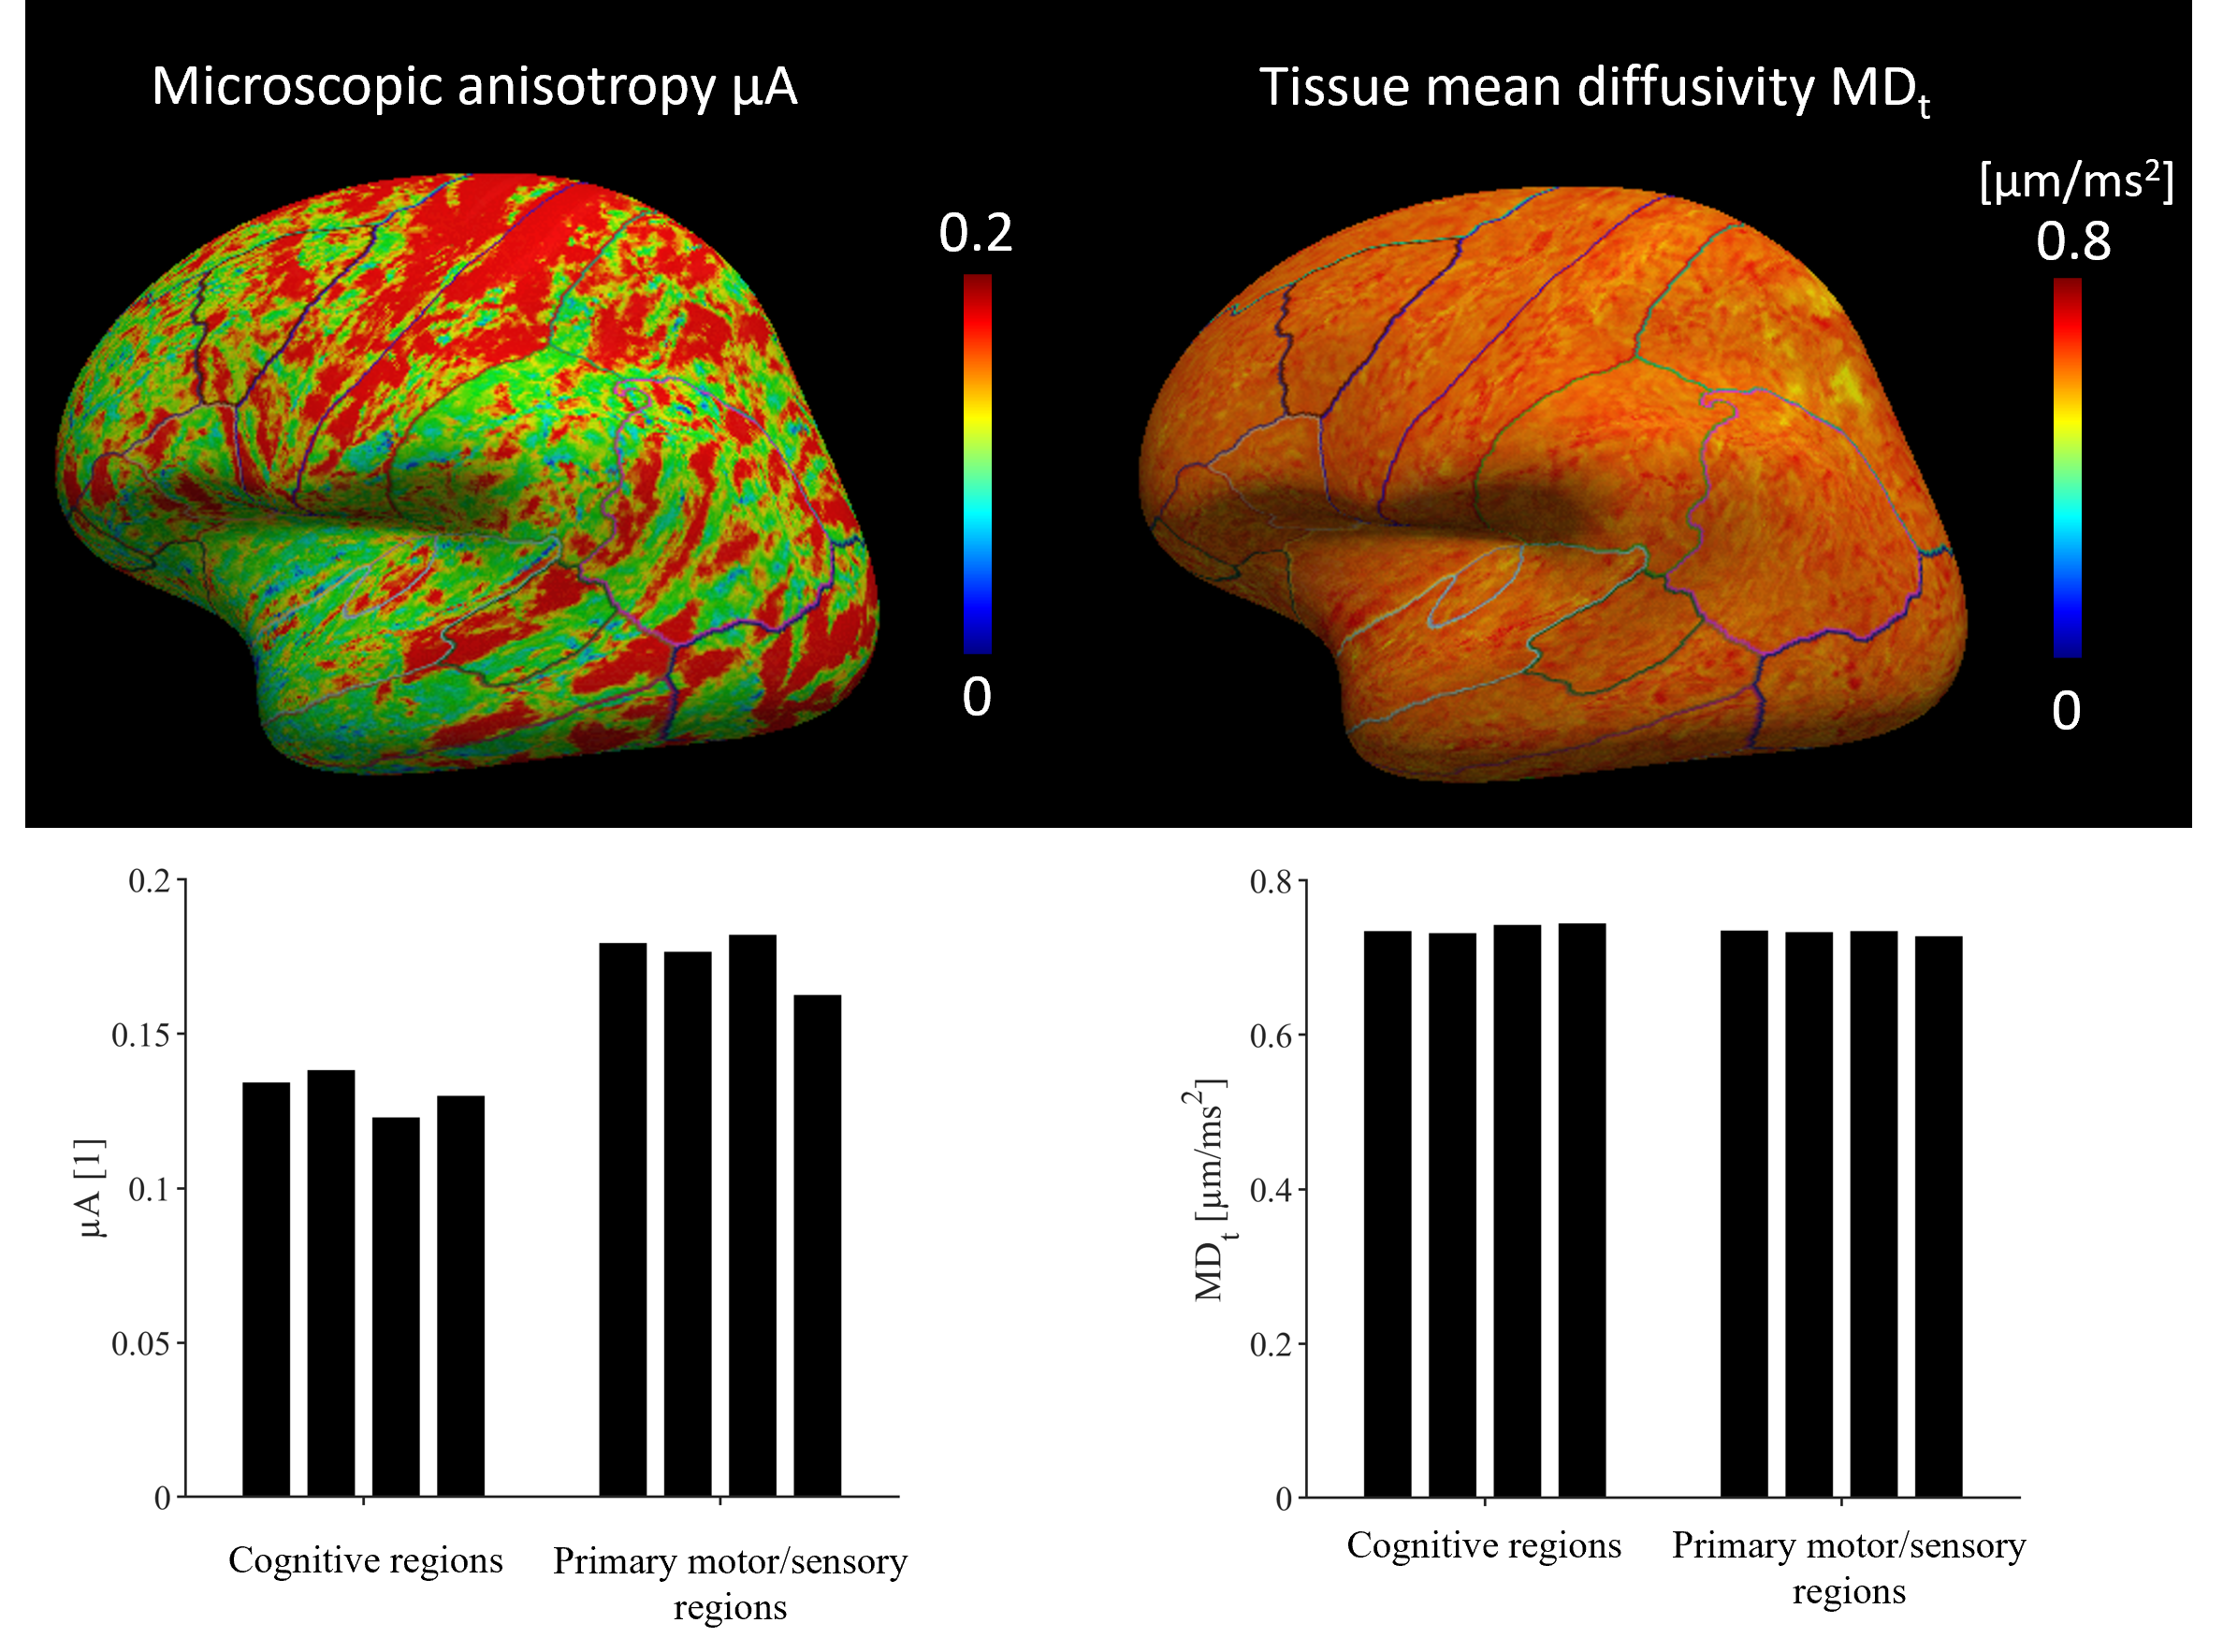
Conventional MD is visibly confounded by CSF in the cortex, while MDt from LTE is confounded by superficial white matter (Fig. 2). The MDt obtained with STE does not suffer from any of these problems. Interestingly, it shows low contrast between white- and gray matter in the cerebrum, but its value in the cerebellar cortex is substantially lower. Furthermore, it is elevated in posterior aspects of the lateral ventricles (Fig. 3). μA showed the highest values in white matter, and lower values in the gray matter. An intensity gradient in μA was observed in the thalamus (Fig. 4). μA was higher in the primary sensory-motor cortex than in cortical regions involved in higher cognitive functions, whereas MDt was similar in all cortical regions (Fig. 5).Discussion
We demonstrate a novel combination of tensor-valued diffusion encoding, high b-values and super-resolution reconstruction. Together, these enabled high-resolution (1.4 mm3 isotropic) characterization of gray matter microstructure using two new metrics: tissue MD and μA. We hypothesize that tissue MD reflects gray matter cell density uninfluenced by CSF and superficial white matter. In the healthy brain, tissue MD appears to reflect a higher cell density in the cerebellum and a reduced fiber density posterior to the lateral ventricles. Compared with other approaches for estimating MD unconfounded by CSF, such as FLAIR-dMRI, our approach is faster since FLAIR leads to substantial acquisition time increase [13]. Microscopic anisotropy also provided interesting results. First, the microscopic anisotropy exhibited a medial-lateral gradient across the thalamus that resembled the contrast obtained from myelin-stain histology [14]. Furthermore, the highly myelinated primary cortical regions exhibited higher microscopic anisotropy than the less myelinated cortical regions involved in higher cognitive functions. These observations are consistent with the suggestion that microscopic anisotropy primarily reflects the level of myelin and/or axons in neural tissue [14].Conclusion
We demonstrate that it is feasible to map the tissue mean diffusivity and the microscopic anisotropy of the cortex in high-resolution (1.4 mm3 isotropic). This was enabled by combining three powerful techniques: spherical tensor encoding, high b-values and super-resolution reconstruction. The obtained metrics showed a variation across the brain that was consistent with known trends.Acknowledgements
We thank Siemens Healthcare (Erlangen, Germany) for access to the pulse sequence programming environment.References
[1] B.-B. Koo, N. Hua, C.-H. Choi, I. Ronen, J.-M. Lee, and D.-S. Kim, “A framework to analyze partial volume effect on gray matter mean diffusivity measurements.,” Neuroimage, vol. 44, no. 1, pp. 136–144, Jan. 2009, doi: 10.1016/j.neuroimage.2008.07.064.
[2] M. Judas, “Judaš M, Cepanec M (2010) Oskar Vogt: The first myeloarchitectoic map of the human frontal cortex. Translational Neuroscience 1(1):72-94.,” Transl. Neurosci., vol. 1, pp. 72–94, Jan. 2010.
[3] S. Lasič, F. Szczepankiewicz, S. Eriksson, M. Nilsson, and D. Topgaard, “Microanisotropy imaging: quantification of microscopic diffusion anisotropy and orientational order parameter by diffusion MRI with magic-angle spinning of the q-vector,” Front. Phys., vol. 2, p. 11, 2014, doi: 10.3389/fphy.2014.00011.
[4] F. Szczepankiewicz et al., “Quantification of microscopic diffusion anisotropy disentangles effects of orientation dispersion from microstructure: Applications in healthy volunteers and in brain tumors,” Neuroimage, vol. 104, pp. 241–252, 2015, doi: https://doi.org/10.1016/j.neuroimage.2014.09.057.
[5] F. Szczepankiewicz, J. Sjölund, F. Ståhlberg, J. Lätt, and M. Nilsson, “Tensor-valued diffusion encoding for diffusional variance decomposition (DIVIDE): Technical feasibility in clinical MRI systems,” PLoS One, vol. 14, no. 3, p. e0214238, Mar. 2019, [Online]. Available: https://doi.org/10.1371/journal.pone.0214238.
[6] L. Cordero-Grande, D. Christiaens, J. Hutter, A. N. Price, and J. V Hajnal, “Complex diffusion-weighted image estimation via matrix recovery under general noise models,” Neuroimage, vol. 200, pp. 391–404, 2019, doi: https://doi.org/10.1016/j.neuroimage.2019.06.039.
[7] J.-D. Tournier et al., “MRtrix3: A fast, flexible and open software framework for medical image processing and visualisation.,” Neuroimage, vol. 202, p. 116137, Nov. 2019, doi: 10.1016/j.neuroimage.2019.116137.
[8] G. Vis, M. Nilsson, C.-F. Westin, and F. Szczepankiewicz, “Accuracy and precision in super-resolution MRI: Enabling spherical tensor diffusion encoding at ultra-high b-values and high resolution,” Neuroimage, vol. 245, p. 118673, 2021, doi: https://doi.org/10.1016/j.neuroimage.2021.118673.
[9] J. L. R. Andersson, S. Skare, and J. Ashburner, “How to correct susceptibility distortions in spin-echo echo-planar images: application to diffusion tensor imaging.,” Neuroimage, vol. 20, no. 2, pp. 870–888, Oct. 2003, doi: 10.1016/S1053-8119(03)00336-7.
[10] S. M. Smith et al., “Advances in functional and structural MR image analysis and implementation as FSL.,” Neuroimage, vol. 23 Suppl 1, pp. S208-19, 2004, doi: 10.1016/j.neuroimage.2004.07.051.
[11] P. J. Basser, J. Mattiello, and D. LeBihan, “MR diffusion tensor spectroscopy and imaging,” Biophys. J., vol. 66, no. 1, pp. 259–267, Jan. 1994, doi: 10.1016/S0006-3495(94)80775-1.
[12] A. M. Dale, B. Fischl, and M. I. Sereno, “Cortical surface-based analysis. I. Segmentation and surface reconstruction.,” Neuroimage, vol. 9, no. 2, pp. 179–194, Feb. 1999, doi: 10.1006/nimg.1998.0395.
[13] M.-C. Chou et al., “FLAIR diffusion-tensor MR tractography: comparison of fiber tracking with conventional imaging.,” AJNR. Am. J. Neuroradiol., vol. 26, no. 3, pp. 591–597, Mar. 2005.
[14] B. Lampinen et al., “Searching for the neurite density with diffusion MRI: Challenges for biophysical modeling,” Hum. Brain Mapp., vol. 40, no. 8, pp. 2529–2545, Jun. 2019, doi: https://doi.org/10.1002/hbm.24542.
[15] C. M. W. Tax, F. Szczepankiewicz, M. Nilsson, and D. K. Jones, “The dot-compartment revealed? Diffusion MRI with ultra-strong gradients and spherical tensor encoding in the living human brain,” Neuroimage, vol. 210, p. 116534, 2020, doi: https://doi.org/10.1016/j.neuroimage.2020.116534.
Figures