0512
qModeL: A Model-based Deep Learning Framework for the Recovery of Diffusion-based Microstructural Parameters from Healthy and Lesion Data1University of Iowa, Iowa City, IA, United States, 2GE Healthcare, Waukesha, WI, United States
Synopsis
A flexible deep learning based framework is presented for the recovery of microstructural parameter maps from advanced diffusion models. The method is shown to work well across field strengths, and healthy and diseased tissue without needing separate training of the DL network. The DL framework is embedded in a model-based reconstruction, which enables the framework to handle variations in data acquisition settings such as various acceleration factors and noise levels, without having to change the network. k-q accelerations in the range of 12-18 fold is demonstrated for single and multi-shell diffusion data.
Introduction
The sensitivity of MRI to the microscopic diffusing motion of water molecules is utilized in diffusion MRI (dMRI) to study the tissue microstructure non-invasively. Classical microstructure analysis have relied on simple models such as the tensor model widely employed in diffusion tensor imaging (DTI). Recently, advanced models such as kurtosis model, neurite orientation dispersion and density imaging (NODDI)1, and other biophysically inspired multi-compartment models are gaining popularity because they possess greater specificity than DTI in relating the dMRI signal to the underlying cellular microstructure2. However, these advanced models are associated with long acquisition times. This leads to high scan costs and restricts its utilization in patients who cannot tolerate long scan times.Prior studies have explored the use of deep learning (DL) to accelerate such acquisitions3-4. The q-space deep learning3 method derives the various microstructural parameters of the advanced models by employing a neural network that learns the input-output mapping to the parameter maps from as low as 12 q-space measurements. However, such methods generally face the challenge of having to re-train the network whenever a new acquisition setting is encountered. For example, when switching to another scanner such that the DWI intensities are not the same anymore, or when the echo-time (TE) is changed, the network should be retrained3. The re-training to each acquisition setting face equally elaborate training data demands. The recently proposed model-based deep learning in q-space (qModeL)4 overcomes the disadvantages typically associated with such end-to-end learning methods. We show the application of qModeL to several acquisition settings (eg: across field strengths, across healthy and abnormal tissues) without needing re-training and for k-q accelerations of 12-18 fold.
Methods
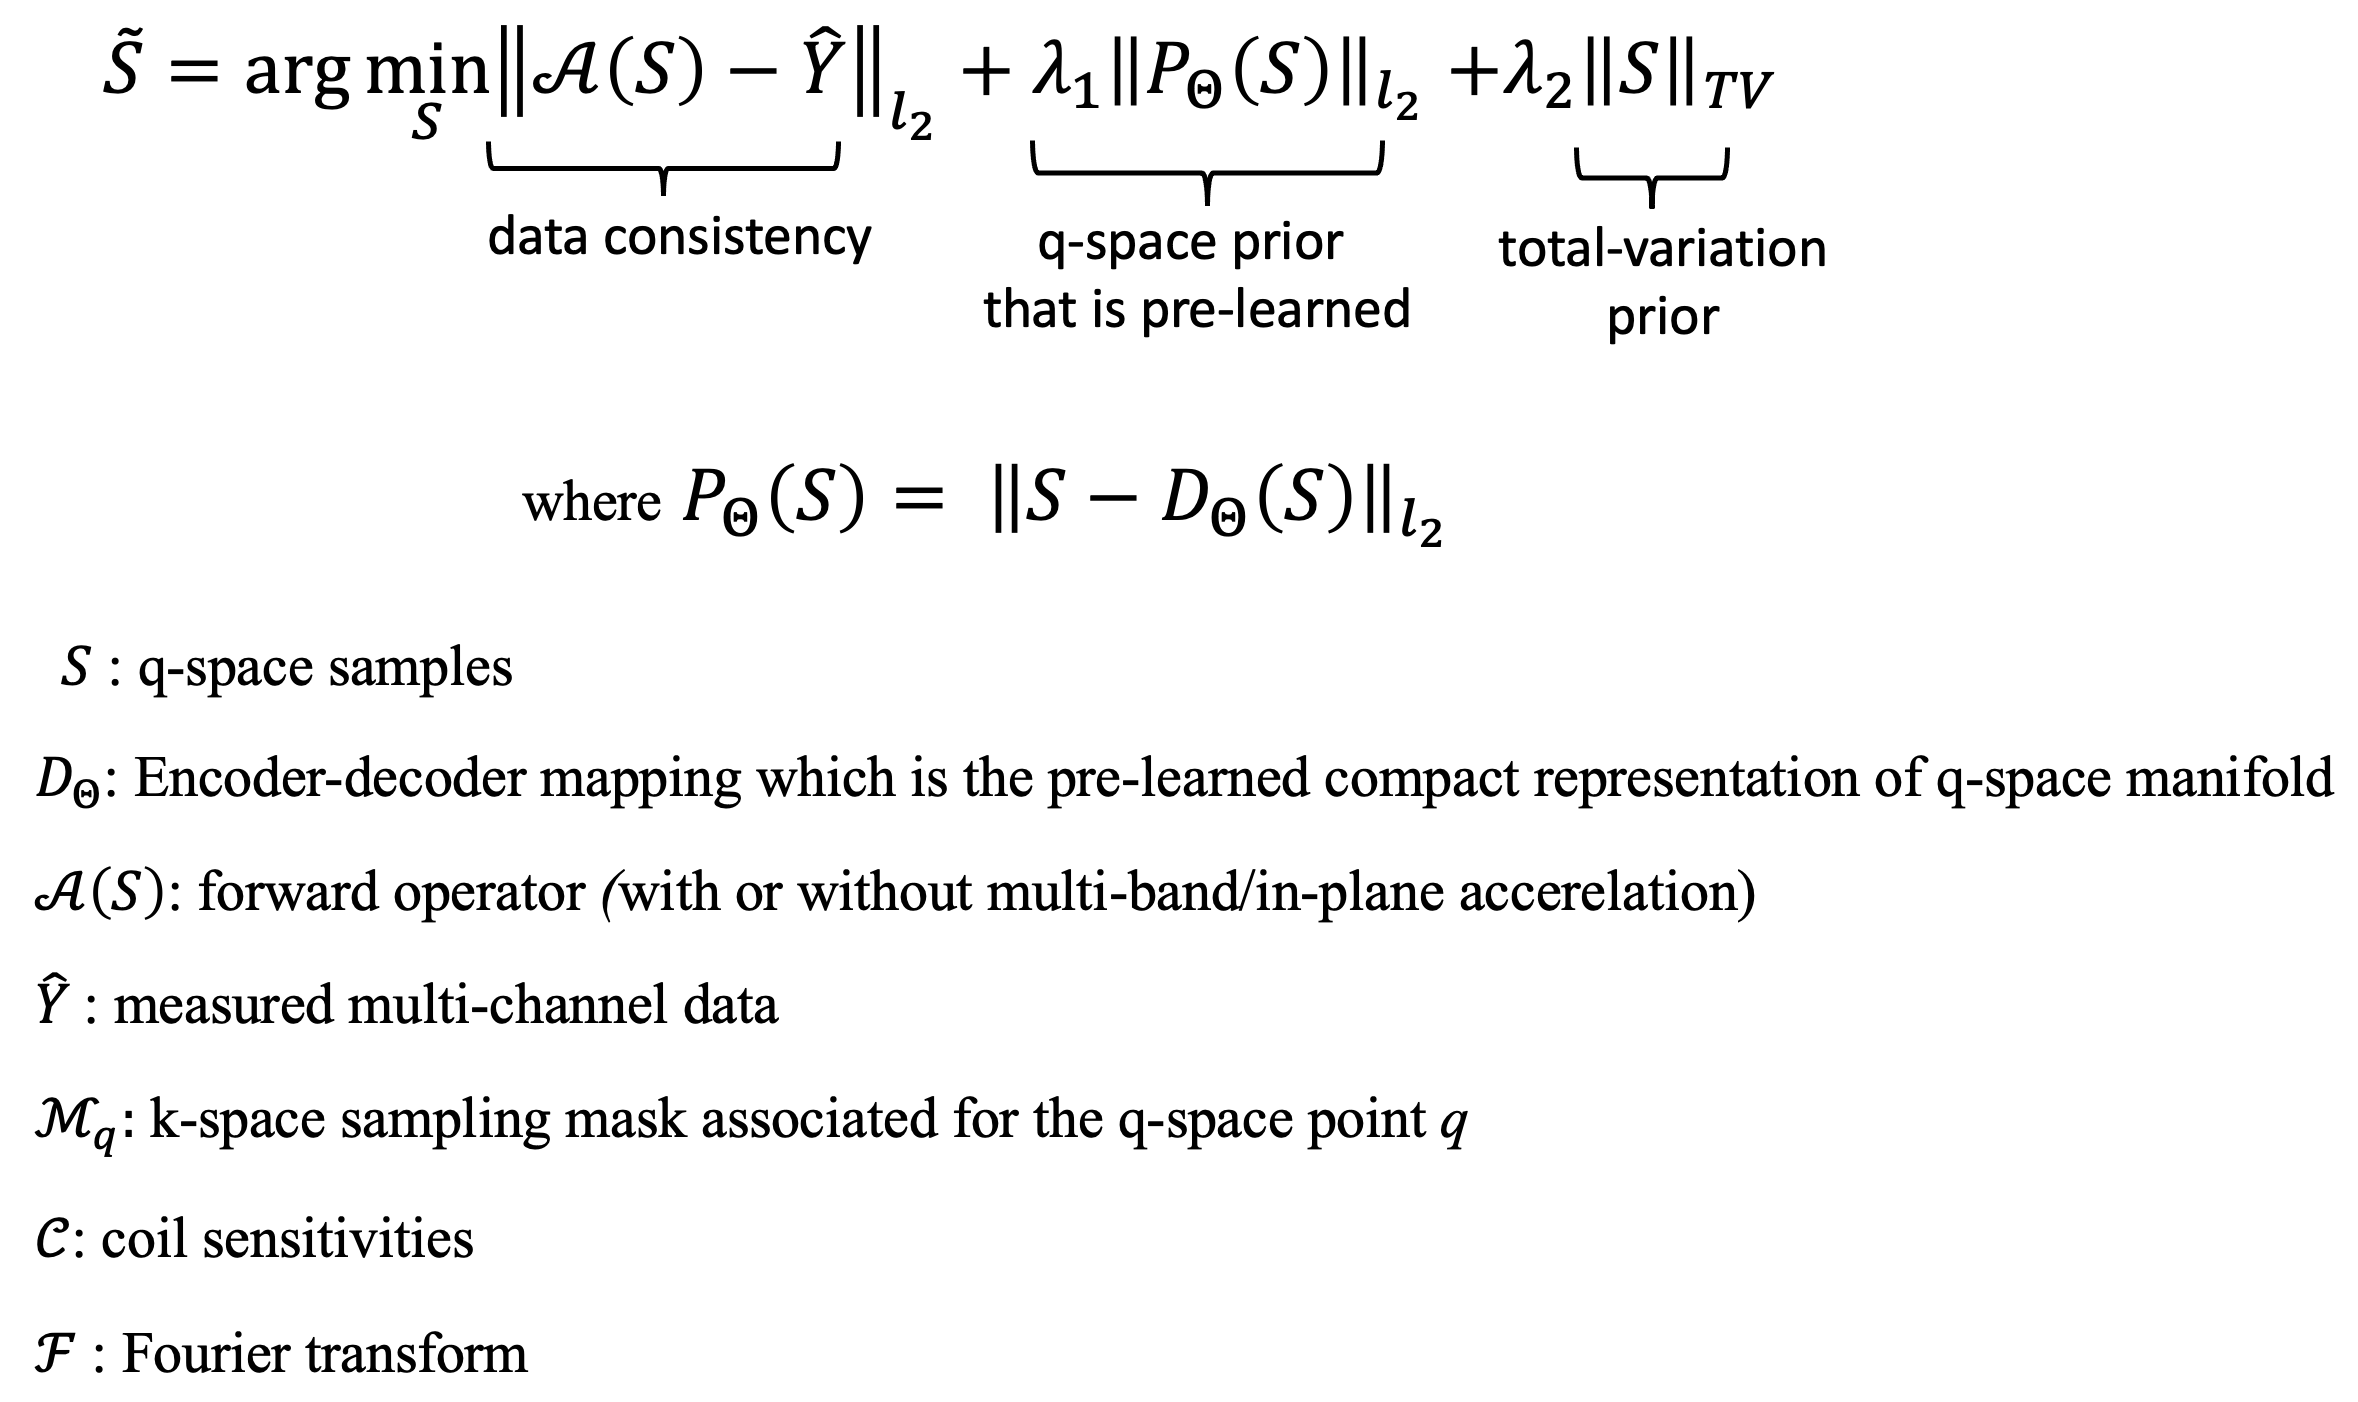
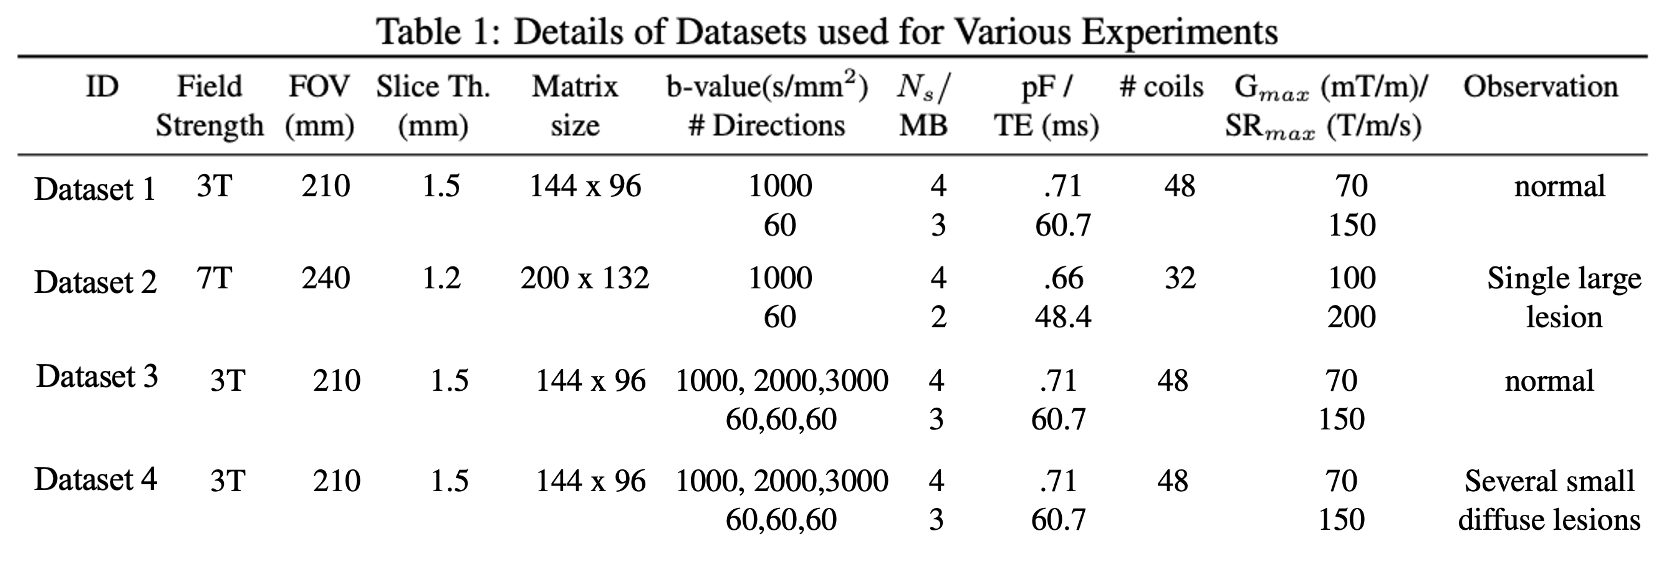
qModeL mimics a traditional iterative model-based reconstruction that employs data priors for the constrained recovery of highly under-sampled data. The formulation of qModeL is given in figure 1. Here, a deep-learned prior pertaining to the q-space manifold of the data is employed, which constrains the reconstruction to recover DWIs belonging to the pre-learned manifold. The prior is only pertinent to the q-space parameters (i.e., b-value, gradient directions). Hence, changes in the image acquisition parameters such as TE, acceleration, field strength, signal intensity, noise levels etc. have no impact on the prior (or the reconstruction).Here, we examine the utility of qModeL to reconstruct q-space data across field strengths and across healthy and lesion data using in-vivo test data collected using various acquisition settings for both single-shell and multi-shell studies. For single-shell experiments, two data were collected from 3T and 7T field strengths (dataset1: healthy, dataset 2: lesion), the details of the specific acquisition parameters are given in Table 1. The 3T data was acquired using a multi-band (MB) factor of 3 whereas the 7T data was acquired with MB=2. A denoising autoencoder (DAE) was trained to learn the q-space of the above single-shell data using biophysical modeling4. $$$ \mathcal D_{\Theta}({\mathbf S})$$$ denotes the encoder-decoder mapping learned by the DAE. The same DAE (denoted by $$$ \mathcal D_{\Theta_1}$$$) was used for reconstructing datasets 1 and 2. For each dataset, various in-plane accelerations were also tested employing $$$ \mathcal D_{\Theta_1}$$$. The application of qModeL for multi-shell settings is also demonstrated using a second DAE ($$$ \mathcal D_{\Theta_2}$$$). Two datasets (dataset 3: healthy, dataset 4: lesion) were employed as test cases, the acquisition parameters of which are also noted in Table 1. $$$ \mathcal D_{\Theta_2}$$$ was utilized to reconstruct datasets 3-4, at various accelerations.
Results
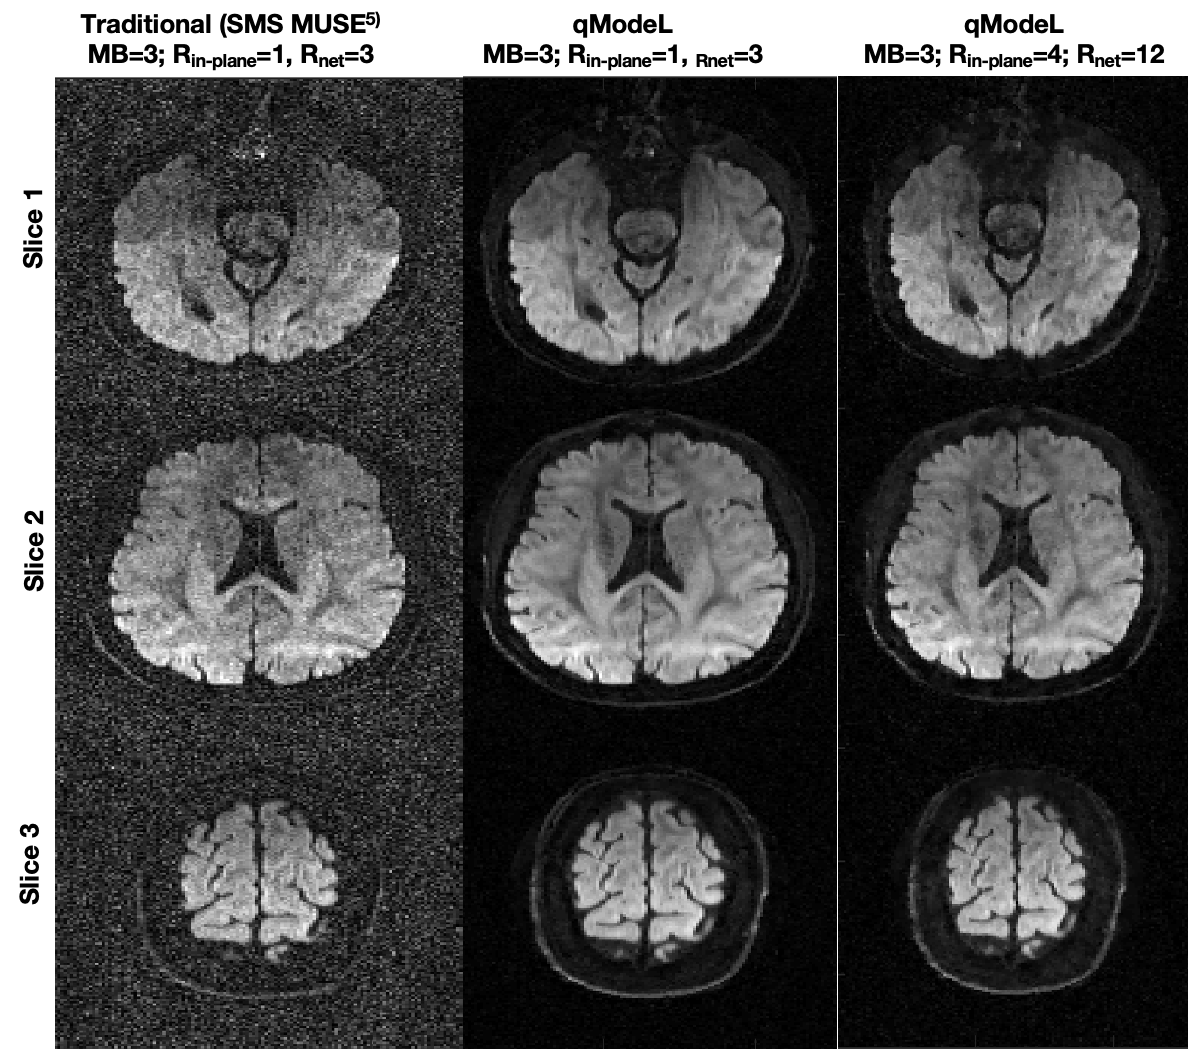
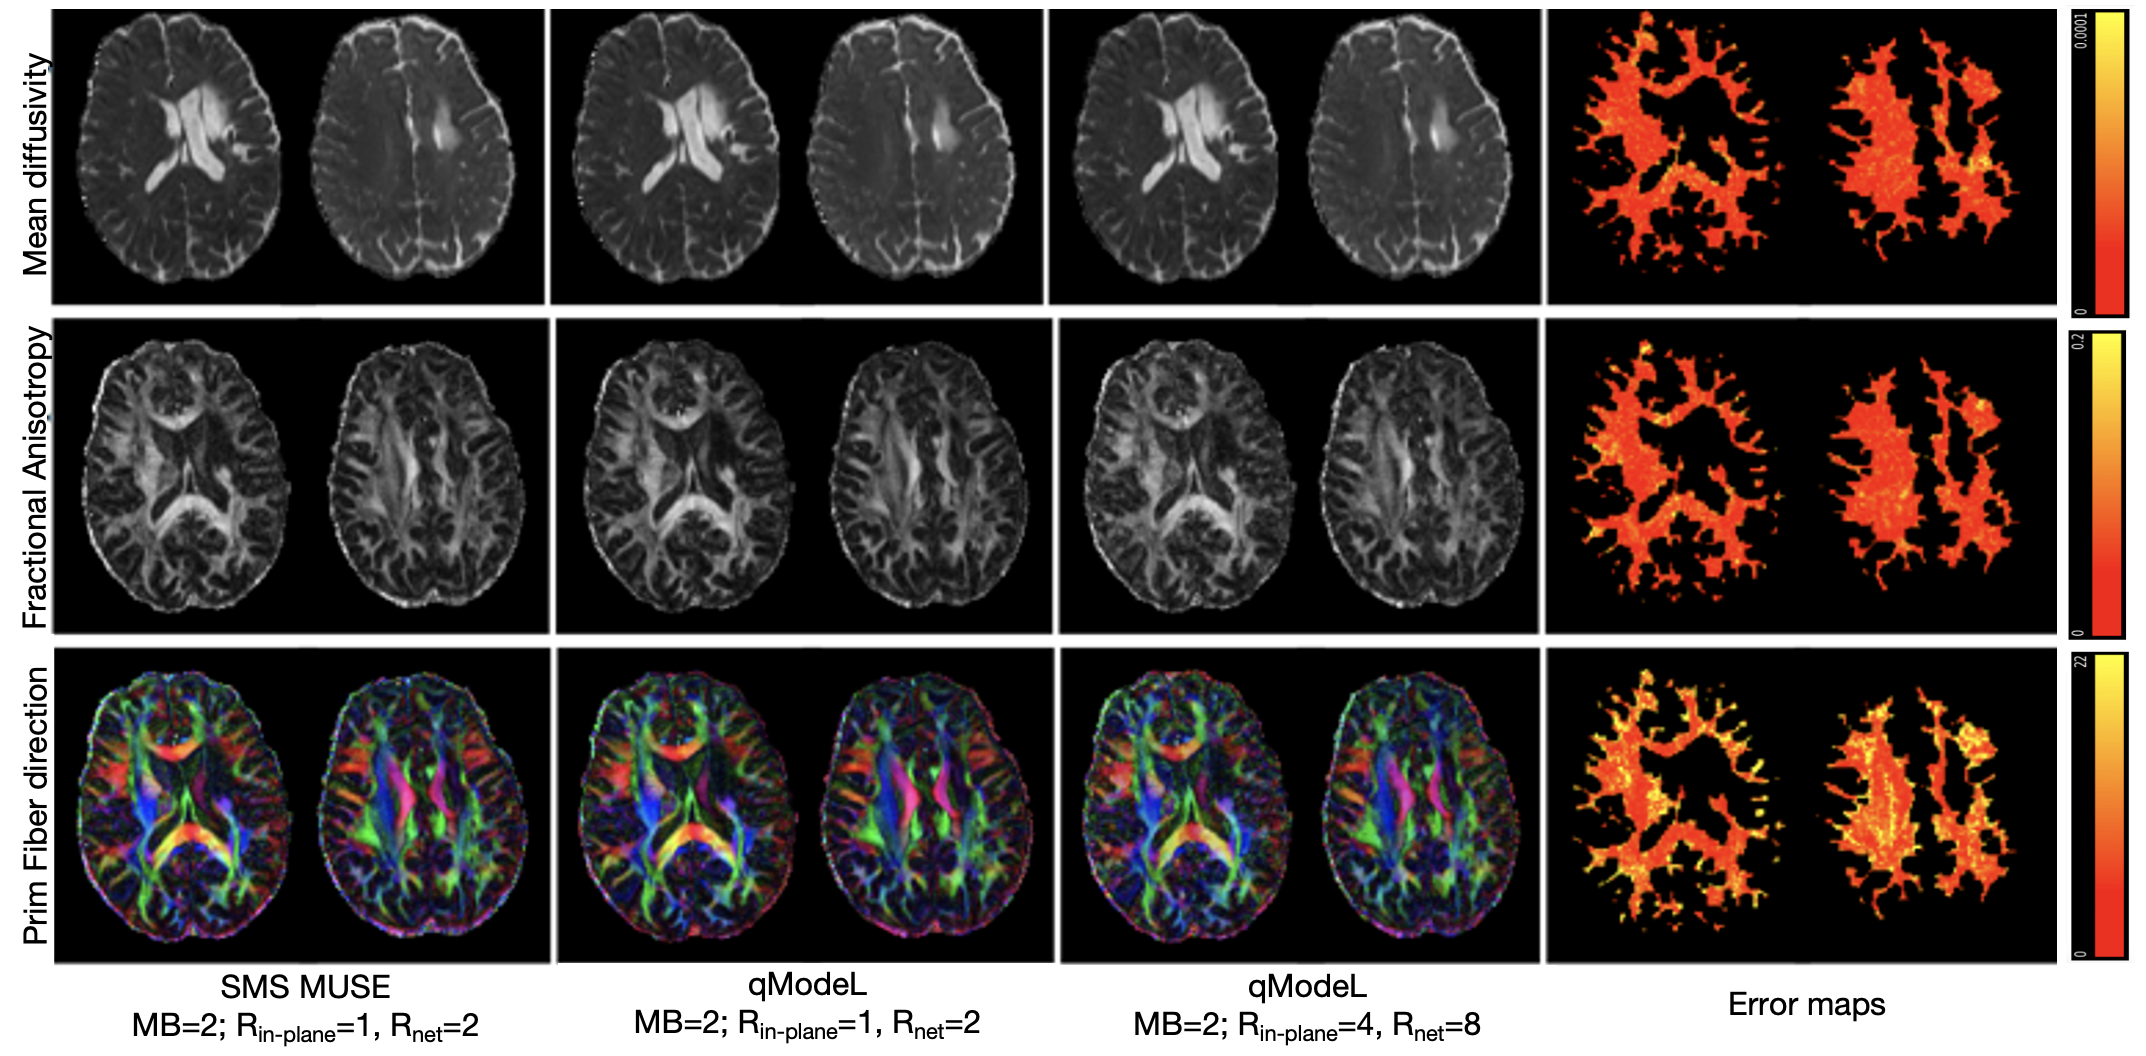
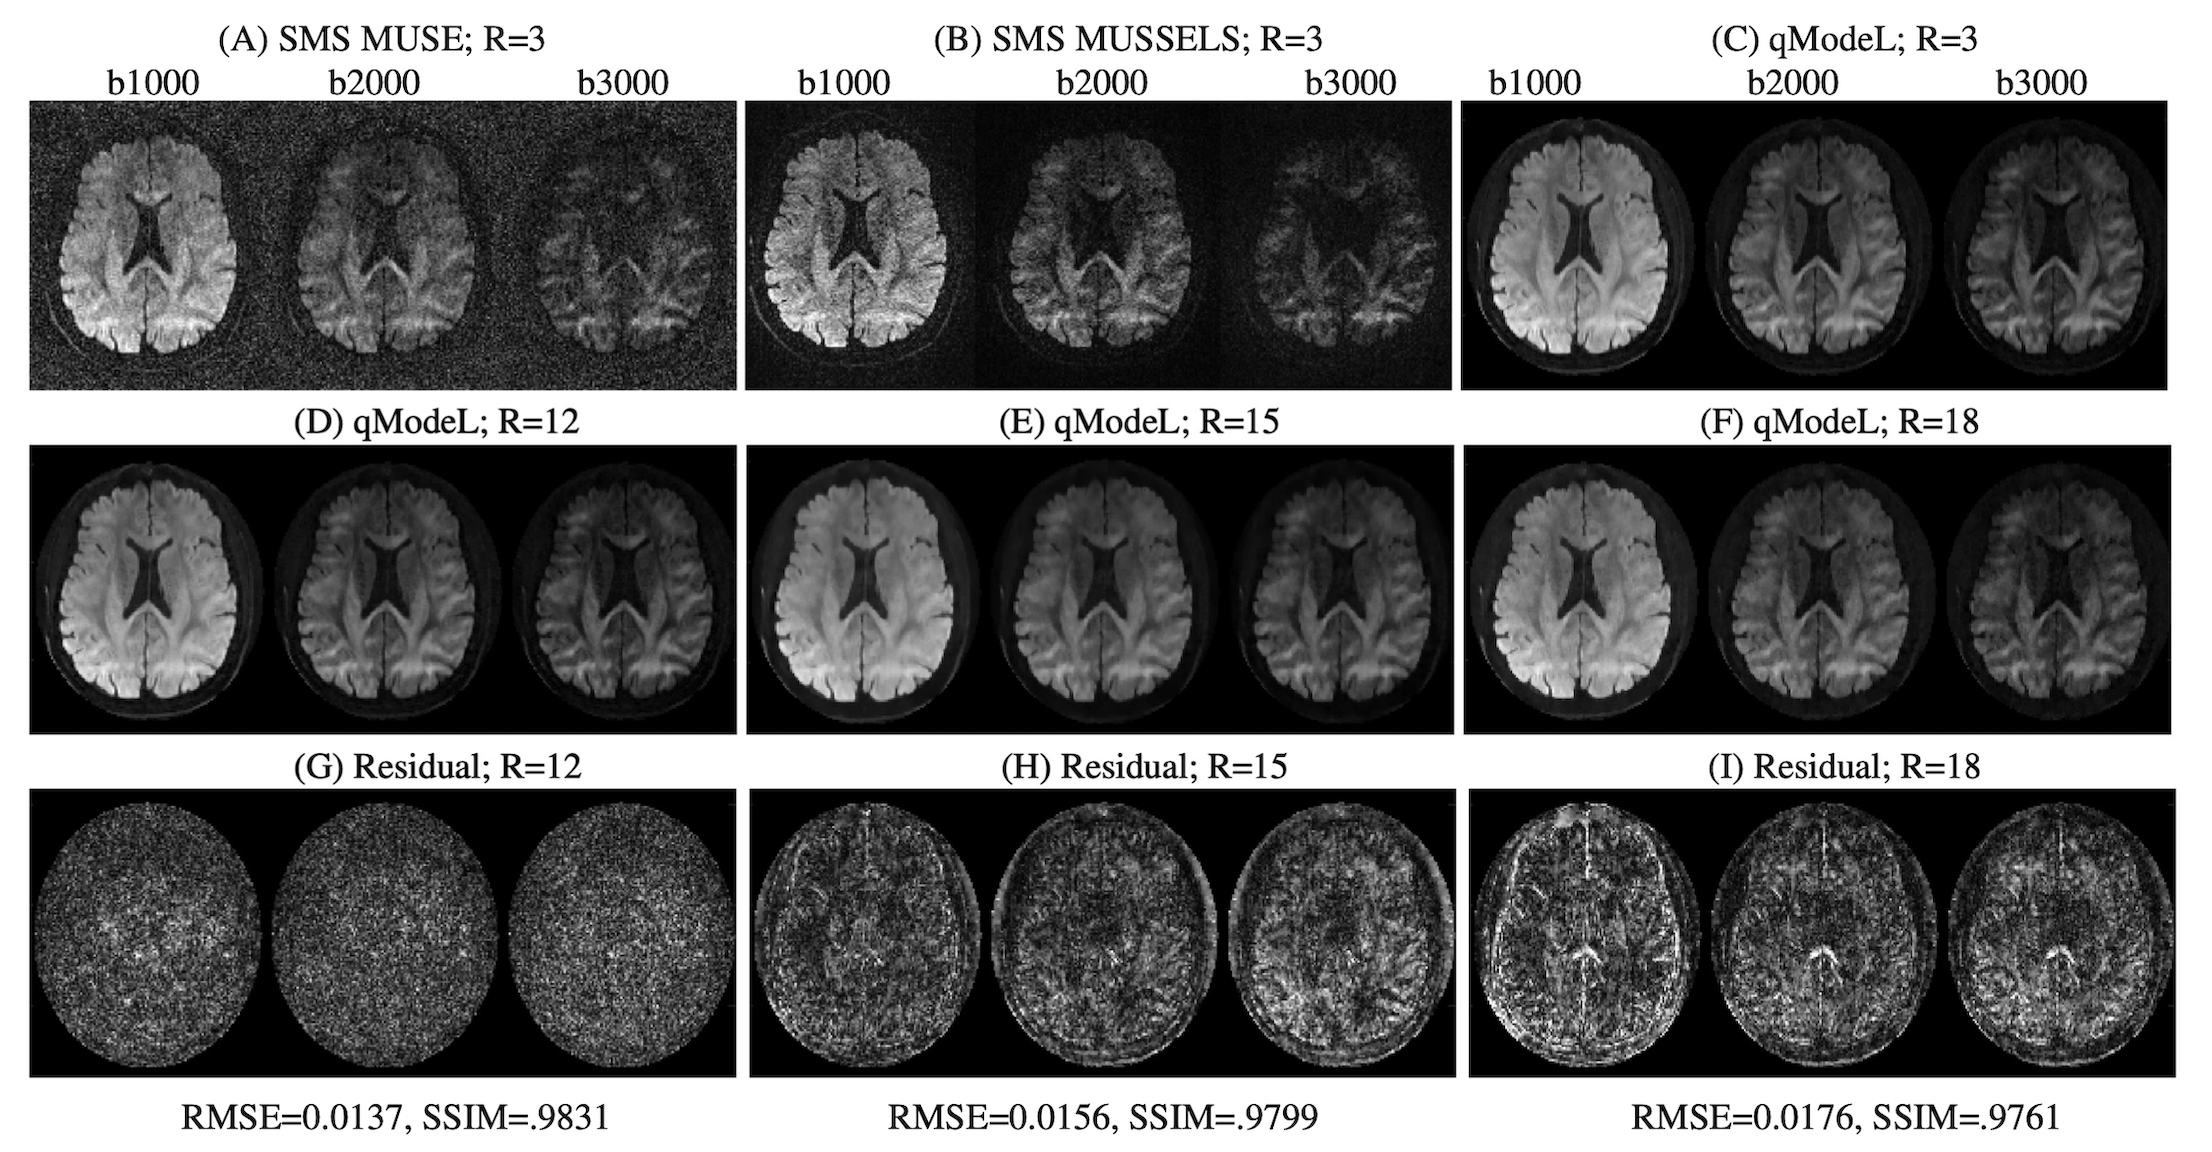
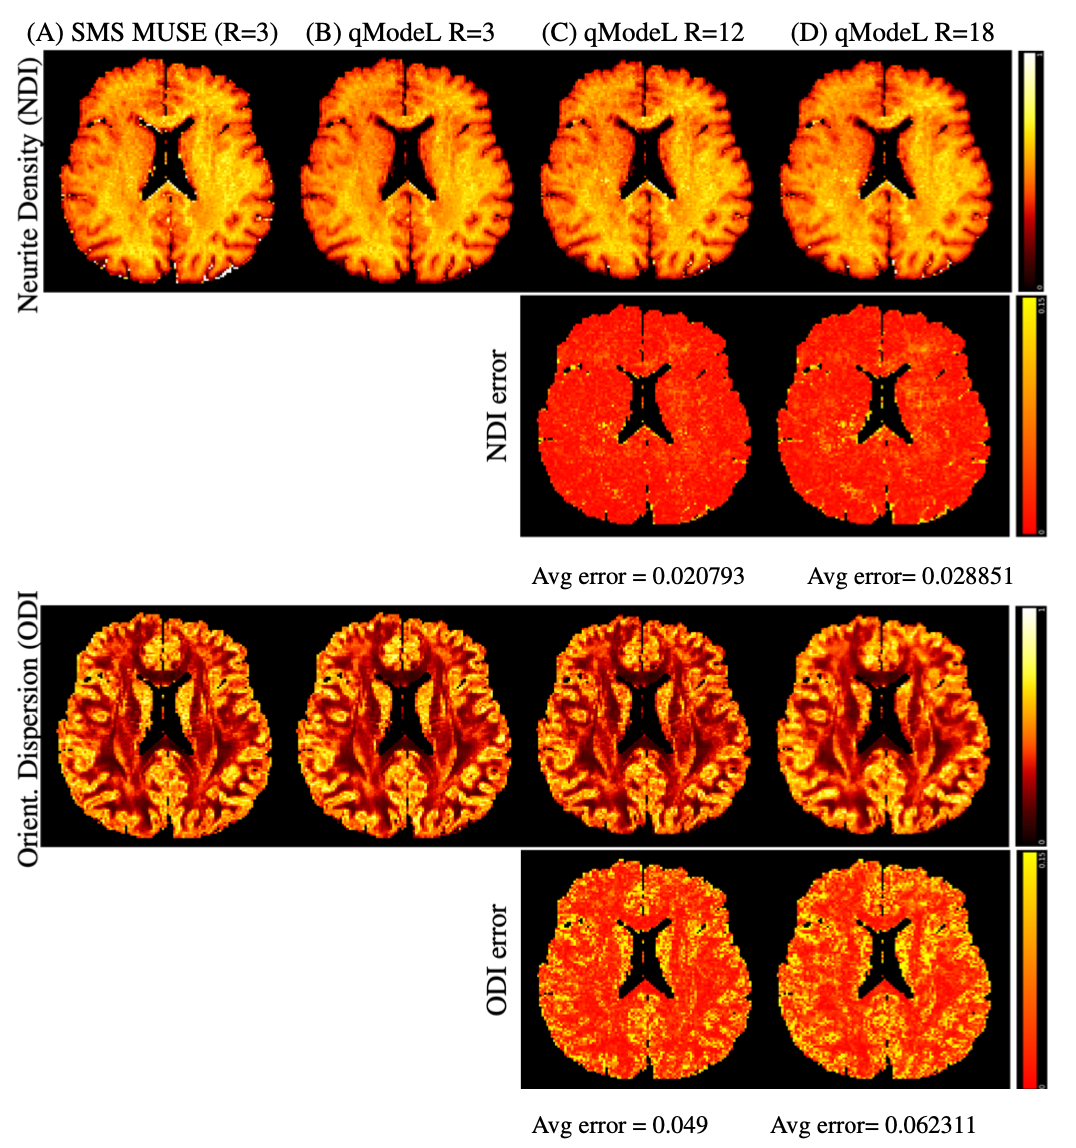
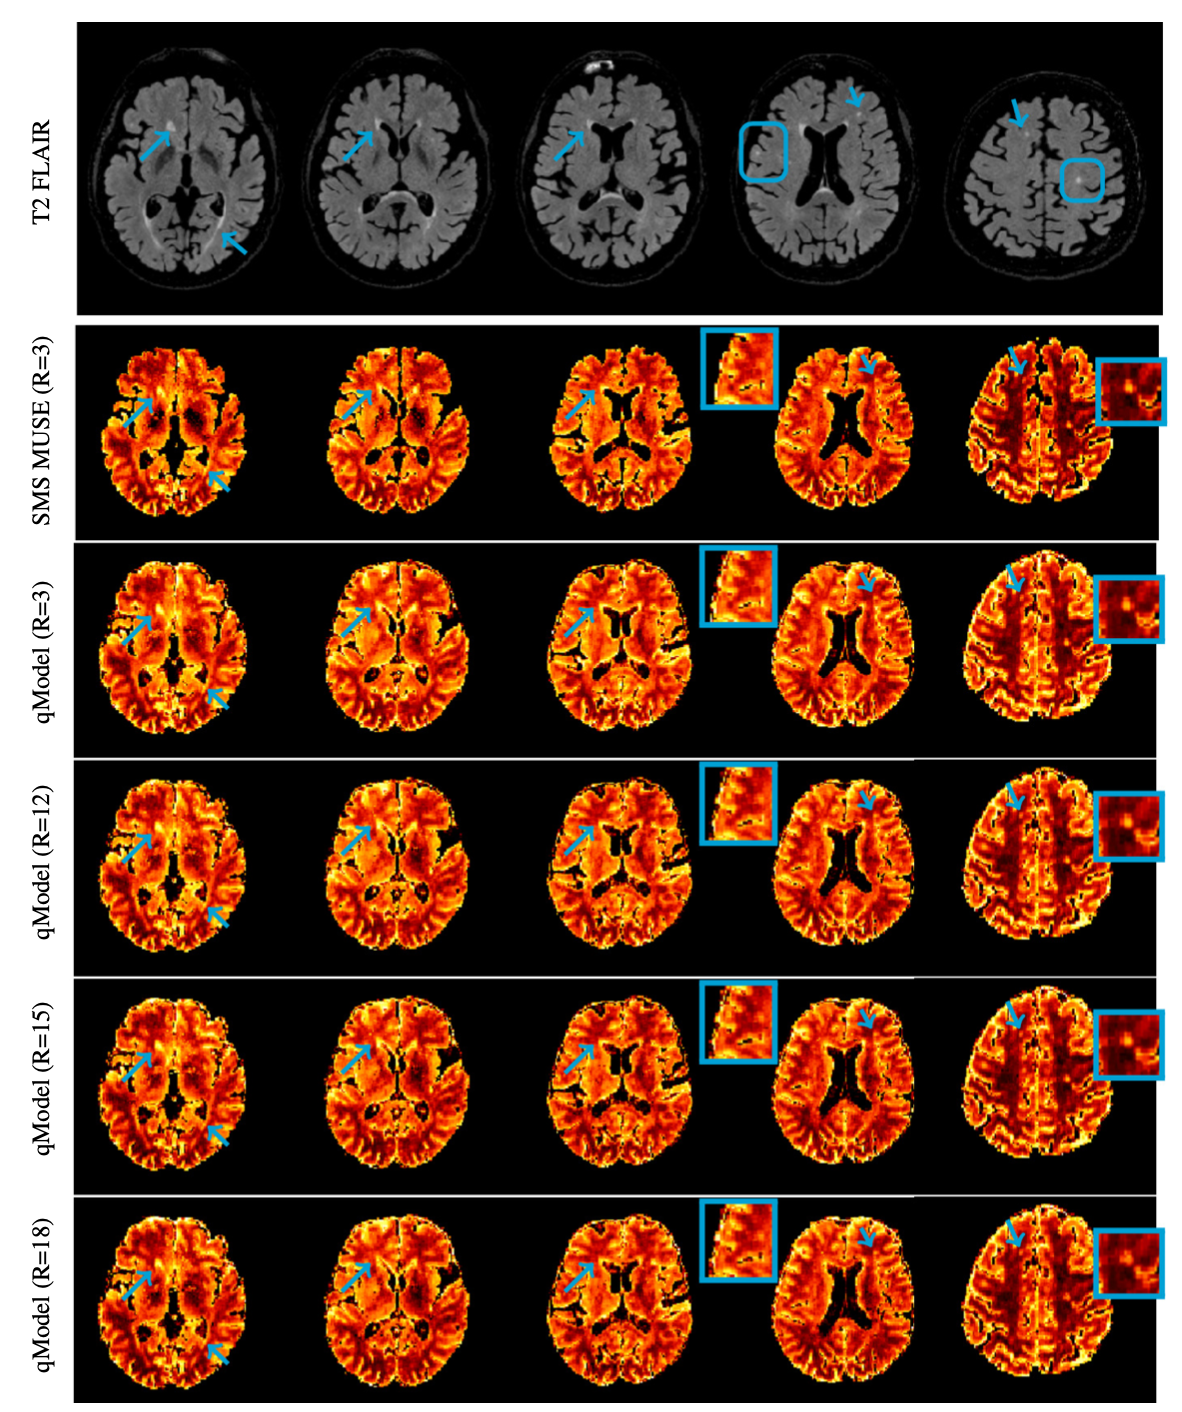
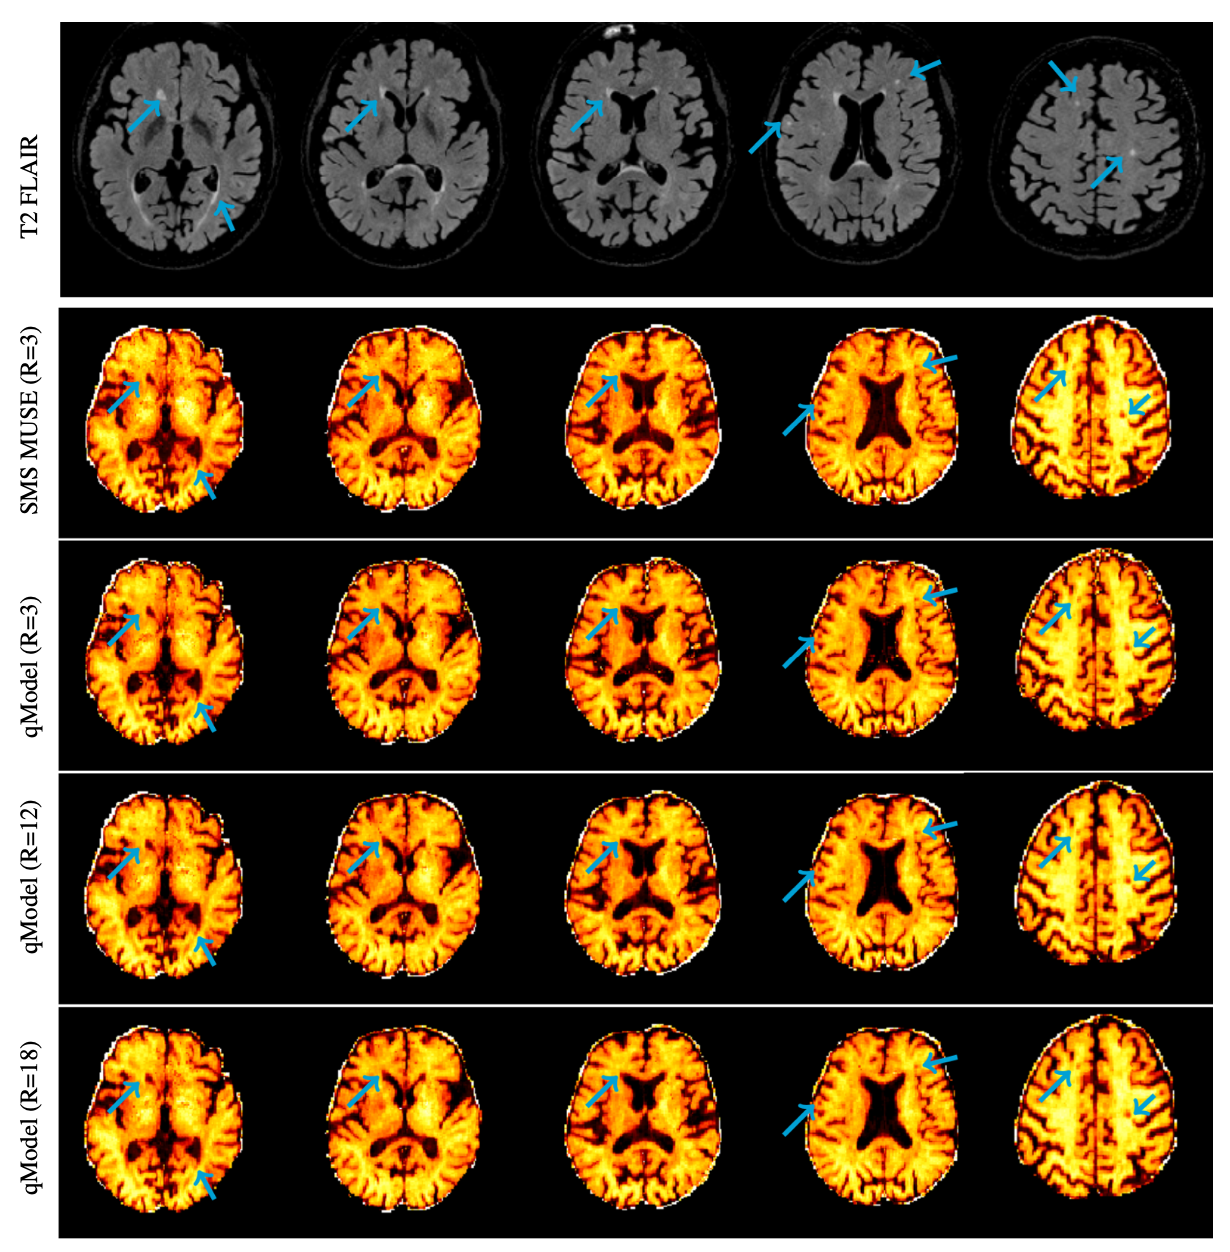
Figures 2-3 show the reconstruction of the single-shell experiments using $$$\mathcal D_{\Theta_1}$$$ from various acquisition settings for datasets 1-2. Figure 2 shows the reconstruction of dataset 1 (3T; healthy) using traditional approaches, and the qModeL reconstruction at R=3, 12. Figure 3 shows the microstructural parameter maps from various accelerations of dataset 2 (7T; displays a large lesion). A comparison of the maps derived from traditional methods is also provided.Figures 4-5 show the reconstruction of multi-shell data using $$$\mathcal D_{\Theta_2}$$$. The same DAE was utilized to test accelerations of R=3,12,15 and 18 for dataset 3, and dataset 4. Figures 6-7 show the microstructural maps corresponding to the NODDI model, derived from dataset 4, a subject with multiple sclerosis. The parameter maps derived from the DL reconstruction closely resemble DL-free methods. The root-mean-squared error (RMSE) arising from under-sampling is noted to be <2% in all experiments, in comparison to a reference with no under-sampling.
Discussion
In addition to the complex recovery of under-sampled data, qModeL can also be employed for the denoising of magnitude-only q-space data from various acquisition settings. Extension of the method to the spherical harmonics domain was recently demonstrated, which enables the same DAE to be used for the recovery of various q-space settings also. However, re-training is typically required when the b-value of the test data does not match the b-value of the training data. Notably, the re-training of qModeL can be easily performed using numerical methods as opposed to in-vivo experiments, which keeps the training data demands very convenient for routine utilization of the method.We proposed a flexible DL framework for the recovery of diffusion-based microstructural parameters from under-sampled data, that is generalizable across healthy and unhealthy populations, similar to a traditional model-based iterative reconstruction.
Acknowledgements
Financial support for this study was provided by grants 1R01EB031169, R01AG067078, 1R01EB022019- 01A, and 1 I01 RX002987. This work was conducted on MRI instruments funded by 1S10OD025025-01 and 1S10RR028821-01. This project was supported in part by a 2020 NARSAD Young Investigator Grant from the Brain & Behavior Research Foundation.References
[1] Zhang, H., Schneider, T., Wheeler-Kingshott, C. A., & Alexander, D. C. (2012). NODDI: Practical in vivo neurite orientation dispersion and density imaging of the human brain. NeuroImage, 61(4), 1000–1016. https://doi.org/10.1016/j.neuroimage.2012.03.072
[2]Novikov, D. S., Kiselev, V. G., & Jespersen, S. N. (2018). On modeling. Magnetic Resonance in Medicine, 79(6), 3172–3193. https://doi.org/10.1002/mrm.27101
[3]Golkov, V., Dosovitskiy, A., Sperl, J. I., Menzel, M. I., Czisch, M., Samann, P., Brox, T., & Cremers, D. (2016). q-Space Deep Learning: Twelve-Fold Shorter and Model-Free Diffusion MRI Scans. IEEE Transactions on Medical Imaging, 35(5), 1344–1351. https://doi.org/10.1109/TMI.2016.2551324
[4] Mani, M., Magnotta, V. A., & Jacob, M. (2021). qModeL: A plug‐and‐play model‐based reconstruction for highly accelerated multi‐shot diffusion MRI using learned priors. Magnetic Resonance in Medicine, 86(2), 835–851. https://doi.org/10.1002/mrm.28756
[5] Herbst, M., Deng, W., Ernst, T., & Stenger, V. A. (2017). Segmented simultaneous multi-slice diffusion-weighted imaging with generalized trajectories. Magnetic Resonance in Medicine, 78(4), 1476–1481. https://doi.org/10.1002/mrm.26545
[6]Mani, M., Jacob, M., McKinnon, G., Yang, B., Rutt, B., Kerr, A., & Magnotta, V. (2020). SMS MUSSELS: A navigator-free reconstruction for simultaneous multi-slice-accelerated multi-shot diffusion-weighted imaging. Magnetic Resonance in Medicine, 83(1), 154–169. https://doi.org/10.1002/mrm.27924
Figures