0511
DEXSY can measure water exchange linked to cellular homeostasis and active states in central nervous system tissue1National Institute of Child Health and Human Development, Potomac, MD, United States, 2National Institute of General Medical Sciences, Potomac, MD, United States, 3Department of Clinical Neurosciences, Wellcome Centre for Integrative Neuroimaging, FMRIB, University of Oxford, Oxford, United Kingdom, 4National Institute of Neurological Disorders and Stroke, Potomac, MD, United States
Synopsis
We propose a new functional MR method based on steady-state transmembrane water exchange rate measurements with diffusion exchange spectroscopy (DEXSY). Rapid DEXSY methods are implemented on a low-field MR system with a strong static gradient to test for an active component of water exchange in ex vivo neonatal mouse spinal cords. Temperature-dependent Arrhenius activation energies for water exchange are significantly greater in viable “live” samples than in the same samples after fixation, suggesting a connection to ATP-driven enzymatic processes. Moreover, exchange rates in live samples significantly decrease after blocking Na+/K+-ATPase pump activity, revealing an active component of water exchange.
Introduction
A holy grail in neuroscience and neuroradiology is in developing fMRI methods to interrogate the brain "at the speed of thought", which would require MR acquisitions that are orders of magnitude more rapid than conventional fMRI methods provide, and with higher spatial resolution, as well. Moreover, to follow long-time functional changes, in contrast to BOLD or Diffusion fMRI, which depend on fractional signal changes, there is a need for an fMRI method to be quantitative—based on an absolute metric, in order to be able to characterize homeostatic steady-state conditions that underlie physiological or pathological activity.1 Bai et al., observed transmembrane water exchange associated with cellular activity2 and homeostasis3 in ex vivo rat brain cortical cultures using Dynamic Contrast Enhanced (DCE) MRI. Springer suggested that the total exchange rate k is a sum of parallel passive kp and active ka exchange rates, and that k is an absolute metric of cellular-scale water exchange averaged over the voxel or MR-active region.4 These previous studies provided a proof of principle that water exchange rate imaging could offer the sensitivity to cellular-scale activity and steady-state homeostasis which current fMRI methods lack. However, DCE requires exogenous contrast agents, usually containing gadolinium, which typically cannot pass the blood-brain barrier (BBB), and are increasingly associated with some forms of toxicity5 and environmental contamination6. Alternatively, double diffusion encoding or double pulsed-field gradient (dPFG) methods based on diffusion exchange spectroscopy (DEXSY)7 measure the exchange rate solely of endogenous water, by exploiting the difference in water mobility between intra- and extracellular (and other) microenvironments.8,9 In this study, we test the hypothesis that cellular activity is linked to water exchange and can be measured by DEXSY methods.Methods
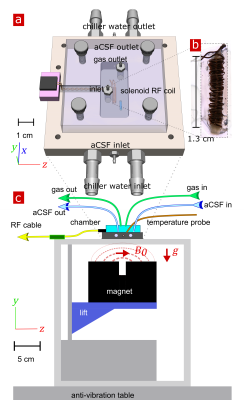
Ex vivo neonatal mouse spinal cords were used, either in a “live” viable state or after fixation with 4% paraformaldehyde,10 to remove in vivo confounds of testing fMRI methods such as blood flow and motion11. Measurements were performed at 13.79 MHz with a low-field single-sided magnet (PM-10 NMR MOUSE, Magritek)12 and custom-built RF probe and solenoid coil (Fig. 1).10 Diffusion was encoded on sub-micron length scales (defined by the dephasing length ($$$l_g=(D_0/\gamma g)^{1/3}=800$$$ nm at 25°C) and sub-millisecond timescales with spin echoes in the presence of a large static gradient (SG) $$$g=15.3$$$ T/m.13 SG diffusion measurements (as in Ref. [10]) and SG DEXY-based exchange rate and spin-lattice relaxation rate measurements (as in Ref. [14], with b1+b2=4.5 ms/µm2) were repeatedly acquired (11 minutes per set) to observe real-time changes. Sample chambers were built to provide artificial cerebrospinal fluid (aCSF) and gas circulation (necessary for maintaining “live” sample viability) and temperature control (by circulating water baths). Measurements were performed at variable temperatures (three sets per temperature) on live (n=7) and fixed (n=6) spinal cords. The activation energy $$$E_a$$$ was estimated by fitting the exchange rates with an Arrhenius model, $$$k(T^{-1})=A exp(-E_a/RT)$$$ , where $$$T$$$ is the variable absolute temperature and $$$R$$$ is the ideal gas constant. Measurements were also performed on live (n=3) samples before and after blocking Na+/K+-ATPase pump activity with 100 µM ouabain.Results and Discussion
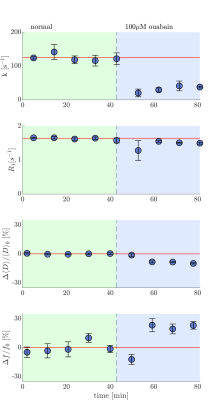
To test our hypothesis we compare the temperature dependence of the exchange rate between live and fixed tissue (Fig. 2a and b). Fixation is expected to increase the passive membrane permeability.15 We control for microstructural differences such as permeability by comparing the Arrhenius activation energy, $$$E_a$$$, between live and fixed samples.16 While of the passive (kp) component of k is expected to be similar between live and fixed samples, the live samples are expected to have an additional active (ka) component linked to enzymatic activity leading to a significantly greater $$$E_a$$$. For fixed samples, the $$$E_a$$$=21±8 kJ/mol (mean±SD), consistent with passive water permeability through membranes with pores.16 For live samples, the $$$E_a$$$=36±7 kJ/mol (Fig. 2c and d) was significantly higher in comparison to fixed samples (p=0.005), indicating the dependence of water exchange on active cellular processes. The Na+/K+-ATPase pump accounts for 50% of ATP utilization in the CNS17 and its activity shows strong temperature dependence18. Previous DCE studies indicate the presence of active water exchange linked to Na+/K+-ATPase activity.4 We compare the exchange rate in live samples before and after blocking Na+/K+-ATPase activity with 100 µM ouabain and see in real-time the exchange rate decrease from 120 s-1 to 40 s-1 (Fig. 3). If k=kp+ka, this indicates that kp is at most 1/3 of k and that ka accounts for at least 2/3 of k (Fig. 4). The k of fixed samples is twice the k of live samples after ouabain treatment, consistent with observations by Shepherd et al., that fixation increases passive membrane permeability.15Conclusion
Water exchange linked to active cellular processes is measured in a live ex vivo CNS tissue model. Static gradient DEXSY-based methods implemented on a low-field MR system are sensitive enough to detect k~100 s-1, a temporal resolution orders of magnitude faster than conventional fMRI and approaching “the speed of thought”. Values of k are highly consistent across specimen and change repeatably with different environmental conditions. k is an intrinsic, absolute measure of the homeostatic steady state. Unlike BOLD and diffusion fMRI,19 DEXSY is specific to water exchange. These findings open the door for diffusion exchange fMRI.Acknowledgements
NHW was funded by the NIGMS PRAT Fellowship Award # FI2GM133445-01. RR, TXC, and PJB were supported by the IRP of the NICHD, NIH. MF and MJO werefunded by the IRP of the NINDS.References
1. R. Rasmussen, J. O’Donnell, F. Ding, and M. Nedergaard, "Interstitial ions: A key regulator of state-dependent neural activity?," Progress in neurobiology, p. 101802, 2020.
2. R. Bai, C. S. Springer Jr, D. Plenz, and P. J. Basser, "Brain active transmembrane water cycling measured by MR is associated with neuronal activity," Magnetic resonance in medicine, vol. 81, no. 2, pp. 1280-1295, 2019.
3. R. Bai, C. S. Springer Jr, D. Plenz, and P. J. Basser, "Fast, Na+/K+ pump driven, steady‐state transcytolemmal water exchange in neuronal tissue: A study of rat brain cortical cultures," Magnetic resonance in medicine, vol. 79, no. 6, pp. 3207-3217, 2018.
4. C. S. Springer Jr, "Using 1H2O MR to measure and map sodium pump activity in vivo," Journal of Magnetic Resonance, vol. 291, pp. 110-126, 2018.
5. M. Rogosnitzky and S. Branch, "Gadolinium-based contrast agent toxicity: a review of known and proposed mechanisms," Biometals, vol. 29, no. 3, pp. 365-376, 2016.
6. V. Hatje, K. W. Bruland, and A. R. Flegal, "Increases in anthropogenic gadolinium anomalies and rare earth element concentrations in San Francisco Bay over a 20 year record," Environmental science & technology, vol. 50, no. 8, pp. 4159-4168, 2016.
7. P. Callaghan and I. Furo, "Diffusion-diffusion correlation and exchange as a signature for local order and dynamics," The Journal of chemical physics, vol. 120, no. 8, pp. 4032-4038, 2004.
8. I. Åslund, A. Nowacka, M. Nilsson, and D. Topgaard, "Filter-exchange PGSE NMR determination of cell membrane permeability," Journal of Magnetic Resonance, vol. 200, no. 2, pp. 291-295, 2009.
9. T. X. Cai, D. Benjamini, M. E. Komlosh, P. J. Basser, and N. H. Williamson, "Rapid detection of the presence of diffusion exchange," Journal of Magnetic Resonance, vol. 297, pp. 17-22, 2018.
10. N. H. Williamson et al., "Magnetic resonance measurements of cellular and sub-cellular membrane structures in live and fixed neural tissue," eLife, vol. 8, p. e51101, 2019.
11. R. Bai et al., "Simultaneous calcium fluorescence imaging and MR of ex vivo organotypic cortical cultures: a new test bed for functional MRI," NMR in Biomedicine, vol. 28, no. 12, pp. 1726-1738, 2015.
12. G. Eidmann, R. Savelsberg, P. Blümler, and B. Blümich, "The NMR MOUSE, a mobile universal surface explorer," Journal of Magnetic Resonance, Series A, vol. 122, no. 1, pp. 104-109, 1996.
13. N. H. Williamson et al., "Unprecedented diffusion weighting and exchange resolution of cellular and sub-cellular structures in live and fixed neural tissue," in Proceedings of the 28th annual International Society of Magnetic Resonance in Medicine (ISMRM), 2020.
14. N. H. Williamson et al., "Real-time measurement of diffusion exchange rate in biological tissue," Journal of Magnetic Resonance, vol. 317, p. 106782, 2020.
15. T. M. Shepherd, P. E. Thelwall, G. J. Stanisz, and S. J. Blackband, "Aldehyde fixative solutions alter the water relaxation and diffusion properties of nervous tissue," Magnetic Resonance in Medicine: An Official Journal of the International Society for Magnetic Resonance in Medicine, vol. 62, no. 1, pp. 26-34, 2009.
16. A. Verkman, "Water permeability measurement in living cells and complex tissues," The Journal of membrane biology, vol. 173, no. 2, pp. 73-87, 2000.
17. C. Howarth, P. Gleeson, and D. Attwell, "Updated energy budgets for neural computation in the neocortex and cerebellum," Journal of Cerebral Blood Flow & Metabolism, vol. 32, no. 7, pp. 1222-1232, 2012.
18. M. Esmann and J. C. Skou, "Temperature-dependencies of various catalytic activities of membrane-bound Na+/K+-ATPase from ox brain, ox kidney and shark rectal gland and of C12E8-solubilized shark Na+/K+-ATPase," Biochimica et Biophysica Acta (BBA)-Biomembranes, vol. 944, no. 3, pp. 344-350, 1988.
19. A. Darquié, J.-B. Poline, C. Poupon, H. Saint-Jalmes, and D. Le Bihan, "Transient decrease in water diffusion observed in human occipital cortex during visual stimulation," Proceedings of the National Academy of Sciences, vol. 98, no. 16, pp. 9391-9395, 2001.
Figures


