0510
Phase-based 3D diffusion mapping using RF phase-modulated gradient echo imaging1Radiology, University of Wisconsin-Madison, Madison, WI, United States, 2Biomedical Engineering, University of Wisconsin-Madison, Madison, WI, United States, 3Medical Physics, University of Wisconsin-Madison, Madison, WI, United States, 4Emergency Medicine, University of Wisconsin-Madison, Madison, WI, United States, 5Medicine, University of Wisconsin-Madison, Madison, WI, United States
Synopsis
A novel 3D diffusion mapping method using RF phase-modulated gradient echo imaging was developed by encoding diffusion weighting into signal phase. We developed closed form signal equations based on configuration theory. A four-pass acquisition and lookup table-based reconstruction is performed to estimate diffusion and T2 simultaneously. Simulation results revealed excellent agreement of signal magnitude and phase between Bloch equation and the developed equations. Phantom and in vivo studies demonstrated the feasibility of the proposed approach. These results demonstrate that the proposed method can enable qualitative and quantitative diffusion imaging with smaller gradient amplitude compared to the conventional diffusion-weighted imaging.
INTRODUCTION
Diffusion-weighted imaging (DWI) and quantitative diffusion imaging are indispensable tools for a plethora of research and clinical applications. Conventional DWI techniques rely on the use of diffusion encoding into the transverse magnetization using high amplitude diffusion gradients. As a result, current DWI methods have many challenges, including eddy currents, image distortion, ghosting, and chemical shift artifact.Recently, work by Wang et al.(1) has investigated the use of RF-modulated gradient echo (GRE) MRI for a phase-based T2 mapping approach. With GRE methods, the repeated application of imaging and spoiling gradients can lead to significant encoding of diffusion information into the coherent transverse magnetization, leading to diffusion weighting of the GRE signal phase.
Therefore, the purpose of this study is to propose a phase-based diffusion mapping (PBD) by encoding diffusion weighting into the phase of RF-phase modulated GRE signal, providing a novel method to measure the apparent diffusion coefficient (ADC) in 3D.
THEORY
In this study, we developed a closed form signal equation for the RF phase-modulated GRE based on Sobol’s approach(2). The RF phase modulation was performed by incrementing the transmit RF phase (φ) quadratically such that φ(n)=φ(n-1)+nθ, where θ is the RF phase increment. The signal with RF pulse with flip angle (FA) of α, RF phase of φ, and a repetition time of TR can be expressed as:$$S=\beta\eta X(-1)+j\cdot\beta [\eta^2-\epsilon(X(-1)-\epsilon)]\quad[1]$$
with
$$\beta=\frac{(1-Y(0)M_0 sin\alpha) )}{ (X(-1)-\epsilon)[X(-1)(cos\alpha-Y(0))+\epsilon(1-Y(0)cos\alpha)]-\epsilon^2(1-Y(0)cos\alpha)}\quad[2]$$
where $$$M_0$$$ is the proton density, and ε and η are real coefficients, determined by recursive calculation(2). X and Y are the T2 and T1 relaxation factors with diffusion terms(3) defined as
$$X(l)=e^{-\frac{t}{T2}}\cdot e^{-D\gamma^2G^2t^3(l^2+l+\frac{1}{3})}\quad[3]$$
$$Y(l)=e^{-\frac{t}{T1}\cdot e^{-D \gamma^2G^2t^3l^2}}\quad[4]$$
where t is the gradient pulse duration, D is diffusion coefficient, γ is the gyromagnetic ratio, l is the configuration(2). Equation 1 suggests that diffusion can be encoded into GRE signal phase in addition to T2.
Figure 1a plots the signal phase as a function of D and T2 with gradient amplitudes of 23.3 (upper) and 93.3Gauss/m (bottom), which correspond to 2π and 8π gradient moments for 1.0mm spatial resolution. For small θ, the signal phase with 8π moment is sensitive to diffusion coefficient while the phase highly depends primarily on T2 in case of 2π moment.
We adopted a four-pass acquisition (Figure 1b) and lookup table-based reconstruction as described in Figure 2. A small and a larger moments are used for the first/second- and third/fourth-pass acquisitions with RF phase modulation of ±θ. ADC and T2 are estimated using a lookup table calculated using the equation 1.
METHODS
We performed Bloch equation simulations with diffusion term, developed by Yarnykh et al.(4), to validate the closed form for the GRE signal introduced in this study. The simulation was implemented with variable diffusion coefficients of 1000-6000mm2/s.Phantom experiments were performed to provide preliminary evaluation of the proposed PBD approach to measure diffusion and T2. A phantom comprised of 16 vials was constructed, using varying concentrations of PVP (10-50%) and MnCl2 (0.01-0.08mM) in order to modulate the diffusion coefficient and T2.
Image acquisition was performed on a clinical 3.0T MRI system (Signa Premier, GE Healthcare, Waukesha, WI) with a 48-channel head coil. For reference values, ADC and T2 mapping were performed using spin-echo (SE) and PROPELLER SE diffusion-weighted imaging (DWI).
Volunteers, recruited from an IRB approved database, were imaged using PBD and SE-DWI using two MPG axes of AP and RL directions to visualize diffusion anisotropy. Also, diffusion-weighted images were generated from PBD by subtracting the phase from the third- and fourth-pass images(5). Acquisition parameters are shown in Table 1.
RESULTS
Figure 3a plots the phase response obtained using Bloch equation simulations compared to the equations developed in the Theory section. As shown, excellent agreement between the Bloch equation simulations and the proposed closed form solutions validates the accuracy of the theoretically developed equations.Figure 3b shows ADC and T2 maps of the phantoms obtained using conventional and PBD methods. Figure 3c plots ADC and T2 values measured from the phantom, compared with conventional ADC and T2 mapping. Excellent agreement is identified between conventional imaging and the PBD method.
Figure 4a shows ADC maps using PBD and SE-DWI methods. Also, diffusion-weighted images are shown in Figure 4b. These results suggested the proposed method successfully depicted anisotropy of the brain structure.
DISCUSSION
In this work, we have successfully developed a novel RF-phase modulated qualitative diffusion method using an RF-modulated 3D GRE acquisition. Simulation, phantom, and in vivo studies demonstrate the feasibility of the proposed equations and mapping approach.Further implementation and validation of these methods may provide an important alternative to conventional EPI-based DWI. Current DWI techniques require expensive, high performance, gradient hardware necessary to encode diffusion weighting. The proposed approach enables encoding of diffusion information using low gradient amplitude compared to conventional methods.
There are several limitations of the proposed approach to be addressed. First, unbalanced GRE-based methods have some sensitivity to motion, which could corrupt the steady-state signal. The second major limitation may be difficulty in encoding diffusion for short T2 species, similar to EPI-based methods.
In conclusion, we have successfully developed and demonstrated the feasibility of a novel RF-phase modulated 3D GRE method for confounder-corrected simultaneous measurement of quantitative ADC and T2.
Acknowledgements
The authors acknowledge support from GE Healthcare who provides research support to the University of Wisconsin-Madison. Finally, Dr. Reeder is a Romnes Faculty Fellow, and has received an award provided by the University of Wisconsin-Madison Office of the Vice Chancellor for Research and Graduate Education with funding from the Wisconsin Alumni Research Foundation.References
1. Wang X, Hernando D, Reeder SB. Phase‐based T2 mapping with gradient echo imaging. Magnetic Resonance in Medicine 2019.
2. Sobol WT, Gauntt DM. On the stationary states in gradient echo imaging. Journal of Magnetic Resonance Imaging 1996;6(2):384-398.
3. Vlaardingerbroek MT, Boer JA. Magnetic resonance imaging: theory and practice: Springer Science & Business Media; 2013.
4. Yarnykh VL. Optimal radiofrequency and gradient spoiling for improved accuracy of T1 and B1 measurements using fast steady‐state techniques. Magnetic Resonance in Medicine: An Official Journal of the International Society for Magnetic Resonance in Medicine 2010;63(6):1610-1626.
5. Tamada D, Field AS, Reeder SB. Simultaneous T1- and T2-Weighted 3D MRI Using RF Phase-Modulated Gradient Echo Imaging. Magnetic Resonance in Medicine 2021;Accepted on October 25, 2021.
Figures
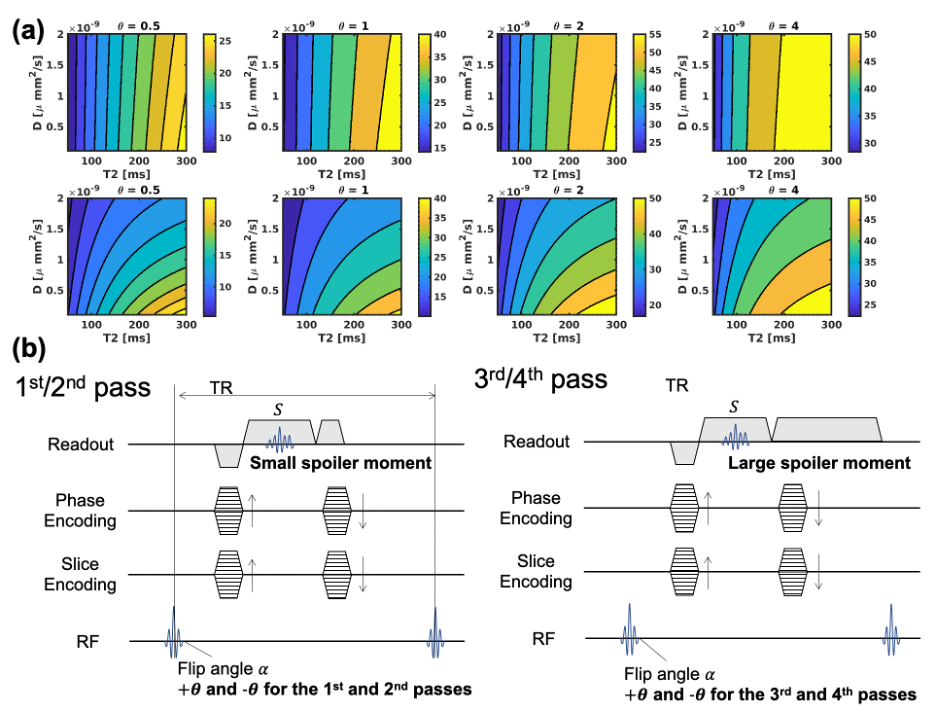
Figure 1 (a) Plots of signal phase calculated using the developed equations, as a function of T2 and diffusion with varying θ. T1 and T2 of 1000 and 100ms are assumed in this simulation. The signal phase with gradient moment of 2π highly depends on T2 whereas gradient moment of 8π provides diffusion weighting to signal phase in case of small RF phase increments. (b) Pulse sequence diagram proposed in this study. Each pass has opposite polarity of RF phase increments of ±θ. For the third and fourth passes, higher gradient moment, such as 8π, is used to encode diffusion weighting.
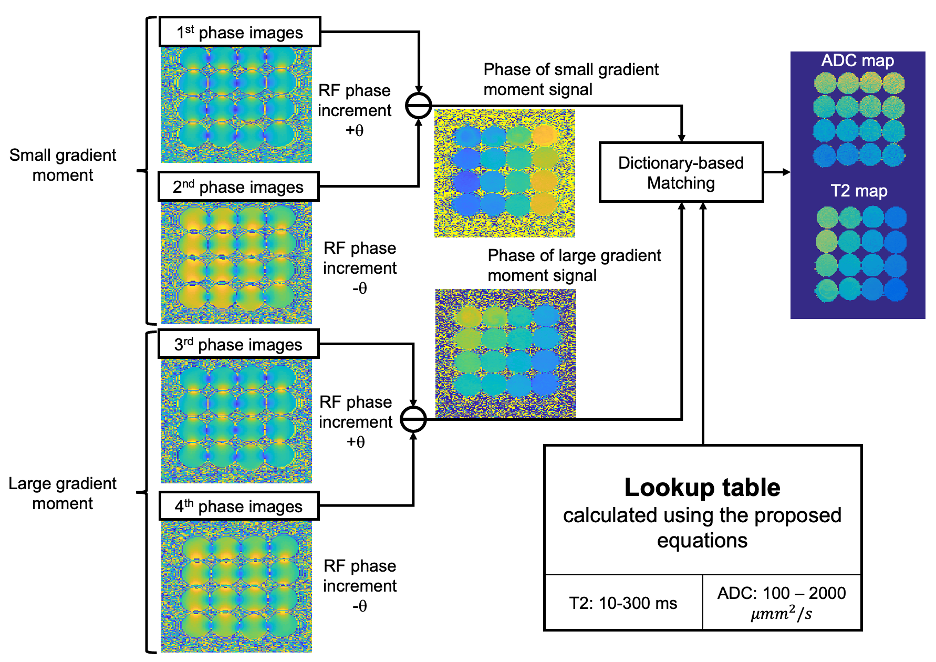
Figure 2 Reconstruction algorithm developed in this study. The phase of the signal with small gradient moment is calculated by subtracting between the first- and second- pass image phases. The phase for large gradient moment, which has diffusion weighting, can be obtained by subtracting between the third- and fourth-pass image phases. ADC and T2 maps can be estimated simultaneously using the derived phases and lookup table calculated using the developed equations in this study.
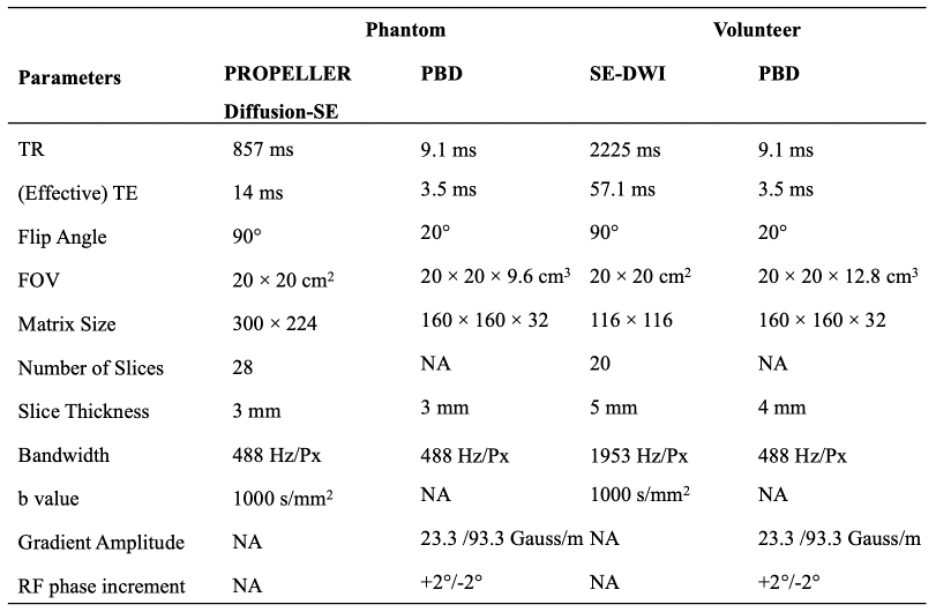
Table 1 Acquisition parameters for the phantom and volunteer studies.
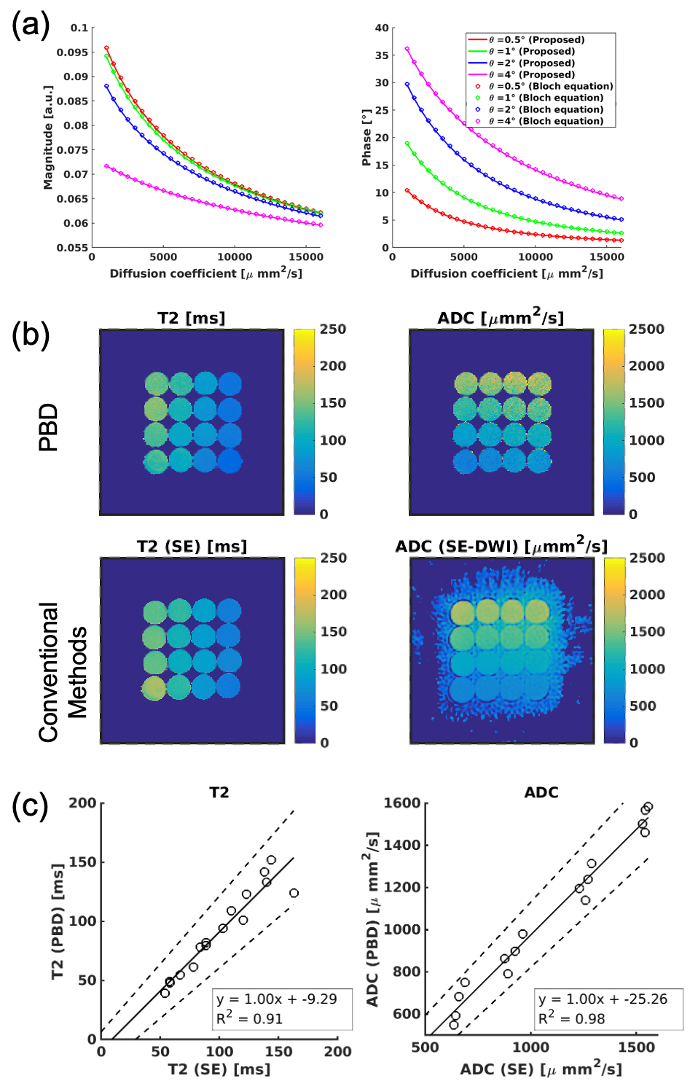
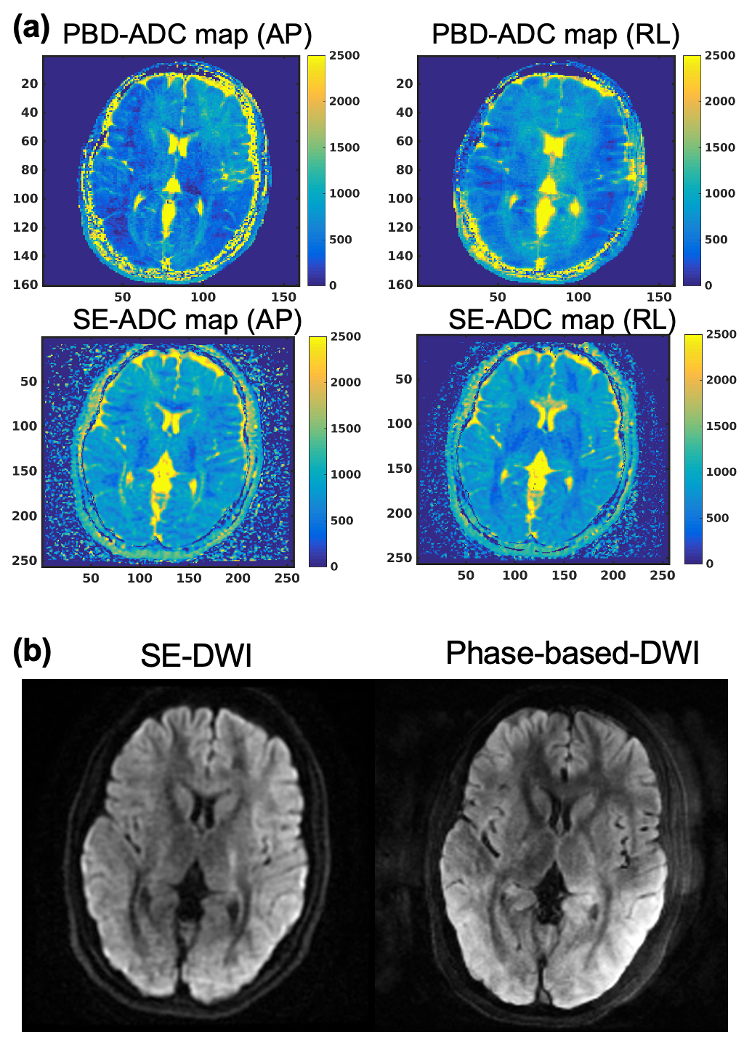
Figure 4 (a) ADC maps and (b) diffusion-weighted images acquired using SE-DWI and PBD. The diffusion-weighted image using PBD was calculated by subtracting between the third- and fourth-pass images. Anisotropy of the brain structure can be seen in both SE-DWI and PBD methods although slight motion artifacts were observed with the PBD technique.