0509
Separating Tissue Components in Ex-vivo Mouse Brain with Joint Diffusion-Relaxation MRI and InSpect1Centre for Medical Image Computing, Department of Computer Science, University College London, London, United Kingdom, 2Champalimaud Research, Champalimaud Centre for the Unknown, Lisbon, Portugal
Synopsis
We identify and map intra-voxel tissue components in the mouse brain by applying InSpect, a data-driven approach for quantitative MRI analysis, to high resolution ex-vivo T2-diffusion MRI. Our approach reveals distinct tissue microenvironments with minimal model assumptions, revealing features that cannot be seen in diffusion kurtosis maps.
Introduction
Diffusion-relaxation MRI is an emerging tool for investigating tissue composition[1]. Jointly accounting for relaxation and diffusion effects, such as using multiple echo times (TEs) preceded by a diffusion weighting, can increase sensitivity and specificity to tissue microenvironments, particularly when paired with suitable analysis methods. Such methods include extended multi-compartment analyses incorporating the two decays (diffusion and relaxation), as demonstrated in white matter[2–4]. Alternative, data-driven analysis approaches can calculate multidimensional correlation spectra, e.g. for T2-diffusion[5,6], T1-diffusion[7], and T1-T2-diffusion[8] in brain tissue. These methods have revealed, for example, increased sensitivity to axonal injury[9]. However, these techniques require voxelwise spectral estimation, which is highly sensitive to noise. Spatial regularisation[5] and utilizing marginal distributions[10] can reduce this sensitivity, but both rely on manually defining regions of the spectral domain to produce tissue maps. A recent technique automatically identifies these spectral integration regions[11], but still relies on voxelwise spectral estimation.In this work, we acquire a rich ex-vivo mouse brain T2-diffusion dataset, then utilise InSpect, a data-driven technique that shares information across voxels, to automatically identify and map canonical spectral components, demonstrating automatic fine-grained separation and mapping of subvoxel tissue components.
Methods
All animal experiments were preapproved by the competent national and international authorities and were carried out according to EU Directive 2010/63. A mouse brain was extracted from an adult mouse by standard intracardiac PFA perfusion and preserved in a PBS solution at 4°C, then mounted in a 10mm NMR tube filled with fluorinert and scanned at 37°C on a 16.4T scanner equipped with a microimaging coil capable of producing up to 3000 mT/m in all directions.T2-diffusion data was collected by varying b-values and echo times in a 2D grid using a diffusion weighted multi-spin-echo sequence (https://remmi-toolbox.github.io/), with 11 b-values from 0-10,000 s/mm$$$^2$$$, 38 TEs between 10.7-110.6 ms, and 20 gradient directions for each b-TE pair, yielding a total of 8208 volumes. Other scanning parameters were: TR=4 s, 1 average, slice thickness=0.5 mm, 27 slices, in plane resolution=0.1×0.1 mm$$$^2$$$, FOV=10×8 mm$$$^2$$$, diffusion time=5.6 ms, gradient duration=3.5 ms. The total scan time was 16h.
The data was MP-PCA denoised[12] and signal fluctuations due to minor stimulated echoes were corrected. Diffusion kurtosis tensor metrics, including mean diffusivity (MD) and fractional anisotropy (FA), were calculated voxelwise from the subset of the data with the lowest TE (all b-values and gradient directions were included) using MRtrix3 [13]. We also fit a single compartment T2 model to the b=0 data. We then automatically extracted approximate white matter (FA>0.5, MD<0.0004 mm$$$^2$$$/s, T2<0.03 s), grey matter (FA<0.2, MD<0.001 mm$$$^2$$$/s, T2>0.03 s), and CSF (FA<0.2, MD>0.001 mm$$$^2$$$/s, T2>0.03 s) masks by thresholding the FA, MD, and T2 maps.
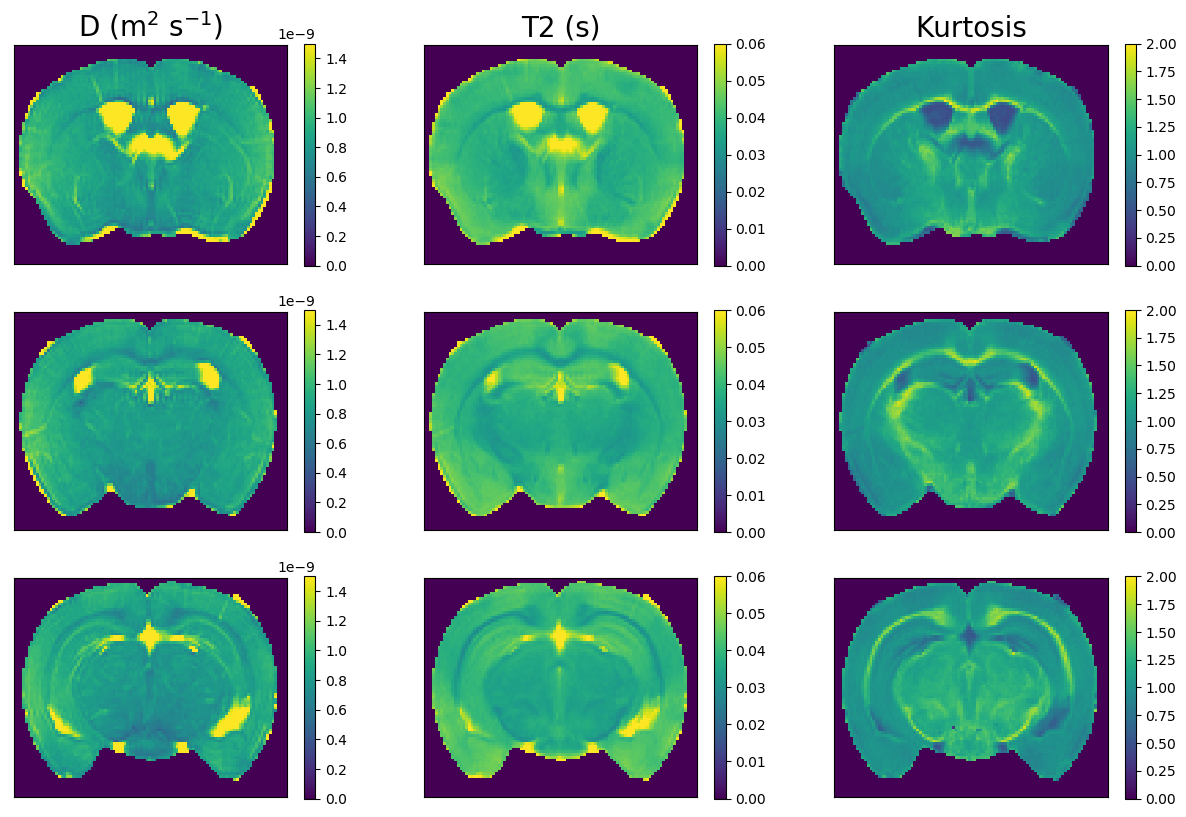
We calculated powder averaged (PA) data at each b-TE combination, then calculated the T2-D spectrum for the PA signal averaged in each mask, as in[14]. We also fit a combined mean signal kurtosis-T2 model to the subset of the PA data with b$$$\leq$$$3000 s/mm$$$^2$$$ by adapting[15], i.e.
$$S(b,T_E)=S_0\exp(-bD+b^2D^2K/6)\exp(-T_E/T_2)$$
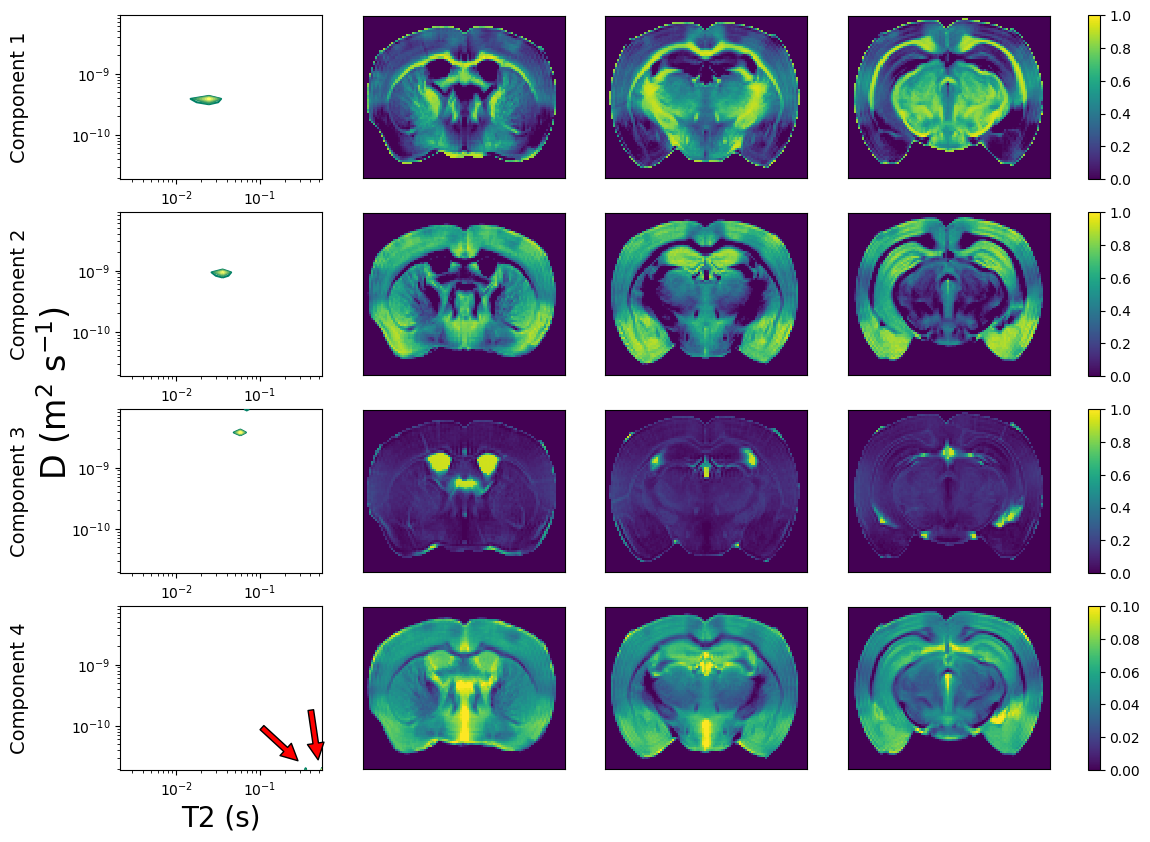
Finally, we applied the InSpect algorithm[16] – with four components – to the whole PA signal, and hence automatically identified four canonical components within the dataset, their T2-D spectra and corresponding maps.
Results
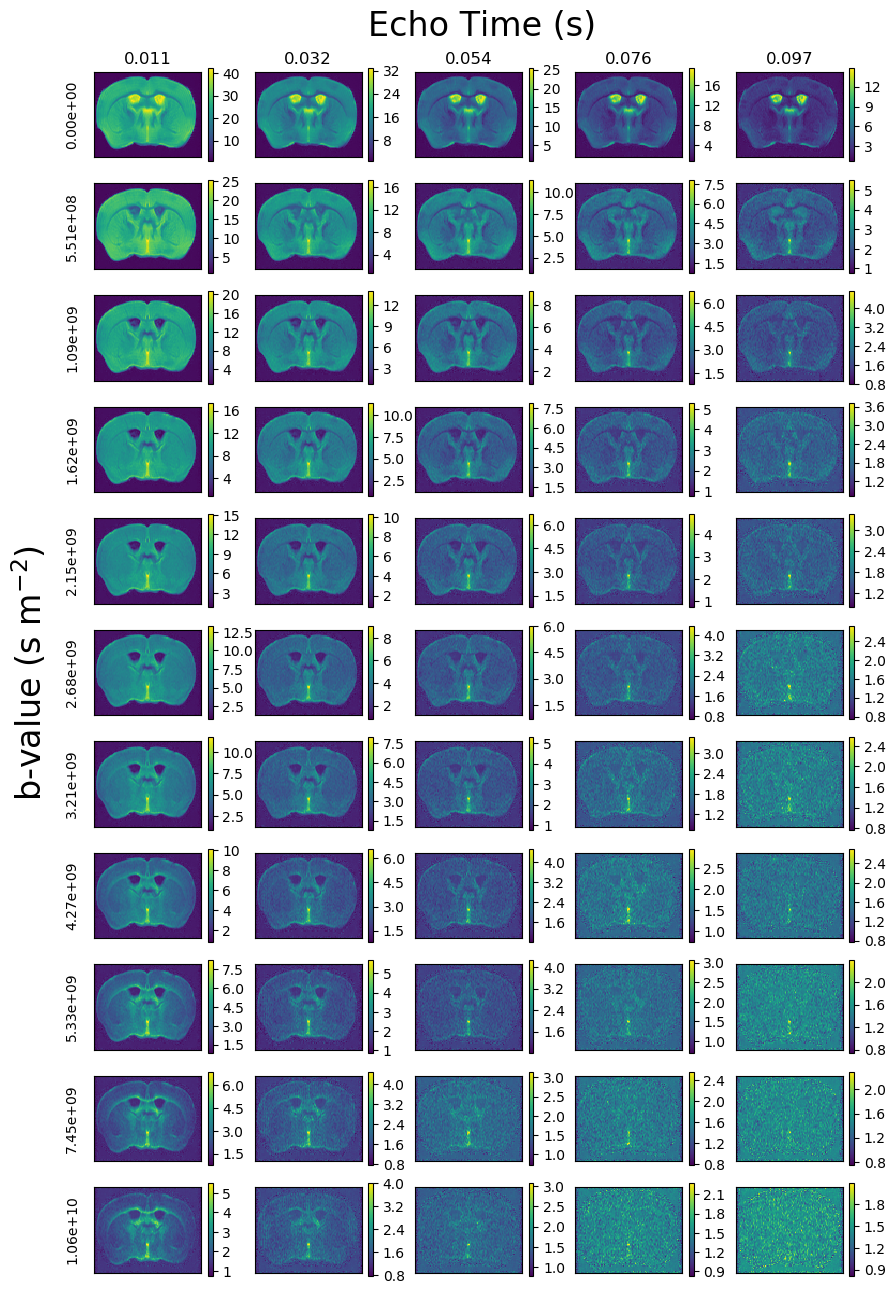
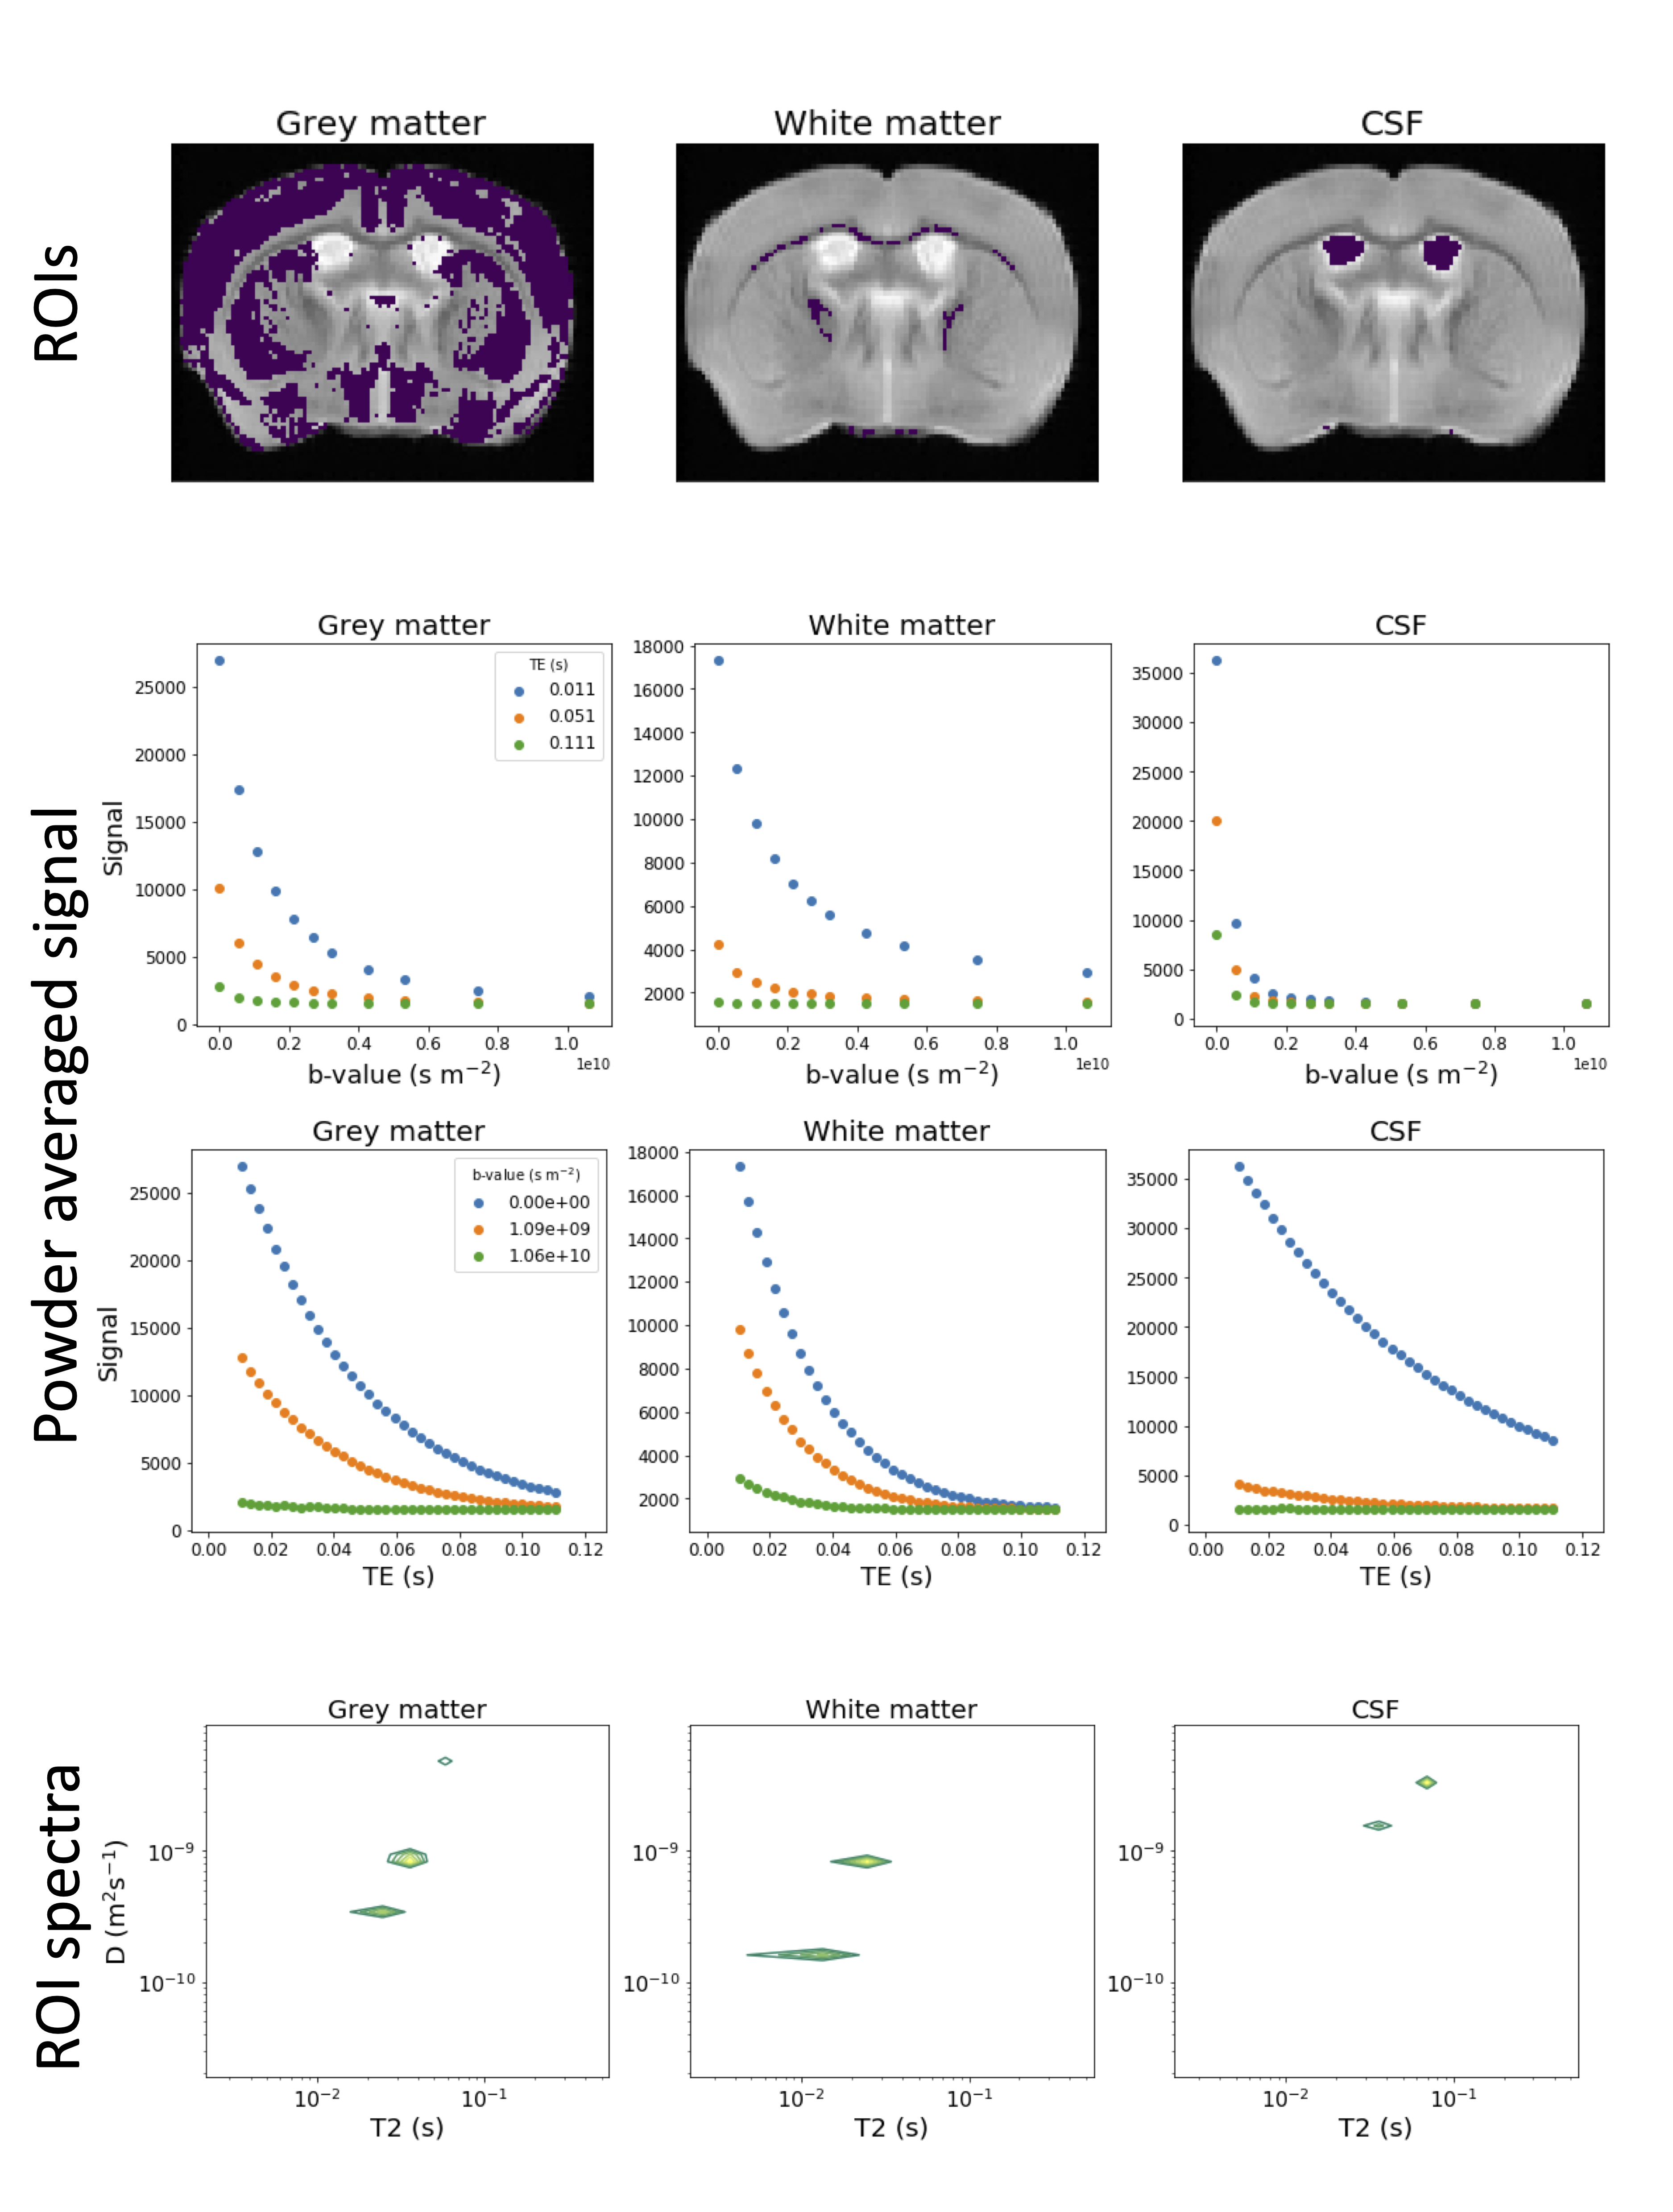
Figure 1 shows PA signal maps for all b-values and five TEs. The data reveals expected characteristics of tissue types - white matter is clear in high b-value data and CSF is prominent at high TEs.Figure 2 shows maps, PA signal and derived T2-D spectra for the automatically extracted masks. All three ROI-averaged spectra contain distinct peaks, likely reflecting multiple tissue microenvironments, although the two peaks in the CSF spectra are unexpected and could reflect partial volumes.
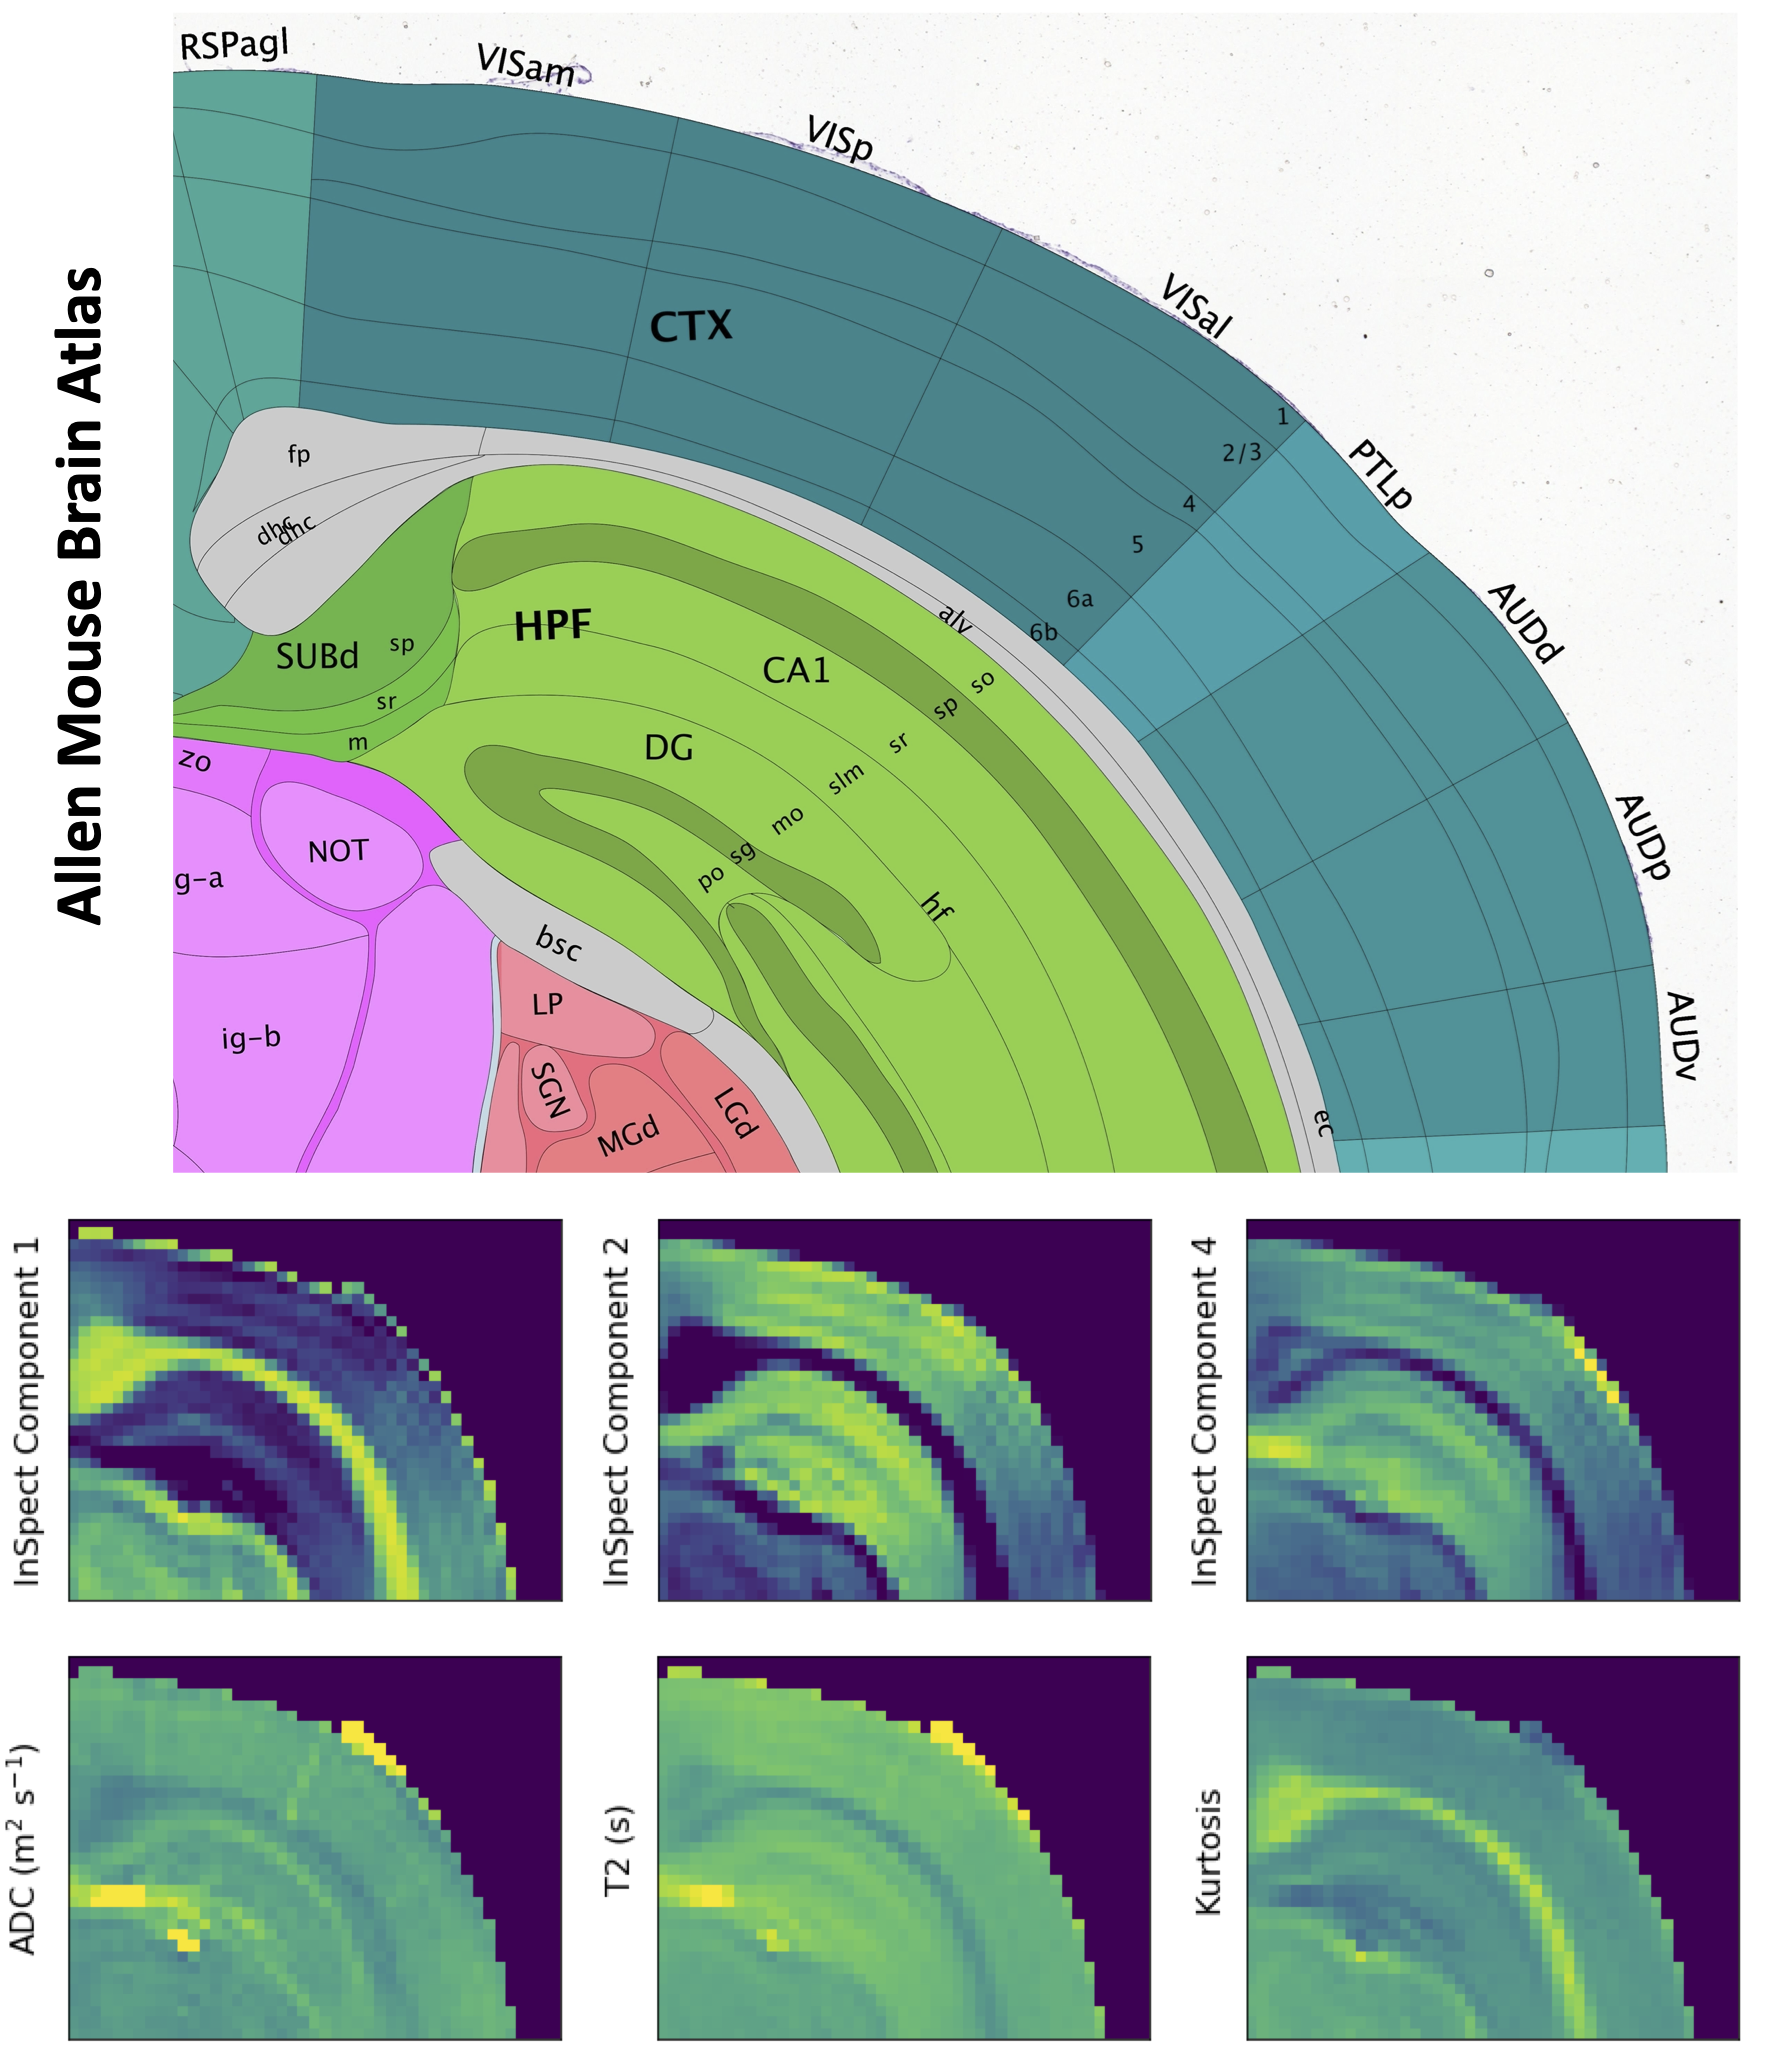
Figure 3 shows mean signal kurtosis-T2 maps. Figure 4 shows the InSpect spectra and maps, and Figure 5 compares with a reference atlas [17]. InSpect maps reveal features that cannot be seen in T2-kurtosis maps, such as cortical layers.
Discussion
InSpect reveals tissue microenvironments whilst making minimal assumptions on tissue composition. We can hypothesise on which tissue environment each InSpect component represents based on spectral properties and weighting maps, although we emphasise the need for independent validation. We observe:- InSpect component 1 has T2~25ms and D~4×10$$$^{-10}$$$ m$$$^2$$$/s and is prominent in white and grey matter, potentially reflecting water residing in small structures, e.g. axons or cell bodies.
- Component 2 has T2~35ms, D~1×10$$$^{-9}\;$$$m$$$^2$$$/s and is prominent in grey matter, so may reflect water in tortuous extracellular spaces.
- Component 3 has T2~70ms, D~3×10$$$^{-9}\;$$$m$$$^2$$$/s and is prominent in ventricles, so likely reflects free water.
- The component 4 spectra is at the lower right limit of the spectral grid (long T2, low D) and is prominent outside white matter areas. Its voxelwise weightings are much lower than the other components. It may reflect trapped water, akin to a dot compartment[18], but is likely also affected by the Rician noise floor.
Conclusion
We demonstrate separation of intra-voxel tissue components without imposing a biophysical model by pairing a high resolution, high field T2-diffusion acquisition with a data-driven spectral approach. In future we will compare our InSpect approach with multi-compartment models that quantify cell bodies using high b-value data[19,20], by extending these models to account for multiple TEs.Acknowledgements
This work was supported by the EPSRC (EP/M020533/1, EP/V034537/1); the National Institute for Health Research (NIHR) Biomedical Research Centre at University College London Hospitals NHS Foundation Trust and University College London. This study was supported by funding from “la Caixa” Foundation (ID 100010434) and European Union’s Horizon 2020 research and innovation programme under the Marie Skłodowska-Curie grant agreement No. 847648, fellowship code CF/BQ/PI20/11760029. The views expressed are those of the authors and not necessarily those of the NHS, the NIHR or the Department of Health.References
1. Slator PJ, Palombo M, Miller KL, Westin CF, Laun F, Kim D, et al. Combined diffusion-relaxometry microstructure imaging: Current status and future prospects. Magn Reson Med. John Wiley & Sons, Ltd; 2021; 1–25. doi:10.1002/mrm.28963
2. Veraart J, Novikov DS, Fieremans E. TE dependent Diffusion Imaging (TEdDI) distinguishes between compartmental T2 relaxation times. Neuroimage. Elsevier Inc.; 2018;182: 360–369. doi:10.1016/j.neuroimage.2017.09.030
3. Gong T, Tong Q, He H, Sun Y, Zhong J, Zhang H. MTE-NODDI: Multi-TE NODDI for disentangling non-T2-weighted signal fractions from compartment-specific T2 relaxation times. Neuroimage. Elsevier Ltd; 2020;217: 116906. doi:10.1016/j.neuroimage.2020.116906
4. Lampinen B, Szczepankiewicz F, Mårtensson J, van Westen D, Hansson O, Westin CF, et al. Towards unconstrained compartment modeling in white matter using diffusion-relaxation MRI with tensor-valued diffusion encoding. Magn Reson Med. John Wiley and Sons Inc.; 2020; mrm.28216. doi:10.1002/mrm.28216
5. Kim D, Doyle EK, Wisnowski JL, Kim JH, Haldar JP. Diffusion-relaxation correlation spectroscopic imaging: A multidimensional approach for probing microstructure. Magn Reson Med. 2017;78: 2236–2249. doi:10.1002/mrm.26629
6. de Almeida Martins JP, Tax CMW, Szczepankiewicz F, Jones DK, Westin C-F, Topgaard D. Transferring principles of solid-state and Laplace NMR to the field of in vivo brain MRI. Magn Reson. Copernicus GmbH; 2020;1: 27–43. doi:10.5194/mr-1-27-2020
7. Reymbaut A, Critchley J, Durighel G, Sprenger T, Sughrue M, Bryskhe K, et al. Toward nonparametric diffusion-T1 characterization of crossing fibers in the human brain. Magn Reson Med. 2021;85: 2815–2827. doi:10.1002/mrm.28604
8. Benjamini D, Basser PJ. Magnetic resonance microdynamic imaging reveals distinct tissue microenvironments. Neuroimage. Elsevier Inc.; 2017;163: 183–196. doi:10.1016/j.neuroimage.2017.09.033
9. Benjamini D, Iacono D, Komlosh ME, Perl DP, Brody DL, Basser PJ. Diffuse axonal injury has a characteristic multidimensional MRI signature in the human brain. Brain. 2021;144: 800–816. doi:10.1093/brain/awaa447
10. Benjamini D, Basser PJ. Use of marginal distributions constrained optimization (MADCO) for accelerated 2D MRI relaxometry and diffusometry. J Magn Reson. 2016;271: 40–45. doi:10.1016/j.jmr.2016.08.004
11. Pas K, Komlosh ME, Perl DP, Basser PJ, Benjamini D. Retaining information from multidimensional correlation MRI using a spectral regions of interest generator. Sci Rep. 2020; 1–10. doi:10.1038/s41598-020-60092-5
12. Veraart J, Novikov DS, Christiaens D, Ades-aron B, Sijbers J, Fieremans E. Denoising of diffusion MRI using random matrix theory. Neuroimage. Elsevier Inc.; 2016;142: 394–406. doi:10.1016/j.neuroimage.2016.08.01613. Veraart J, Sijbers J, Sunaert S, Leemans A, Jeurissen B. Weighted linear least squares estimation of diffusion MRI parameters: Strengths, limitations, and pitfalls. Neuroimage. Academic Press; 2013;81: 335–346. doi:10.1016/j.neuroimage.2013.05.028
14. Slator PJ, Hutter J, Palombo M, Jackson LH, Ho A, Panagiotaki E, et al. Combined Diffusion-Relaxometry MRI to Identify Dysfunction in the Human Placenta. Magn Reson Med. John Wiley & Sons, Ltd; 2019; 1–22. doi:10.1002/mrm.27733
15. Henriques RN, Jespersen SN, Shemesh N. Microscopic anisotropy misestimation in spherical-mean single diffusion encoding MRI. Magn Reson Med. 2019;81: 3245–3261. doi:10.1002/mrm.27606
16. Slator PJ, Hutter J, Marinescu R V., Palombo M, Jackson LH, Ho A, et al. Data-Driven multi-Contrast spectral microstructure imaging with InSpect: INtegrated SPECTral component estimation and mapping. Med Image Anal. Elsevier B.V.; 2021;71: 102045. doi:10.1016/j.media.2021.102045
17. Lein ES, Hawrylycz MJ, Ao N, Ayres M, Bensinger A, Bernard A, et al. Genome-wide atlas of gene expression in the adult mouse brain. Nature. Nature Publishing Group; 2007;445: 168–176. doi:10.1038/nature05453
18. Tax CMW, Szczepankiewicz F, Nilsson M, Jones DK. The dot-compartment revealed? Diffusion MRI with ultra-strong gradients and spherical tensor encoding in the living human brain. Neuroimage. Academic Press Inc.; 2020;210: 116534. doi:10.1016/j.neuroimage.2020.116534
19. Palombo M, Ianus A, Guerreri M, Nunes D, Alexander DC, Shemesh N, et al. SANDI: A compartment-based model for non-invasive apparent soma and neurite imaging by diffusion MRI. Neuroimage. Academic Press Inc.; 2020;215: 116835. doi:10.1016/j.neuroimage.2020.116835
20. Gyori NG, Clark CA, Alexander DC, Kaden E. On the potential for mapping apparent neural soma density via a clinically viable diffusion MRI protocol. Neuroimage. Academic Press; 2021;239: 118303. doi:10.1016/j.neuroimage.2021.118303
Figures