0506
Design and Analysis of Field-of-View Independent k-space Trajectories for Magnetic Resonance Imaging1Internal Medicine II, Ulm University Medical Center, Ulm, Germany
Synopsis
The calculation of k-space trajectories in MRI usually involves prior knowledge of the FOV, since the desired FOV defines a minimum k-space sampling density. The reconstruction of a FOV, which is larger than what is represented by the primary sampling density, is equal to undersampling in k-space. Arising artefacts are strictly dependent on the underlying k-space trajectory which leads to advantages for k-space trajectories with low-coherent aliasing properties also for the combination with non-linear reconstruction techniques.Based on a generalised form of the Seiffert Spirals, this abstract describes a k-space trajectory that does not require prior commitment to an imaging FOV.
Introduction
Undersampling in the spatial frequency domain is a common method to shorten acquisition times in MRI. Thereby, the violation of Nyquist's theorem leads to the emergence of aliasing artefacts which are usually addressed with parallel or auto calibration methods and most commonly with Compressed Sensing (CS)1. Especially for three-dimensional applications, resulting long acquisition times often limit clinical applications. The main focus in trajectory design is therefore to achieve an efficient and low-discrepancy k-space coverage, which requires the construction of a sampling scheme that leads to an advantageous sampling point spread function (SPSF) for the undersampled case2,3. The common goal of all approaches is to realise a SPSF with a low-coherent energy distribution for nearly arbitrary undersampling, thus realising aliasing artefacts with a (noise-like) power spectrum.This abstract reports on the aliasing behaviour of a generalised form of the previously introduced Seiffert Spirals4, using Jacobi theta functions, which allow for a variety of highly adaptable k-space interleaves, while maintaining low-coherent sampling properties. This leads to a situation in which an MRI trajectory can be constructed without considering the desired imaging FOV. The trajectory is solely generated to meet a given resolution and sampling duration for a defined number of executed interleaves.
Methods
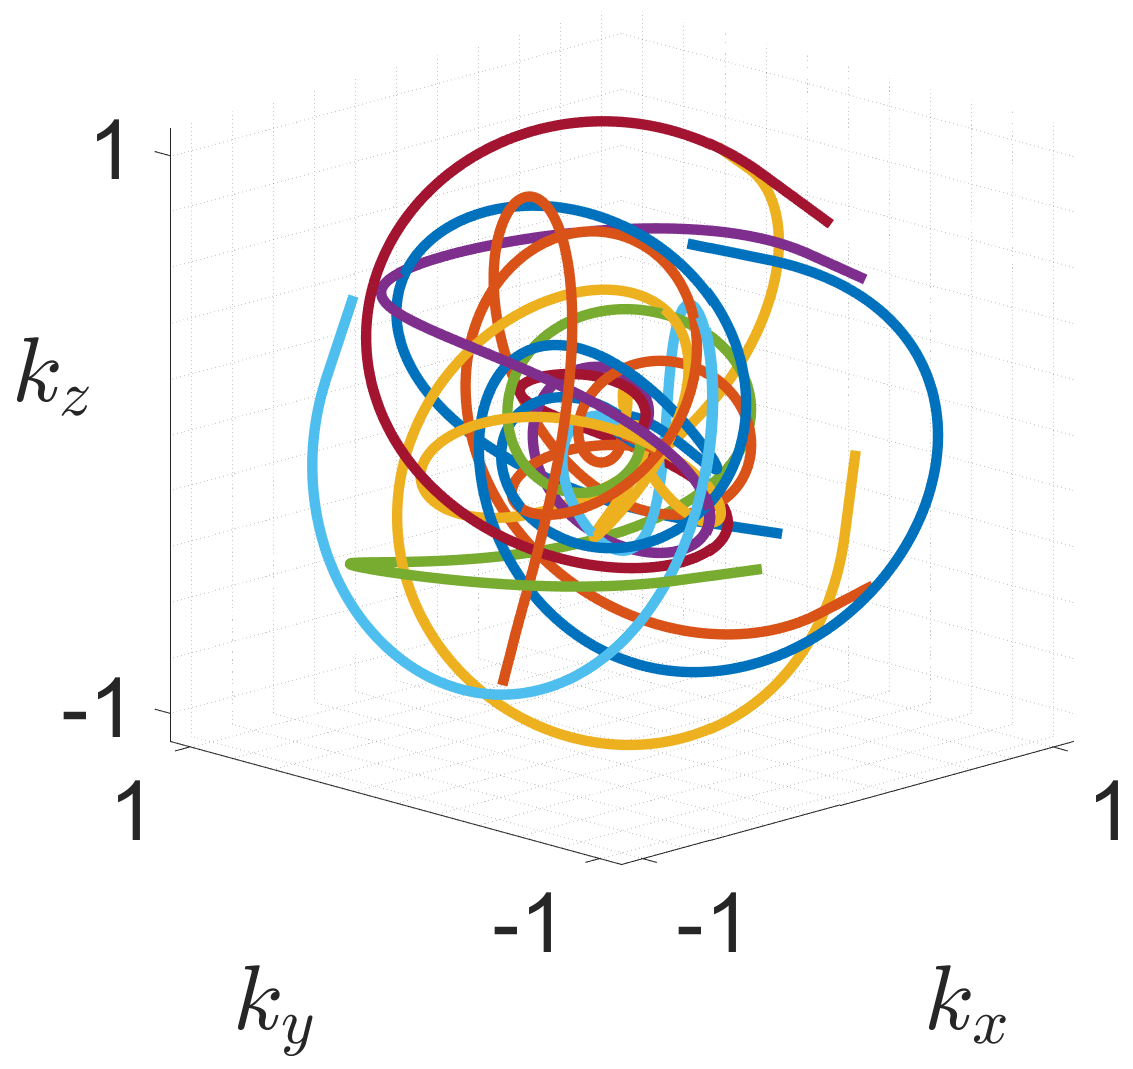
The general waveform for one interleave (3D $$$\zeta$$$-based Spiral) is generated on the surface of a unit sphere according to the definition: $$$\zeta: \mathbb{R}_0^+ \rightarrow \mathbb{R}^3$$$, $$$s \mapsto \zeta(s)$$$ with $$$m\in (0,1)$$$ and$$\begin{align}\zeta_x(s,m) &= \theta_1(s,m^2)\cdot \cos(s\cdot m^2)\\\zeta_y(s,m) &= \theta_1(s,m^2)\cdot \sin(s\cdot m^2)\\\zeta_z(s,m) &= \theta_2(s,m^2)\end{align}$$ with $$$\theta_1$$$ and $$$\theta_2$$$ being the first two Jacobi theta functions. Furthermore, $$$m$$$ is a parameter to adapt the waveform to hardware limitations, such as maximum gradient amplitudes and available slew-rates. The combination with sine and cosine terms in the first two components allows for a modifiable change in direction per unit length while the symmetry along the $$$z$$$-direction remains unchanged. 15 interleaves of the final trajectory are shown in figure 1.
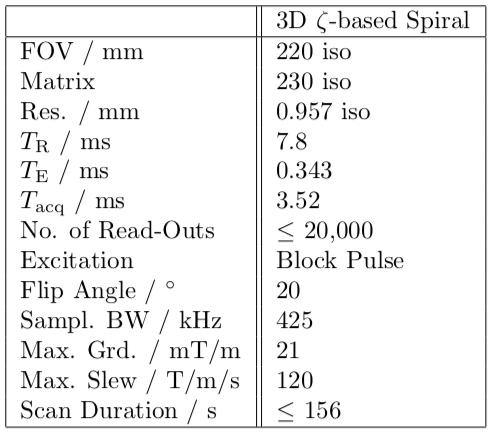
To evaluate the aliasing behaviour, as well as imaging properties, in-vivo head images were acquired with a 3.0 T wholebody MRI system (Achieva 3.0 T, Philips, Best, The Netherlands) and an 8-element SENSE Neurovascular coil. Images without post-processing, parallel imaging or CS are provided for appreciation of rising aliasing artifacts. The data were only gridded onto a Cartesian grid. Optimised trajectories were individually calculated for each undersampling factor according to the presented method and parameters with 12,000, 8,000, 4,000, 1,665 and 1,250 interleaves, leading to undersampling factors $$$R=1.67,\,2.5,\,5,\,12$$$ and 16 with respect to the initial trajectory with 20,000 interleaves ($$$R=1$$$). All relevant scan parameters are listed in figure 2.
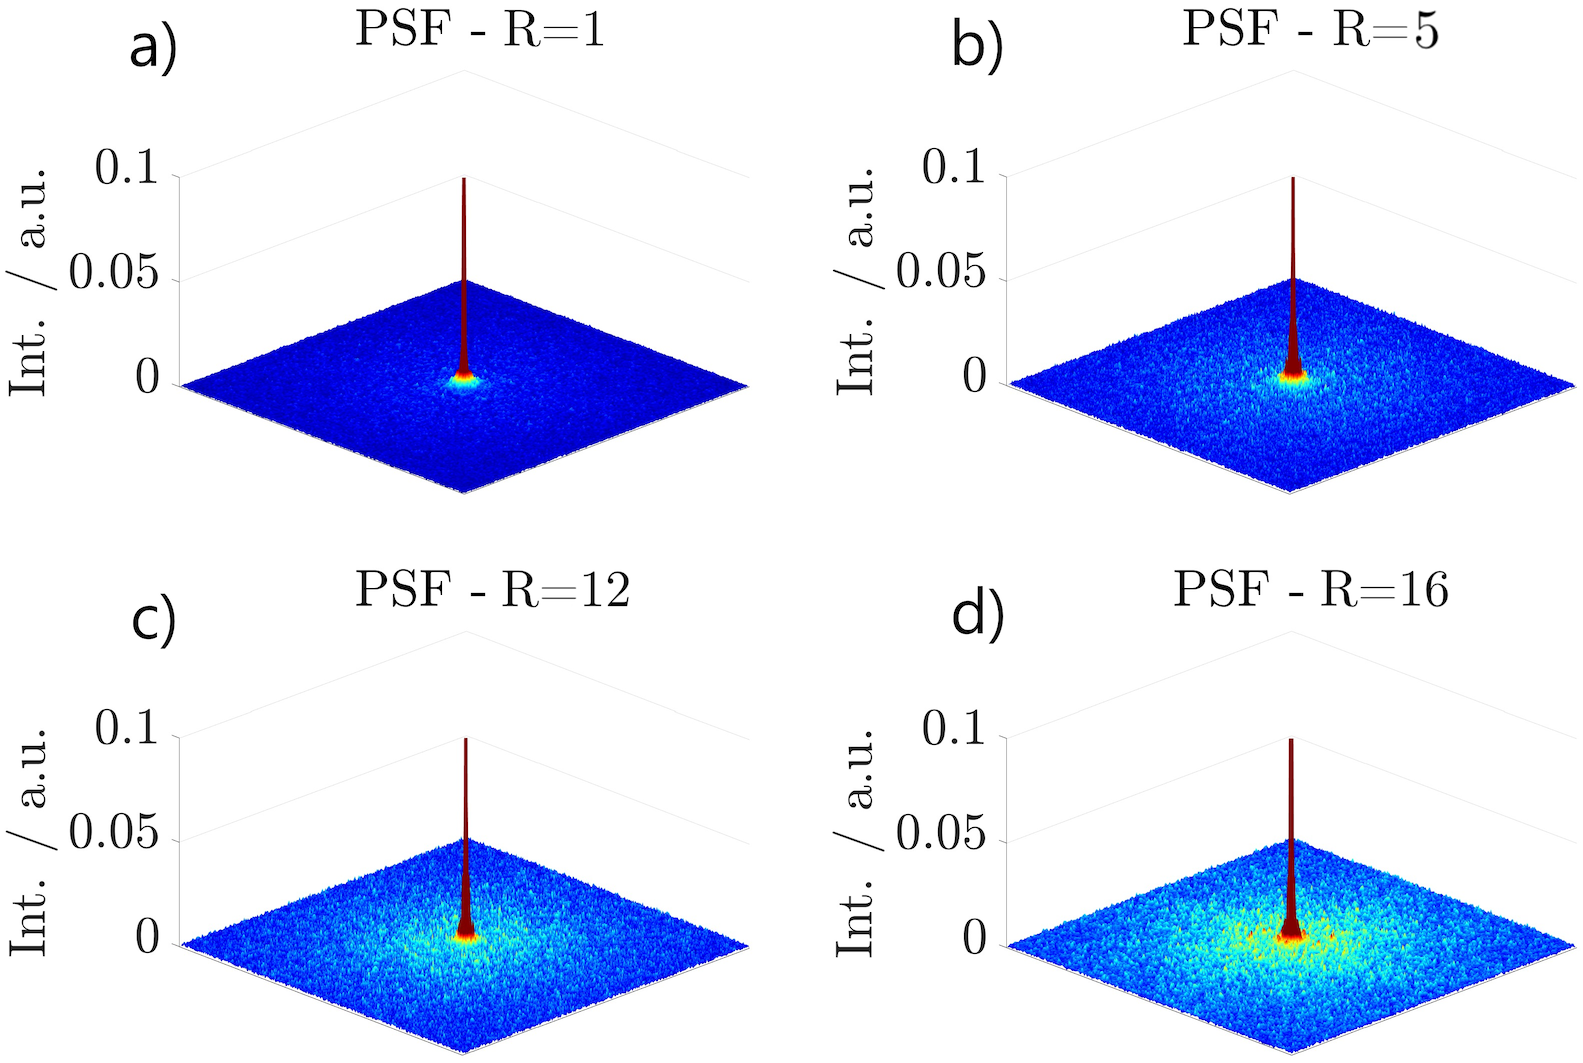
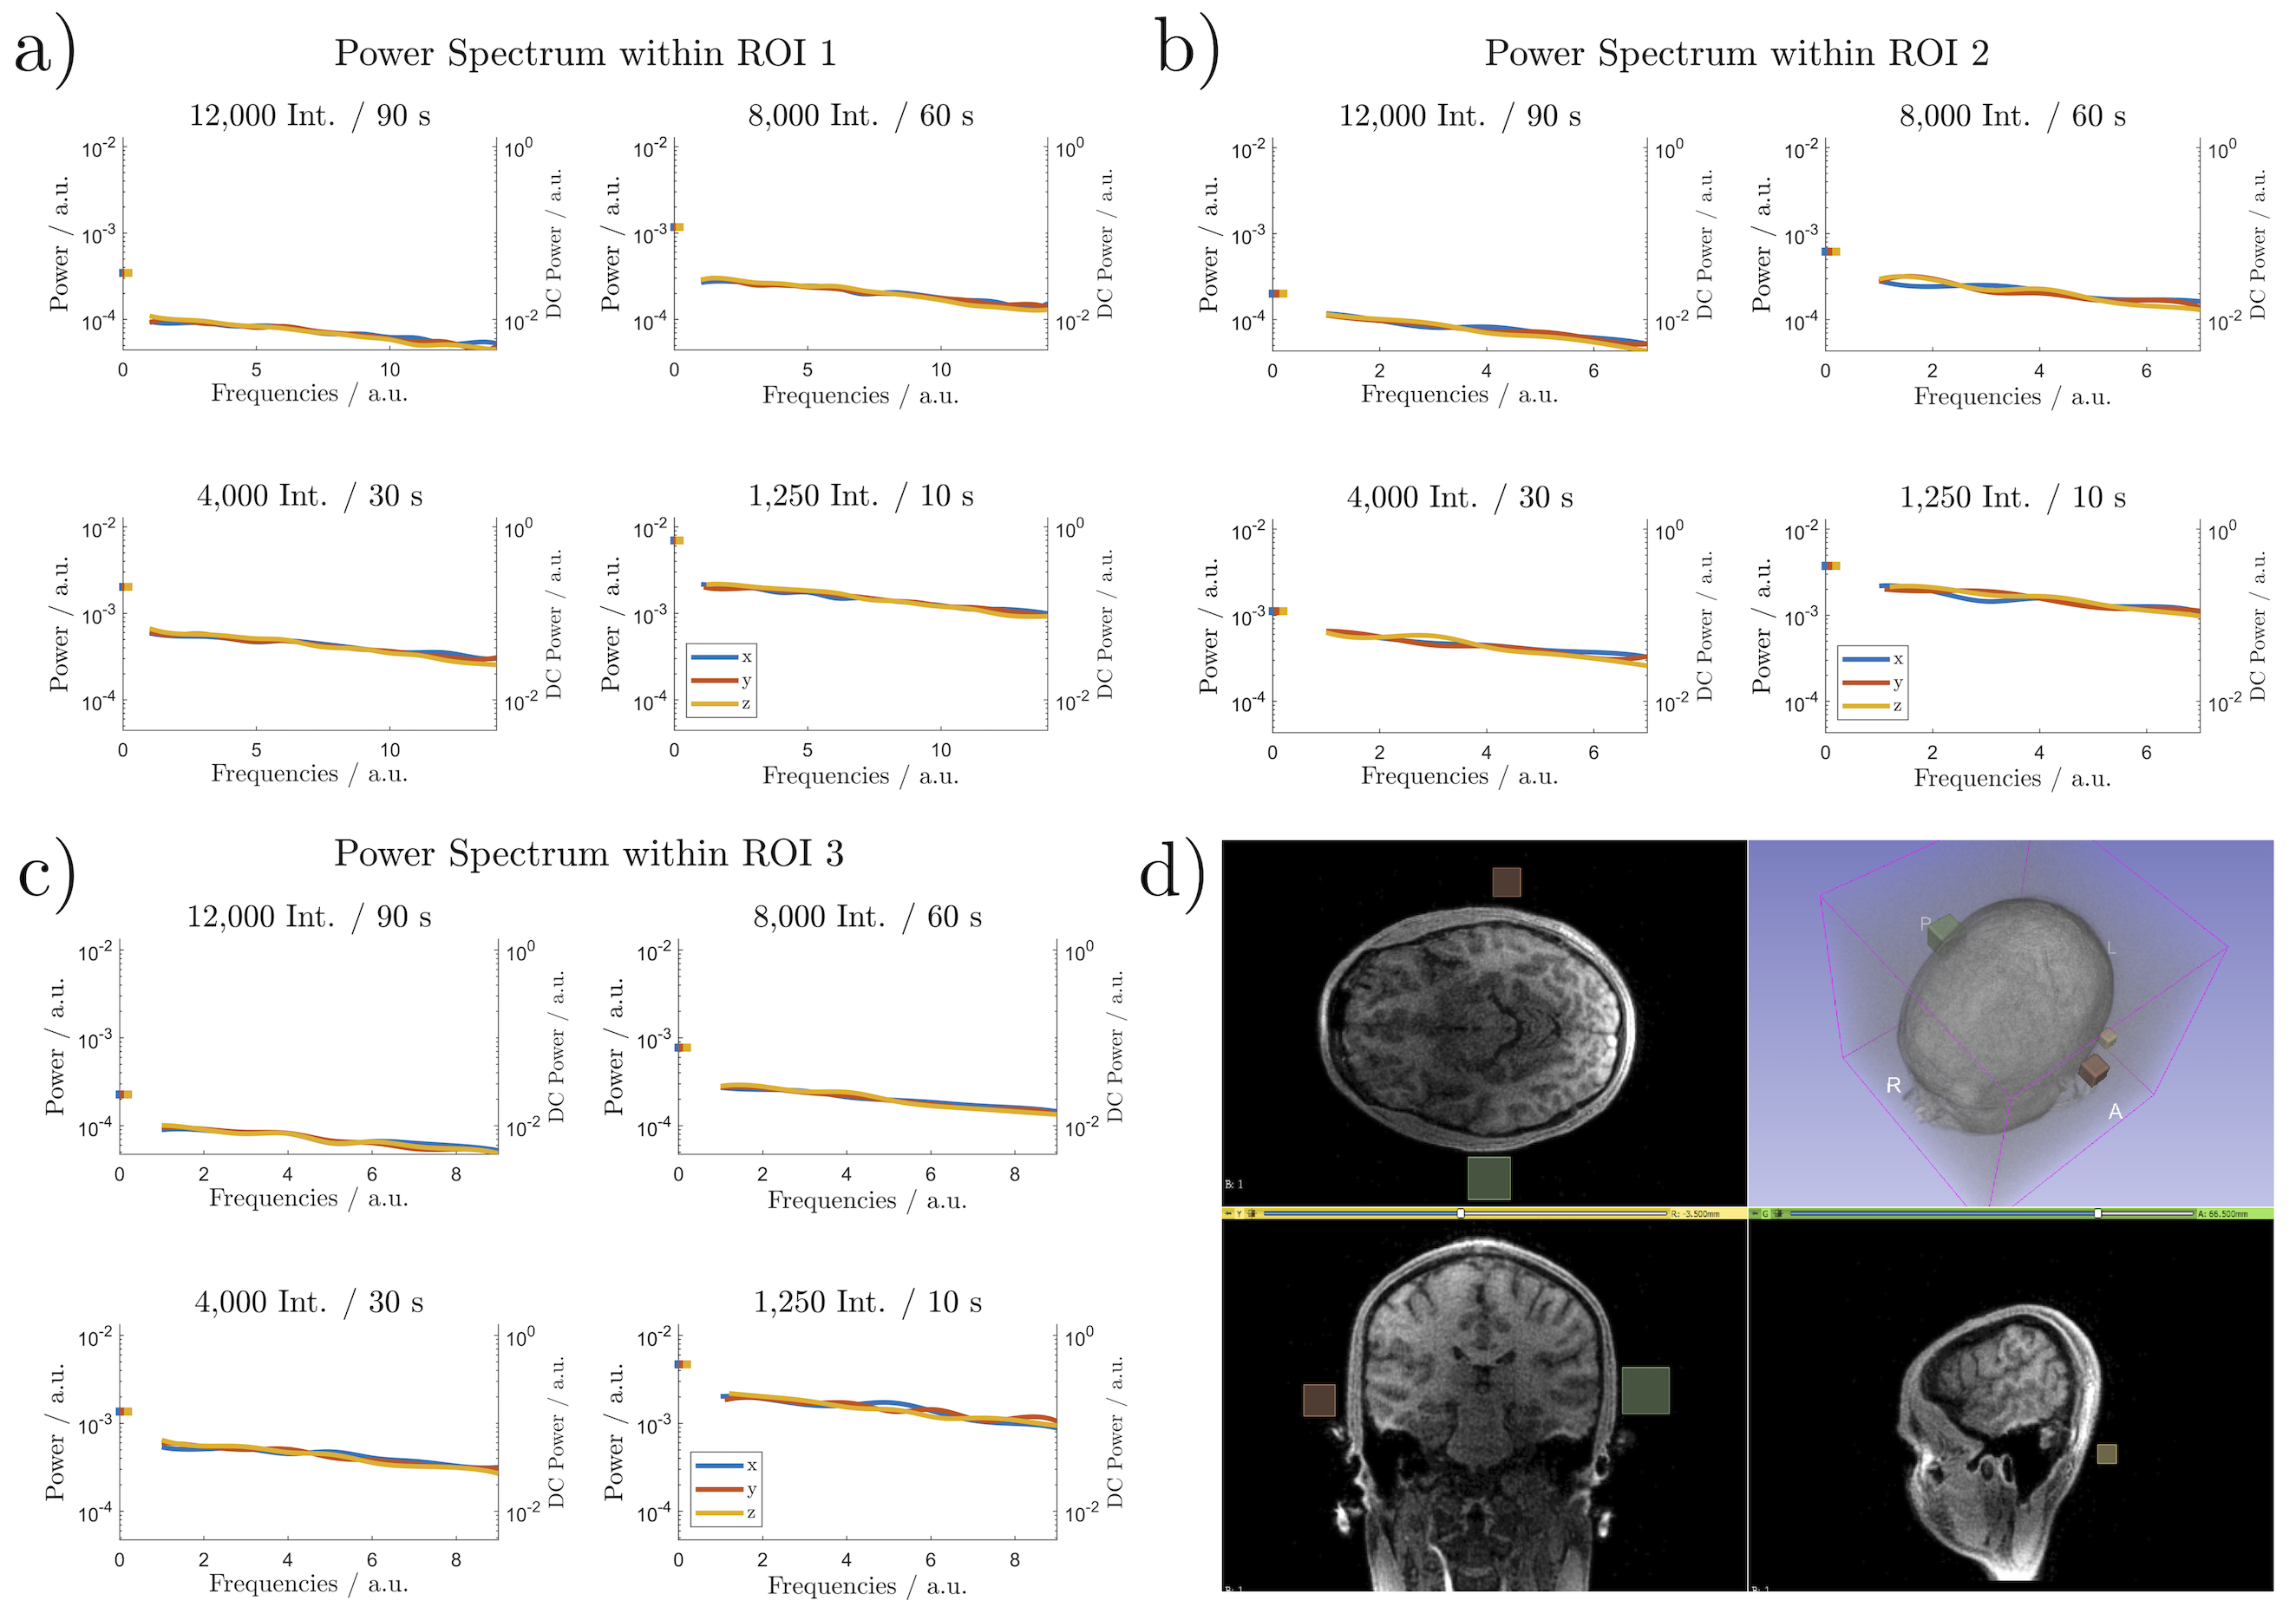
Based on the trajectories, used for in-vivo imaging, SPSF were calculated for the assessment of aliasing properties. Noise characteristics of the 3D $$$\zeta$$$-based Spiral are compared for different undersampling factors by calculating the noise power spectrum within a signal-free ROI.
Results
Figure 3 shows the SPSFs for four undersampling factors in the $$$xy$$$-plane with $$$z=0$$$. Even with increasing undersampling, no distinct aliasing artefacts are apparent. All SPSFs appear to be governed by a low-coherent distribution of energies with an expected aliasing behaviour that is vastly similar to an introduction of white noise. Image sharpness is preserved for all undersampling factors by considering the FWHM of the SPSF centre-peak which is $$$\approx 2.544$$$ pixel in width (mean) with a maximum deviation of 0.59 % between all undersampling factors.Fig. 4 shows axial and sagittal slices of a human head, acquired with the presented 3D $$$\zeta$$$-based Spiral trajectories for different numbers of interleaves (20,000, 8,000 and 1,250). All data was directly gridded and no additional image or data processing was applied. Fig. 4 further shows a Compressed Sensing reconstruction based on the dataset with 1,250 interleaves.
The noise analysis for the three cubic volumes (ROI) is shown in Fig. 5. The normalised power spectra indicate slightly overpronounced DC components with all further spatial frequency components being about equally represented, leading to a generally flat power spectrum (white noise-like). As expected, an increasing undersampling factor increases the overall power, but the line-shapes remain widely unchanged.
Discussion and Conclusion
In summary, all presented results indicate low-coherent aliasing properties, leading to a noise-like aliasing behaviour, which may facilitate new imaging strategies or alternatives for efficient exploitation for a given scan time.Besides obvious advantages in scan time reduction in combination of undersampling with a Compressed Sensing reconstruction, the trajectory can be calculated independent of an application dependent FOV, which does therefore not influence the total imaging duration. Using 3D $$$\zeta$$$-based Spirals, a trajectory might be constructed just by following given time restrictions and imaging constraints, e.g. such as:
- Size of k-space sphere is defined by the desired image resolution.
- Maximum read-out duration (spiral length) is defined (limited) by off-resonance behaviour and relaxation effects.
- Total acceptable scan duration defines the number of possible interleaves.
Based on the measured dataset, any feasible FOV can then be reconstructed by introduction of the presented low-coherent aliasing artefacts.
Acknowledgements
This project has received funding from the European Union's Horizon 2020 research and innovation programme under grant agreement No 858149.
The support by Philips Healthcare for importing gradient waveforms is highly appreciated by the authors.
The authors thank the Ulm University Centre for Translational Imaging MoMAN for its support.
References
[1] Lustig, M., Donoho, D.,Pauly, J. M. The application of compressed sensing for rapid MR imaging. Magn Reson Med. 58(6), 1182-1195, 2007.
[2] Pipe, J. G., Zwart, N. R., Aboussouan, E. A., Robison, R. K., Devaraj, A., Johnson, K. O. A new design and rationale for 3D orthogonally oversampled k-space trajectories. Magn Reson Med. 66(5), 1303-1311, 2011.
[3] Lazarus, C., Weiss, P., Chauffert, N., Mauconduit, F., El Gueddari, L., Destrieux, C., Ciuciu, P. SPARKLING: variable-density k-space filling for accelerated T2*-weighted MRI. Magn Reson Med. 81(6), 3643-3661, 2019.
[4] Speidel T., Metze P. and Rasche V. Efficient 3D Low-Discrepancy k-Space Sampling Using Highly Adaptable Seiffert Spirals. IEEE Trans Med Imaging. 38, 1833-1840, 2019.
Figures