0498
Characterization of cardiac noise in brain quantitative relaxometry MRI data1Clinical Neuroscience, Laboratory for Research in Neuroimaging, Lausanne University Hospital and University of Lausanne, Lausanne, Switzerland, 2Diagnostic and Interventional Radiology, Lausanne University Hospital and University of Lausanne, Lausanne, Switzerland, 3Center for Biomedical Imaging, Lausanne, Switzerland
Synopsis
Cardiac-related noise reduces the sensitivity of relaxometry data to brain microstructure properties such as iron or myelin concentration. To address this effect, we aim to characterize cardiac pulsation effects in in-vivo data. We combined a Cartesian pseudo-spiral sampling trajectory with compressed sensing image reconstruction using a temporal total variation regularization to obtain 3D multi-echo images at 12 points of the cardiac cycle. We show that 76% of the full k-space is required in each cardiac bin to maintain 90% of voxels above a 60% sensitivity to physiological noise in the reconstructed images.
Introduction
Physiological noise, including cardiac pulsation effects, is a dominant source of noise in MRI data1–3. However, its impact on brain quantitative relaxometry data remains largely unexplored. The characterization of cardiac-associated noise in brain MRI data would lead to new acquisition strategies that mitigate these effects, enhancing data sensitivity to brain changes. However, the acquisition of fully sampled relaxometry data for a number of bins sufficient to resolve physiological changes throughout the cardiac cycle would require a prohibitively long acquisition time. Techniques that allow the reconstruction of MR images from undersampled raw data are therefore required.We require an image reconstruction strategy that preserves the sensitivity of the data to physiological noise. Compressed sensing is a reconstruction method that enforces sparsity in the reconstructed MR images to reduce aliasing artifact caused by the missing data4. Because cardiac noise is spatially localized, we opted to enforce a sparsity constraint on the difference between consecutive images of the cardiac cycle, on the model of recent applications in the field of cardiac imaging5,6.
In this study, we thus present a k-space sampling strategy and image reconstruction technique that provide optimal sensitivity to characterize cardiac-related noise in brain relaxometry data.
Methods
Data were continuously acquired for one hour using a pseudo-spiral Cartesian trajectory7 in the two phase encoding directions (ky,kz) and 6 bipolar fully sampled readouts per spiral arms in the frequency encoding direction (kx), on one participant. A 3T MRI clinical scanner (Magnetom Prisma, Siemens) with a 64-channel receive head coil and a customized 3D FLASH sequence8 were used. Acquisition parameters included repetition time TR=40ms, 15 echo images with a minimal echo time and inter-echo spacing of 2.34ms, and an isotropic (2mm)^3 voxel size.These data were used to generate a fully sampled reference image and a template estimate of cardiac-related noise, used subsequently in numerical simulations. The reference image was computed by combining all acquired data using a SENSE1 reconstruction (figure 1A). To estimate the cardiac noise template, all k-space centers (i.e. kx=ky=kz=0) were sorted into 12 bins according to the cardiac cycle. Similar to RETROICOR/RETROKCOR9,10, the cardiac noise template was obtained by fitting the binned k-space data with sin/cos basis functions with two harmonics (figure 1B). This template, which represents the change in MRI signal associated with cardiac pulsation averaged over the brain, primarily highlights a change in the magnitude of the signal, strongest between bins 6 and 8.
The template cardiac noise was applied separately on the real and imaginary part of the reference image in the brainstem and cerebellum regions (Figure 1C) to produce a fully-sampled MR image with cardiac fluctuations. Sub-samples of this data were computed following the pseudo-spiral Cartesian trajectory used in-vivo7, with a 50% higher sampling rate in the k-space periphery to maximize sampling efficiency. The duration of these simulated scans was one and two hours for sub-samples 1 and 2 respectively, leading to an average k-space bin filling of 45% (figure 2A) and 63% (figure 2B), respectively. Sub-sample 3 was compiled from the one-hour dataset by filling-in the missing data from neighbouring bins when available, leading to a k-space filling of 76% (figure 2C).
Image reconstruction was performed using a customized version of the alternating direction method of multipliers (ADMM)11,12. The optimal value of the regularization parameter was estimated separately for each sub-sample to balance sensitivity to the template cardiac noise and residual aliasing noise, leading to l=1e-3, 1e-4 and 1e-4 for sub-samples 1, 2 and 3 respectively. The cardiac noise level was modeled from the reconstructed images using RETROICOR. The parameters used to evaluate the ability of the sub-samples to capture cardiac-related noise were: 1. Sensitivity to cardiac noise, assessed from the fraction of the input template cardiac noise retrieved after image reconstruction, 2. Aliasing artifact level, computed from the standard deviation of the difference between the reconstructed and cardiac noise template, and 3. The phase bias due to image reconstruction, assessed from the phase difference between the real parts of the template and reconstructed cardiac noise.
Results
Compared to the simulated fully sampled cardiac noise, sub-sample 3 shows a similar level of cardiac noise and clear improvements in the delineation of the affected regions (Table 1, Figure 3). All t three sampling strategies show a mean sensitivity close to one, but the spatial uniformity is much improved for sub-sample 3 (Figure 4). Moreover, sub-sample 3 is able to maintain a sensitivity above 60% for 90% of voxels. The aliasing artifact level is reduced by a factor ~5 from sub-sample 1 to 3 and no systematic bias in the phase of cardiac-related noise is apparent.Discussion & conclusion
The characterization of cardiac-induced noise in brain relaxometry data requires resolving the temporal fluctuations of the MRI signal throughout the cardiac cycle with high sensitivity. We show that this can be achieved with a tailored one-hour scan combined with a dedicated image reconstruction technique, which opens the way for the design of novel sampling strategies to mitigate cardiac fluctuations in-vivo.Acknowledgements
No acknowledgement found.References
1. Neuroscience H, Brooks JCW, Faull OK, Pattinson KTS, Jenkinson M. Physiological noise in brainstem fMRI. 2013;c(October):1-13. doi:10.3389/fnhum.2013.00623
2. Wen J, Cross AH, Yablonskiy DA. On the role of physiological fluctuations in quantitative gradient echo MRI: Implications for GEPCI, QSM, and SWI. Magnetic Resonance in Medicine. 2015;73(1):195-203. doi:10.1002/mrm.25114
3. Petridou N, Schäfer A, Gowland P, Bowtell R. Phase vs. magnitude information in functional magnetic resonance imaging time series: toward understanding the noise. Magnetic Resonance Imaging. 2009;27(8):1046-1057. doi:10.1016/j.mri.2009.02.006
4. Lustig M, Donoho DL, Santos JM, Pauly JM. A look at how CS can improve.pdf. IEEE Signal Processing Magazine. 2008;(March 2008):72-82.
5. Feng L, Coppo S, Piccini D, et al. 5D whole-heart sparse MRI. Magnetic Resonance in Medicine. 2018;79(2):826-838. doi:10.1002/mrm.26745
6. Coppo S, Piccini D, Bonanno G, et al. Free-running 4D whole-heart self-navigated golden angle MRI: Initial results. Magnetic Resonance in Medicine. 2015;74(5):1306-1316. doi:10.1002/mrm.25523
7. Usman M, Ruijsink B, Nazir MS, Cruz G, Prieto C. Free breathing whole-heart 3D CINE MRI with self-gated Cartesian trajectory. Magnetic Resonance Imaging. 2017;38:129-137. doi:10.1016/j.mri.2016.12.021
8. Weiskopf N, Suckling J, Williams G, et al. Quantitative multi-parameter mapping of R1, PD*, MT, and R2* at 3T: A multi-center validation. Frontiers in Neuroscience. 2013;7(7 JUN):1-11. doi:10.3389/fnins.2013.00095
9. Glover GH, Li TQ, Ress D. Image-based method for retrospective correction of physiological motion effects in fMRI: RETROICOR. Magnetic Resonance in Medicine. 2000;44(1):162-167. doi:10.1002/1522-2594(200007)44:1<162::AID-MRM23>3.0.CO;2-E
10. Tijssen RHN, Jenkinson M, Brooks JCW, Jezzard P, Miller KL. Optimizing RetroICor and RetroKCor corrections for multi-shot 3D FMRI acquisitions. NeuroImage. 2014;84:394-405. doi:10.1016/j.neuroimage.2013.08.062
11. Boyd S, Parikh N, Chu E, Peleato B, Eckstein J. Distributed optimization and statistical learning via the alternating direction method of multipliers. Foundations and Trends in Machine Learning. 2010;3(1):1-122. doi:10.1561/2200000016
12. di Sopra L, Piccini D, Coppo S, Stuber M, Yerly J. An automated approach to fully self-gated free-running cardiac and respiratory motion-resolved 5D whole-heart MRI. Magnetic Resonance in Medicine. 2019;82(6):2118-2132. doi:10.1002/mrm.27898
Figures
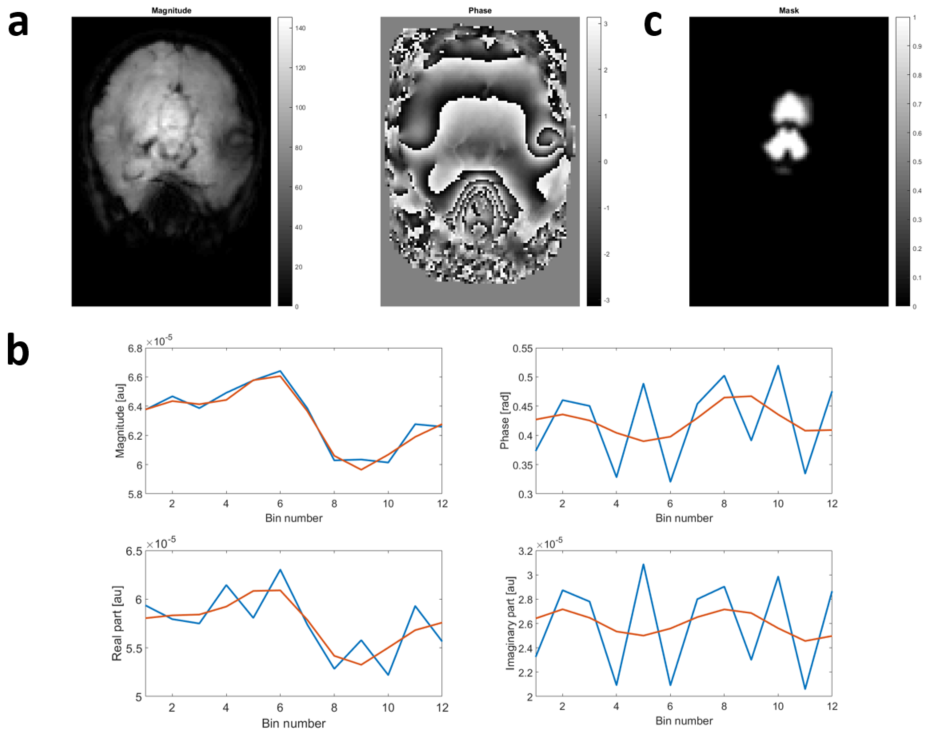
Figure 1: Magnitude and phase reference images computed from fully sampled in-vivo data (a). Magnitude/phase and real/imaginary components of the template cardiac noise, before (blue) and after RETROICOR fitting (red) (b). Mask of the cerebellum and brainstem regions where the template cardiac noise was applied in the simulations (c).
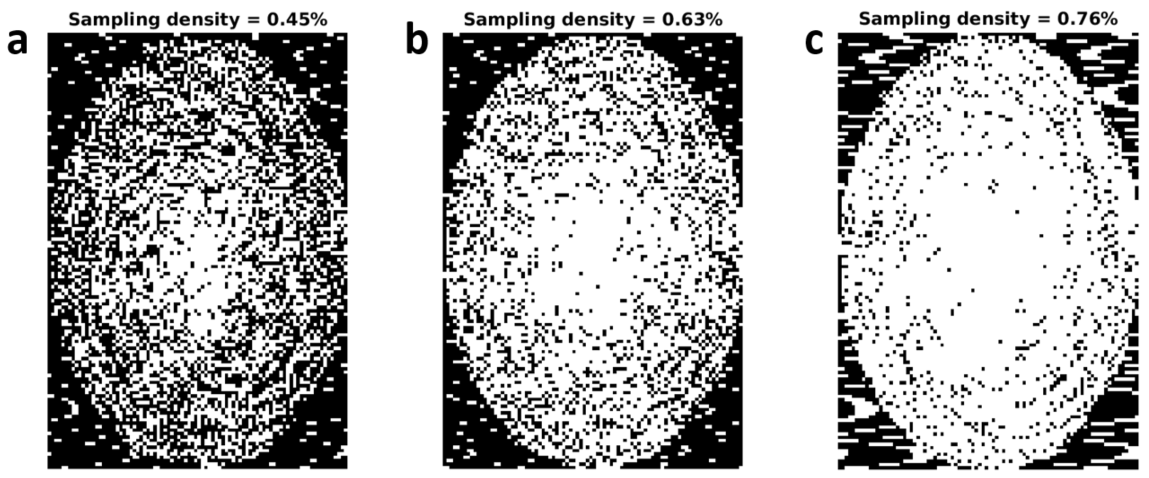
Figure 2: Binary mask applied on the first bin of fully sampled data to simulate the first bin of acquisitions with sub-sampling 1(a), 2(b) and 3(c).
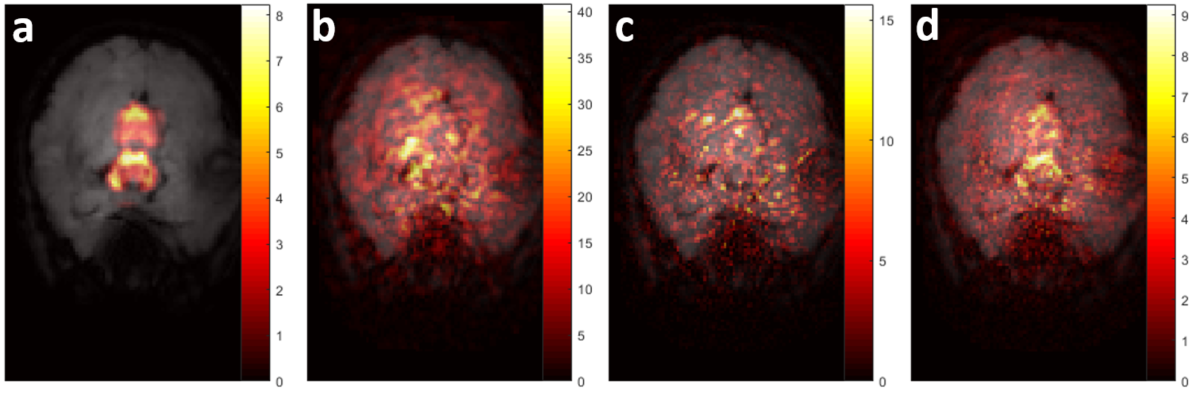
Figure 3: Magnitude signal difference between bins 7 and 8 of the cardiac cycle. The template cardiac noise was applied on the fully sampled data in the brainstem and cerebellum (A). Bin-to-bin difference obtained after sub-sampling the data with schemes 1 to 3.
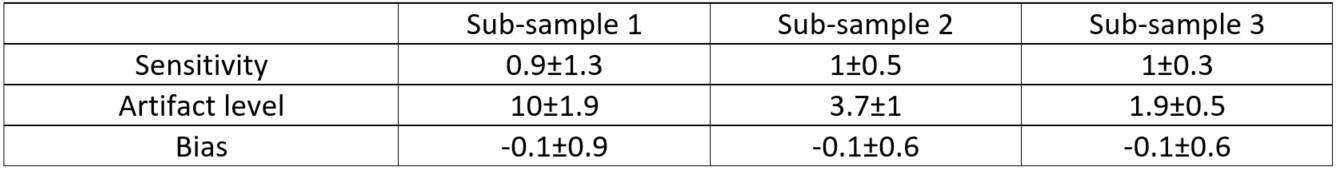
Table 1: Sensitivity, noise level and bias in the depictions of cardiac physiological noise obtained from each candidate sub-sample. The mean ± standard deviation estimates were calculated over the region where the cardiac noise template was applied in the simulations.
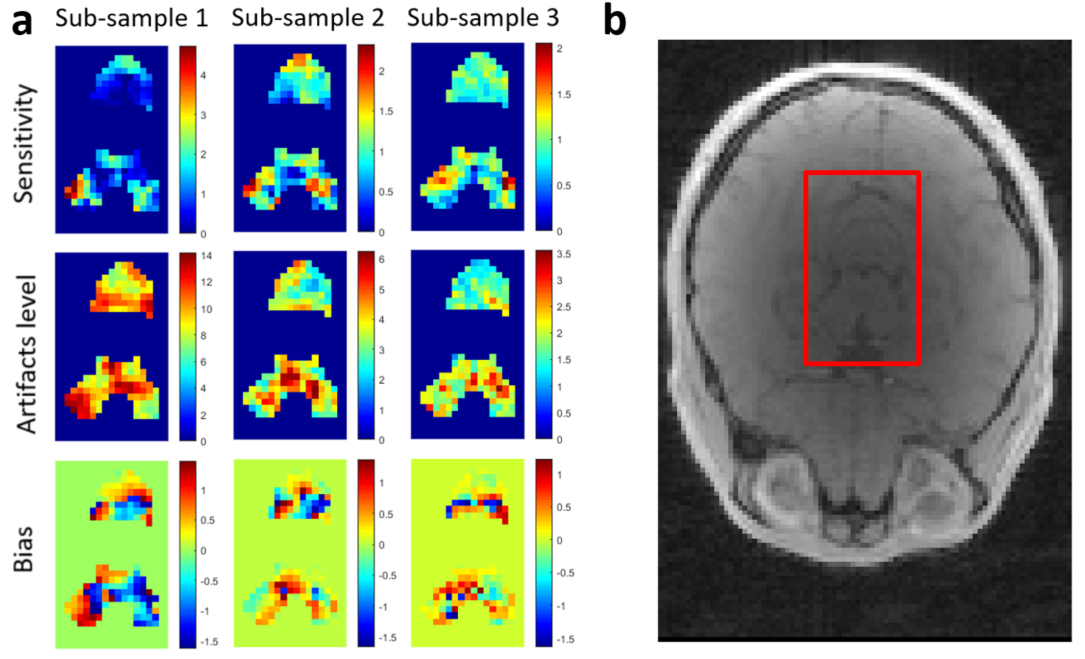
Figure 4: Sensitivity, artifact level and bias of the cardiac noise estimates obtained from sub-sampling strategies 1 to 3 (a). The estimates are displayed in the brainstem and cerebellum regions where the template cardiac noise was originally applied (see reference anatomical image in b).