0489
Estimating Cerebrovascular Compliance from Normocapnia and Hypercapnia BOLD Pulsatility Mapping
Jake Valsamis1, Nicholas Luciw1, Walter Swardfager2,3, Andrew Lim2,4, Joel Ramirez2, Sandra Black2,4, and Bradley J MacIntosh1,5
1Physical Sciences, Sunnybrook Research Institute, Toronto, ON, Canada, 2Evaluative Clinical Sciences, Sunnybrook Research Institute, Toronto, ON, Canada, 3Department of Pharmacology and Toxicology, University of Toronto, Toronto, ON, Canada, 4Department of Medicine, University of Toronto, Toronto, ON, Canada, 5Department of Medical Biophysics, University of Toronto, Toronto, ON, Canada
1Physical Sciences, Sunnybrook Research Institute, Toronto, ON, Canada, 2Evaluative Clinical Sciences, Sunnybrook Research Institute, Toronto, ON, Canada, 3Department of Pharmacology and Toxicology, University of Toronto, Toronto, ON, Canada, 4Department of Medicine, University of Toronto, Toronto, ON, Canada, 5Department of Medical Biophysics, University of Toronto, Toronto, ON, Canada
Synopsis
Measuring intracranial vascular compliance (VC) may help characterize a patient’s resilience to Alzheimer’s disease and dementia. In this study, we estimate VC from a BOLD MRI cerebrovascular reactivity (CVR) protocol by measuring cardiac-related BOLD pulsatility and end-tidal CO2 during periods of hypercapnia and normocapnia. We measured high VC in regions proximal to major cerebral arteries like the thalamus and insula, and low VC in the parietal lobe. This study demonstrates the feasibility of extracting additional information from BOLD-CVR experiments and suggests regional differences in VC. Future work will include a second cohort to estimate VC in different patient populations.
Introduction
Vascular health is an important and often overlooked risk factor for Alzheimer’s disease and dementia.1 Vascular compliance (VC) refers to a vessel’s ability to increase in volume in response to an increase in blood pressure.2 Brachial pulse pressure and pulse wave velocity are commonly used to indirectly assess VC, but both methods are limited to arteries outside of the brain.3,4 The ability to measure intracranial VC may provide insight into the early stages of cerebrovascular diseases, Alzheimer’s disease and dementia.Blood oxygenation level-dependent (BOLD) MRI is well suited to estimate VC because of the relatively high spatial and temporal resolution. Many studies use hypercapnic manipulation with carbon dioxide (CO2) during BOLD MRI to estimate cerebrovascular reactivity (CVR);5,6 and yet additional information from these experiments may be possible. In this work, we propose a novel method to extract compliance contrast from BOLD MRI CVR scans. T2*-weighted BOLD images were acquired under hypercapnia and normocapnia conditions. Each condition exerts an effect on vascular tension in the arteries. VC was estimated by measuring the difference in cardiac-related BOLD pulsatility under each state of vascular tension and normalizing it by the pressure change in end-tidal CO2. We expect VC to be high in regions proximal to major cerebral arteries and relatively low in distal regions.
Methods
Ten participants with small vessel disease were scanned using a CVR protocol during which functional MRI with BOLD contrast (TR/TE=1550/30ms, 2.5mm3 isotropic resolution, 235x235x125mm field of view) was collected during 3 periods of resting-state and 2 periods of induced hypercapnia by breathing air with enriched carbon dioxide (6% CO2, normal O2 levels). Throughout the scan, cardiac pulse and respiratory belt recordings were collected synchronized to the MRI. In addition, we used a gas analyzer to collect respiratory gas exchange sampled from a tight-fitting mask.The influence of the respiration signals on BOLD data was regressed out using 3dretroicor.7 Functional images were skull stripped, slice time corrected, spatially smoothed (5-mm full width at half maximum), and motion-corrected. The MRI and peripheral physiology data were separated into hypercapnia and normocapnia epochs. Cardiac position measurements were extracted from the pulse recordings and the BOLD volumes were resorted according to cardiac position. A seven-term Fourier series model was fit to a time series of 100 ‘resorted’ BOLD volumes. Normocapnia and hypercapnia conditions were treated separately.8 We estimated the degree of cardiac-related BOLD pulsatility by calculating the root mean square (RMS) across the Fourier series’ beta coefficients. The increase in BOLD pulsatility under hypercapnia was evaluated in a cluster of blood voxels within the sagittal sinus.
The end-tidal partial pressure of CO2 (PETCO2) was extracted from a Biopac gas recording unit. These measurements were separated into hypercapnia and normocapnia groups and then averaged. VC related maps were generated according to equation 1:$$VC = \left(\frac{Pulsatility_{hyper} - Pulsatility_{normo}}{Pulsatility_{normo}}\times100\right)\left(\frac{1}{PETCO2_{hyper} - PETCO2_{normo}}\right)$$ A one-sample t-test was used to generate a t-statistic map identifying where VC was consistently different from zero. VC was assessed in select brain regions of interest (ROIs) including the left and right insula, the bilateral thalamus and the parietal lobe.
Results
A paired t-test revealed a significant increase in BOLD pulsatility in the blood voxel ROI (P<0.05. 47.56% increase, on average). Averaging VC maps across the sample of 10 participants revealed evidence of VC in proximity to the major cerebral arteries and surrounding regions (Figure 1A). Figure 1B displays where VC measurements were consistently different from zero on a voxel-wise level. Mean VC was highest in the thalamus, relative to other brain ROIs. A paired t-test revealed significantly lower VC in the parietal lobe compared to the thalamus (Figure 2). Mean VC was high in the insula regions, with a trend towards left and right differences.Discussion
In this study, we demonstrate that it is feasible to extract additional information from a BOLD-CVR hypercapnia experiment. VC estimates were generated after creating BOLD pulsatility maps in this patient sample. We observed positive VC values in proximity to intracranial arteries and the insula cortex. Considerably lower VC was observed in the parietal lobe, which suggests that hypercapnia has a differential effect on the brain’s vasculature that depends on the region and the prevailing make-up of the ROI. The VC metric captures the regional increase in pulsatility which is likely due to the high dilatory capacity of the major arteries. During hypercapnia, the elevated pulsatility may be transmitted to downstream vascular beds which could increase the VC measurements in the insula and thalamus. Clusters of negative values in the t-statistic map were found in locations distal to main arterial segments, primarily in the parietal lobe. The reduced pulsatility during hypercapnia in these regions could be due to the “steal” effect, where cerebral blood flow capacity exceeds the supply causing the diversion of blood from these regions towards regions with a higher vasodilatory reserve.9Future work will include a second cohort to increase the sample size and assess VC in different patient populations. A technique that reliably extracts VC information from BOLD MRI scans can be used in conjunction with CVR measurements to provide a more comprehensive assessment of cerebrovascular health.
Acknowledgements
This research was supported by a CIHR project grant, an industry-partnership INOVAIT grant, and the Dr. Sandra Black Centre for Brain Resilience & Recovery.References
- Sweeney M et al., “Vascular dysfunction-The disregarded partner of Alzheimer’s disease,” Alzheimers Dement., vol. 15, no. 1, pp. 158–167, 2019.
- Kelly B and Chowienczyk P, An Introduction to Vascular Biology: From basic science to clinical practice. UK: Cambridge University, 2002.
- Mackenzie I.S, Wilkinson I.B., and Cockroft J.R., “Assessment of arterial stiffness in clinical practice,” QJM, vol. 95, pp. 67–74, 2002.
- Sutton-Tyrrell K et al., “Elevated aortic pulse wave velocity, a marker of arterial stiffness, predicts cardiovascular events in well-functioning older adults,” Circulation, vol. 111, pp. 3384–3390, 2005.
- Kassner A, Winter J, Poublanc J, Mikulis D, and Crawley A, “Blood-oxygen level dependent MRI measures of cerebrovascular reactivity using a controlled respiratory challenge: Reproducibility and gender differences,” J. Magn. Reson. Imaging, vol. 31, pp. 298–304, 2010.
- Mandell DM et al., “Mapping cerebrovascular reactivity using blood oxygen level-dependent MRI in patients with arterial steno-occlusive disease: comparison with arterial spin labeling MRI,” Stroke, vol. 39, pp. 2021–2028, 2008.
- Glover G, Li T, and D Ress, “Image-based method for retrospective correction of physiological motion effects in fMRI: RETROICOR,” Magn. Reson. Med., vol. 44, no. 1, pp. 162–167, 2000.
- Atwi S et al., “Cardiac-Related Pulsatility in the Insula Is Directly Associated With Middle Cerebral Artery Pulsatility Index,” J. Magn. Reson. Imaging, vol. 51, no. 5, pp. 1454–1462, 2020.
- Sobczyk O et al., “A conceptual model for CO2-induced redistribution of cerebral blood flow with experimental confirmation using BOLD MRI,” NeuroImage, vol. 92, pp. 56–98, 2016.
Figures
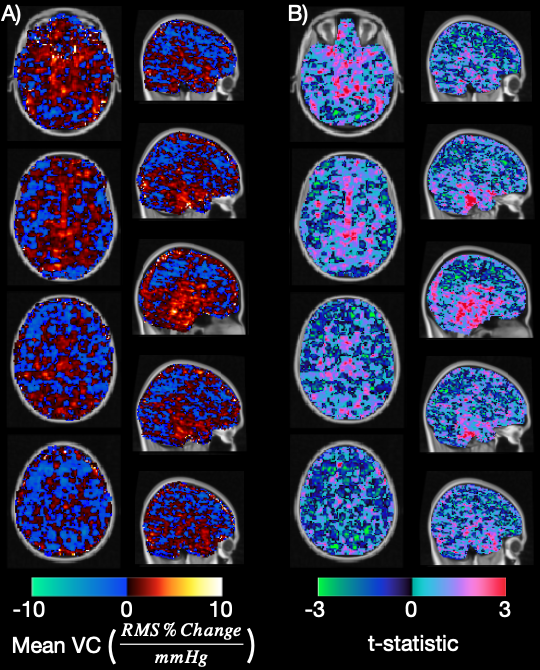
Figure 1: A) Four axial and five sagittal slices show the average VC map in 10 patients. Equivalent views show the unadjusted t-statistic map corresponding to the VC maps (B) overlaid on a 2mm MNI T1 image.
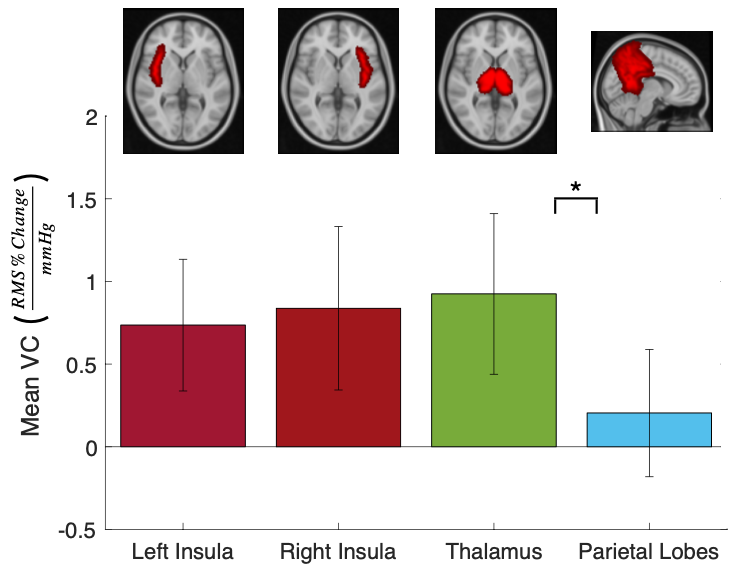
Figure 2: The mean VC across 10 subjects in select brain regions which are illustrated by the corresponding MNI atlas overlaid on a 2mm MNI T1 image. These regions were selected to evaluate VC in regions proximal and distal to major cerebral arteries. Statistically significant differences in VC are indicated by * (P<0.05).
DOI: https://doi.org/10.58530/2022/0489