0488
DKI Metrics Provide Improved Sensitivity To Conventional DTI in Differentiating Brain Microstructural Changes in HIV Clade-C Infection1Radiology, University of Miami, Miami, FL, United States, 2Post Graduate Institute of Medical Education & Research, Chandigarh, India
Synopsis
HIV clade-C, found in 50% of HIV cases worldwide, has been
reported to have lower neurovirulence than clade-B, more common in the global
north. Numerous DTI-based studies have investigated HIV-associated
microstructural damage in the brain, yet few looked at clade-C in particular.
Moreover, some have reported inconsistent DTI results with respect to HIV. In
this study, we use DTI and DKI to determine the extent of microstructural brain
damage due to HIV clade-C infection. Our results show that a combined use of
DTI and DKI can provide a better description of brain tissue damage among HIV
clade-C infected individuals.
Introduction
Human immunodeficiency virus-1 (HIV) Clade-C is the most common strand of HIV in India, Southern African and parts of Brazil, representing around 50% of HIV cases worldwide.1 HIV Clade-C has been reported to have lower neurovirulence than clade-B which is more common in the global north.2 While numerous studies have demonstrated that DTI derived metrics are reliable biomarkers of HIV-associated microstructural damage in the brain, few published studies utilized these for assessing HIV clade-C in particular.1,2 Moreover, some studies reported inconsistent results with DTI measures in the literature.3 This study aims at finding if DKI4 can provide more reliable measures of HIV-associated abnormalities in the brain than conventional DTI.Methods
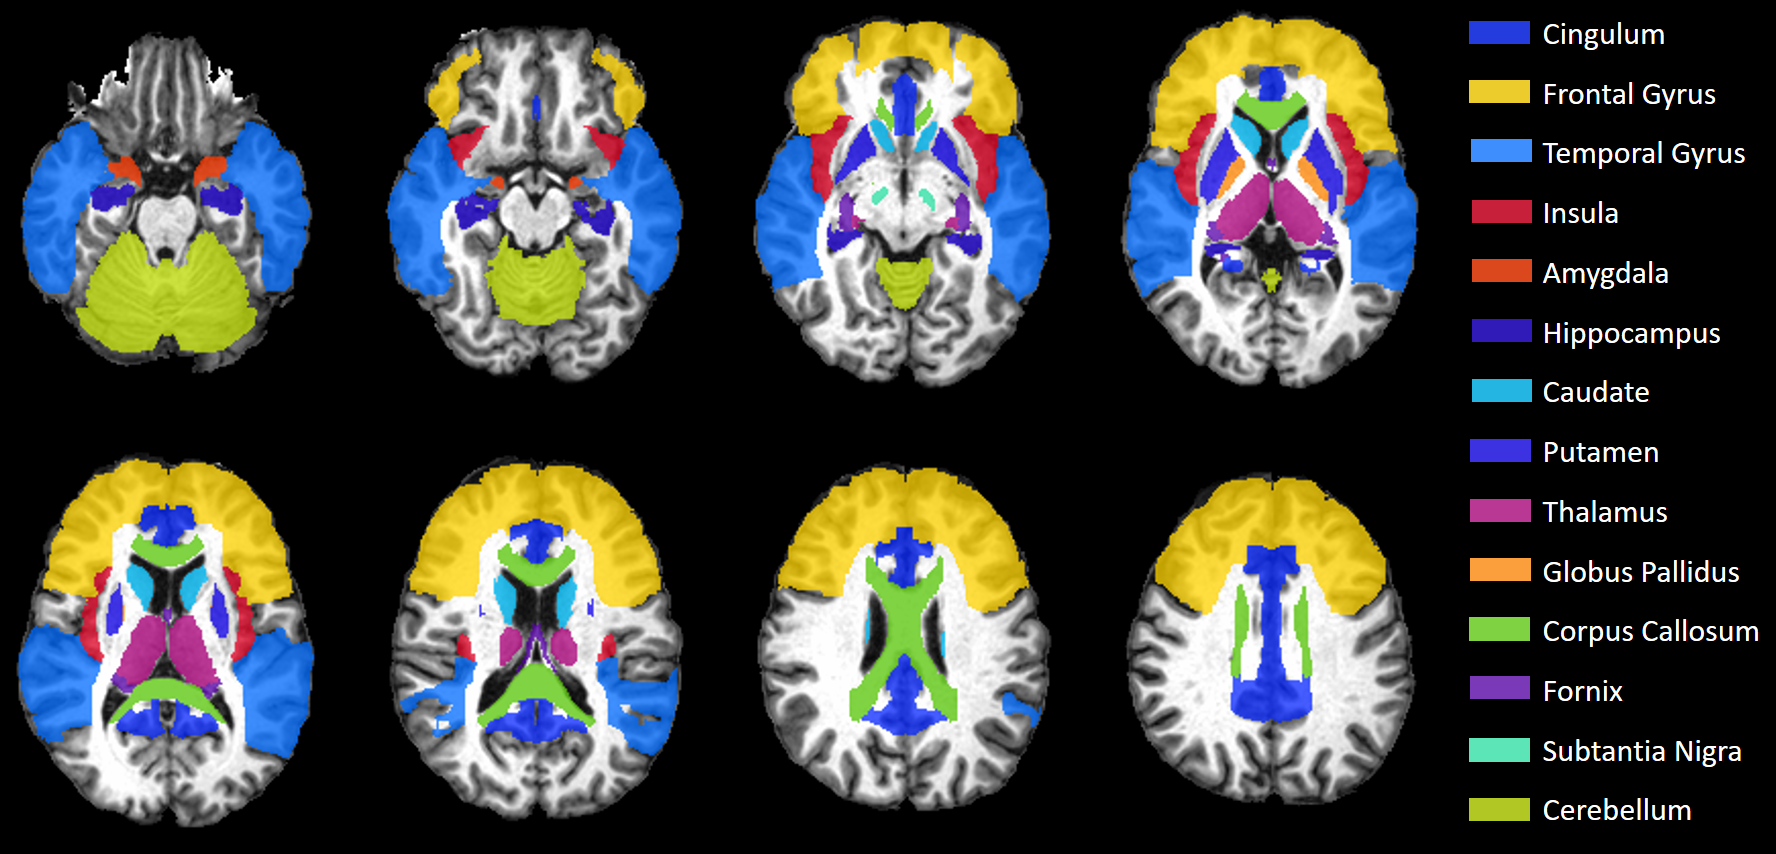
MRI Data were collected at the Post Graduate Institute of Medical Education & Research (PGIMER) in India from 217 volunteers with 107 Clade-C HIV+ subjects (77/30 male/female; age: 30.9±7.1), and 110 age-matched controls (74/36 male/female; age: 31.7±6.4). All HIV subjects were cART-naïve and received no treatment until the scan. We acquired whole-brain structural and diffusion-weighted (DW) MRIs on a 3T Siemens scanner. The MRI protocol included: (a) T1-weighted MPRAGE images (TR/TE: 2300/2.42 ms; voxel dimension: 0.5 × 0.5 × 3.0 mm; 160 axial slices); (b) DW-images with dual-shell acquisition (b = 1000/2000 s/mm2) using 30 gradient directions per shell (TR/TE: 1150/98 ms; voxel dimension: 3.0 × 3.0 × 3.0 mm; 54 axial slices); (c) Two b0 sequences of 9 images each, collected in opposite phase encoding directions (Anterior-posterior i.e., AP or -PA) following the same parameters as the DW-images.All images were pre-processed using tools from the FMRIB software library (FSL).5 We used Topup on the AP-PA b0 images to correct for susceptibility induced distortions, then applied these corrections on the DW-images along with eddy and motion corrections. Brain Extraction Tool obtains brain masks for the T1 and averaged b0 images. T1 MRIs were segmented into grey matter (GM), white matter (WM), and CSF partial volumes using FAST, then registered to b0 images with FLIRT. DTI and DKI tensor fitting was performed using the Dipy library6 from which we obtained DTI and DKI parametric maps, i.e. fractional anisotropy (FA), mean-, axial-, and radial-diffusivities (MD, AD, RD), kurtosis FA (kFA), mean-, axial-, and radial-kurtoses (MK, AK, RK). We evaluated these metrics at 14 HIV-relevant regions of interest (ROI) selected from the JHU-MNI-SS-type2 atlas (Figure 1).7 Large deformation diffeomorphic metric mapping (LDDMM)8 was used to spatially register each subject’s b0/FA images to JHU template b0/FA, and applying the inverse transform to warp the JHU atlas ROIs from template to subject space. Voxels with more than 30% CSF were excluded from analysis.
Statistical analysis was performed using R programming language. ROI-based group comparisons between HIV+ and controls were carried out for each metric using a t-test to find a significant difference with a p < 0.05 corrected for multiple comparisons using Bonferroni (p* < 0.05/14 = 0.00357). In addition, for each metric we calculated between-group effect size (Cohen’s d), and its correlation (Pearson’s r) with blood-based markers such as CD4 count and the log-transformed viral load (VL).
Results
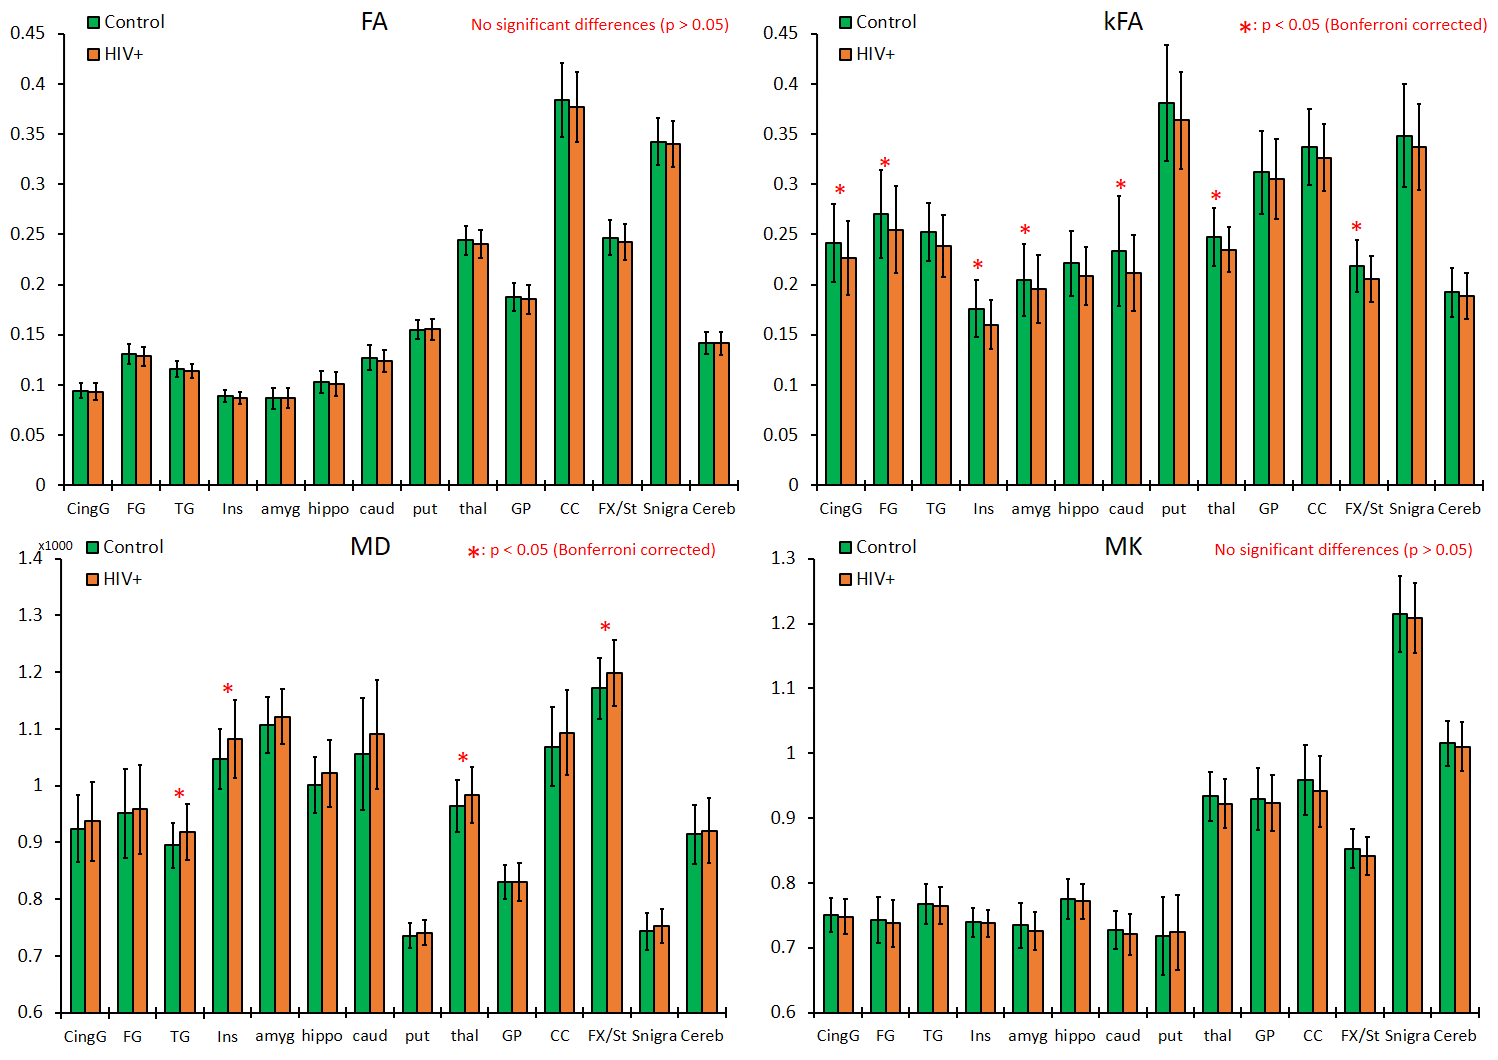
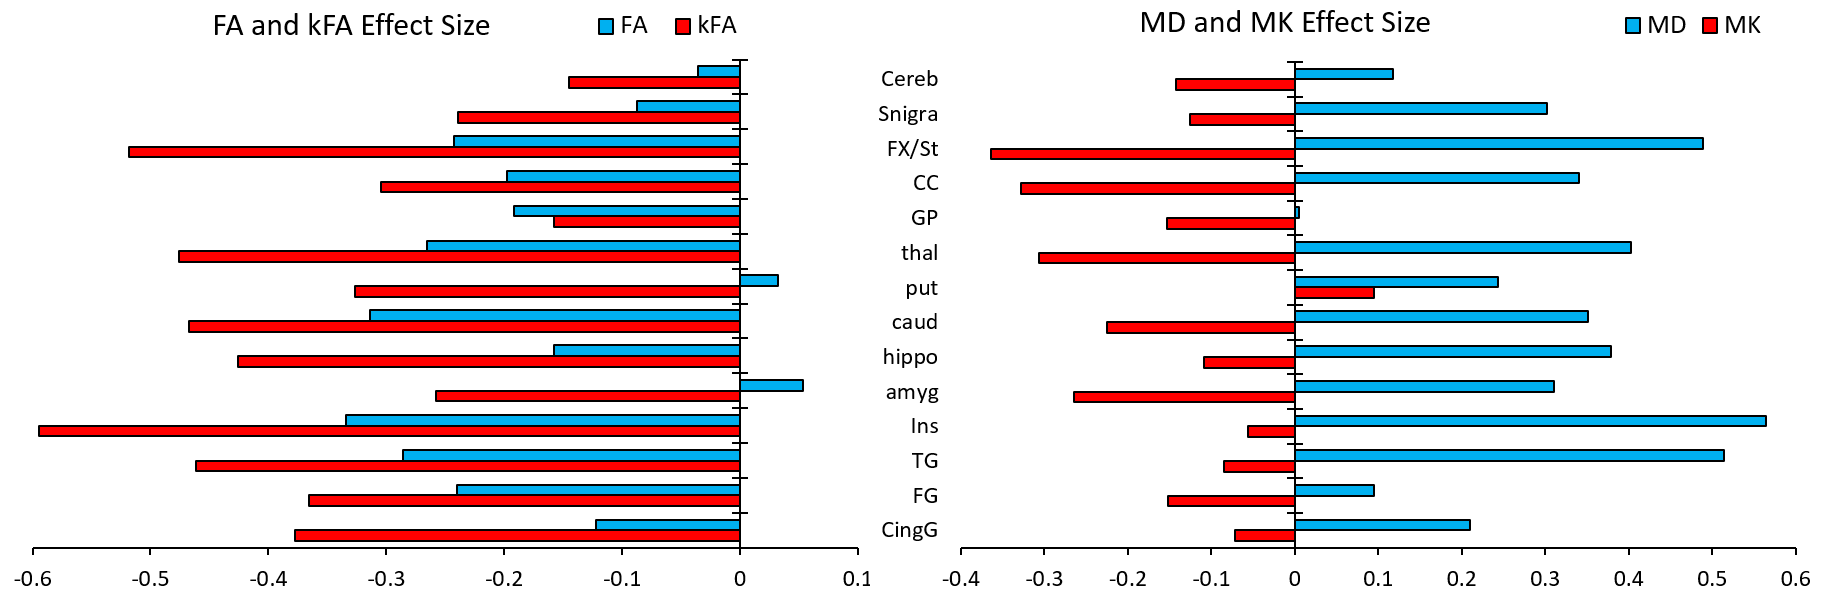
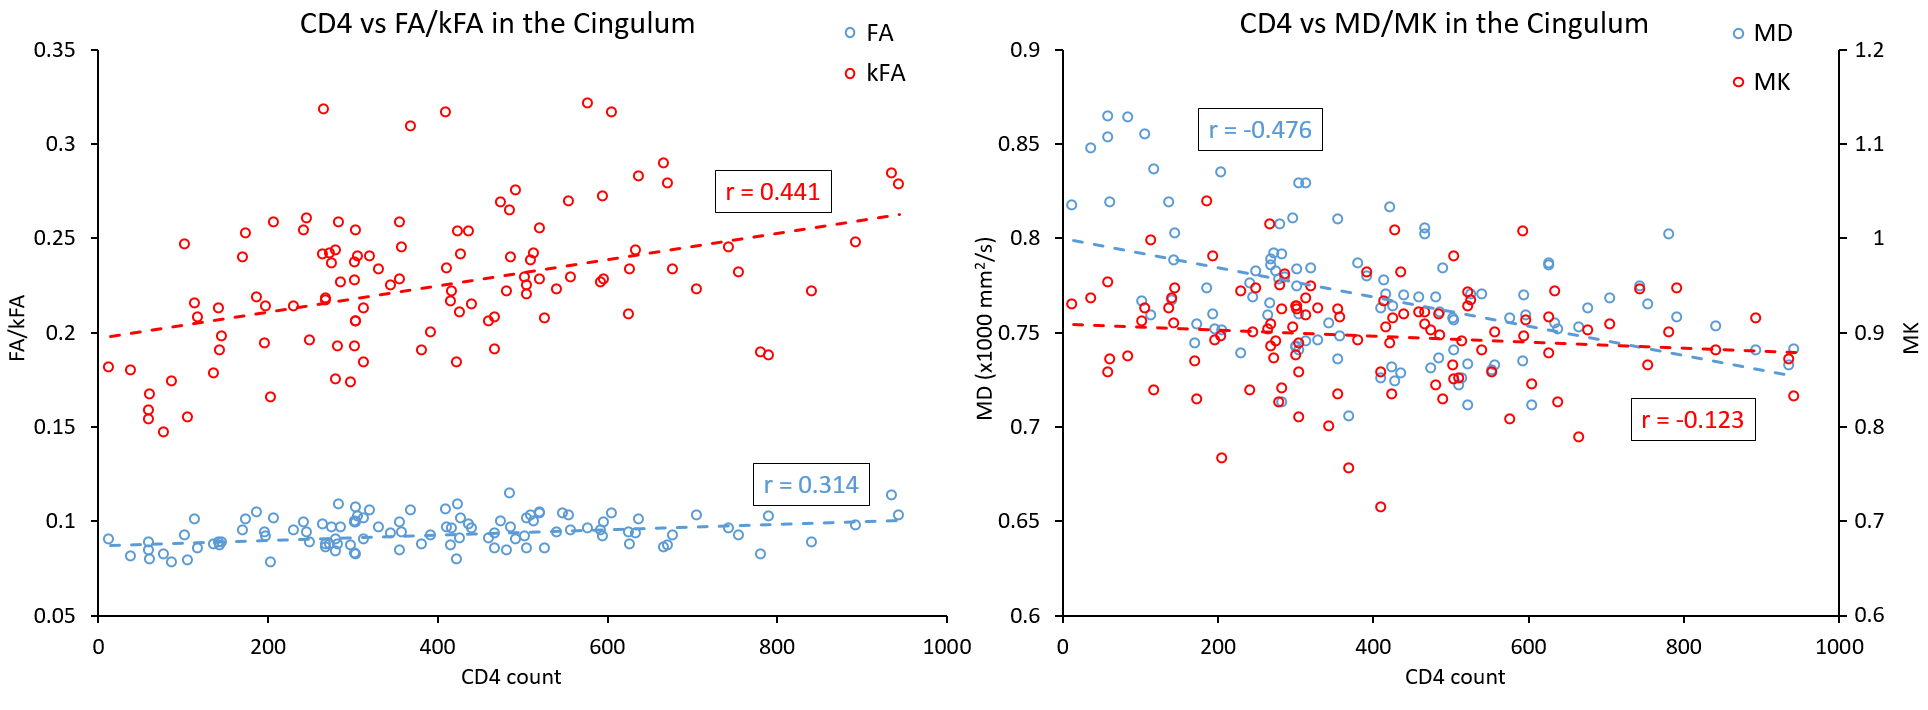
Our results displayed no significant differences in FA values between the two groups, whereas kFA was consistently lower in the HIV+ group for all ROIs (Figure 2), with significant decreases in the cingulum (CingG), frontal gyrus (FG), insula (Ins), amygdala (amyg), caudate (caud), thalamus (thal), and Fornix (Fx/St). Conversely, diffusivity metrics (MD, AD, RD) were significantly higher among HIV+ subjects, while kurtosis metrics (MK, AK, RK) did not show significant differences. This is reflected by the effect size comparison (Figure 3) showing a much higher magnitude of change with respect to kFA and MD values, than with FA and MK values respectively. Correlation analysis showed moderate correlations between kFA values and CD4 at multiple ROIs, particularly in the CingG (r = 0.441) (Figure 4). This was again reflected by DTI derived diffusivity metrics, with moderate correlation (r = -0.476) between MD and CD4 (Figure 4), while DTI FA and kurtosis metrics had little to no correlations. We also did not find any significant correlations between log VL and any imaging metrics, perhaps due to the much higher variance in log VL compared to CD4.Discussion
Our results indicate that MD and kFA are the strongest descriptors of HIV-related tissue damage in the brain. Significant between-group differences were observed in both WM (Fx/St, CingG) and GM structures, notably in the basal ganglia (thal, caud) and several gyri (FG, TG, Ins). This study also demonstrates that DTI metrics alone, particularly FA as a measure of WM integrity, cannot always provide a full description of HIV-related microstructural abnormalities. While this may be due to the lower neurovirulence of HIV clade-C or to the variability in duration of infection, DKI metrics show relatively more sensitive measures for evaluating microstructural damages due to HIV.Conclusion
Our findings indicate that a combined use of DKI and DTI can provide a better description of microstructural changes due to HIV clade-C infection in the brain and understanding of its neuropathology. Additionally, we look to explore free-water eliminated DTI/DKI measures which could further improve specificity for measuring structural changes in both the intracellular and extracellular spaces.Acknowledgements
Funding from NIH grant, R01 NS094043.References
1. Paul RH, Phillips S, Hoare J, et al. Neuroimaging abnormalities in clade C HIV are independent of Tat genetic diversity. J. Neurovirol. 2017;23(2):319–328.
2. Hoare J, Fouche J-P, Spottiswoode B, et al. White-Matter Damage in Clade C HIV-Positive Subjects: A Diffusion Tensor Imaging Study. J Neuropsychiatry Clin Neurosci. 2011;23(3):308-15.
3. O’Connor E, Jaillard A, Renard F, et al. Reliability of White Matter Microstructural Changes in HIV Infection: Meta-analysis and Confirmation. AJNR Am J Neuroradiol; 2017;38(8):1510-1519.
4. Jensen JH and Helpern JA. MRI quantification of non-Gaussian water diffusion by kurtosis analysis. NMR in Biomedicine; 2010;23(7):698-710.
5. Jenkinson M, Beckmann CF, Behrens TEJ, et al. FSL. NeuroImage; 2012;62:782-90.
6. Garyfallidis E, Brett M, Amirbekian B, et al. DIPY, a library for the analysis of diffusion MRI data. Frontiers in Neuroinformatics; 2014;8(8).
7. Oishi K, Faria A, Jiang H, et al. Atlas-based whole brain white matter analysis using large deformation diffeomorphic metric mapping: application to normal elderly and Alzheimer's disease participants. Neuroimage; 2009;46(2):486-99.
8. Ceritoglu C, Tang X, Chow M, et al. Computational analysis of LDDMM for brain mapping. Front. Neurosci.; 2013;7:151.
Figures