0485
Dynamics of hypercellular glioma regions identified with diffusion-weighted imaging for adaptive radiotherapy on an MR-Linac1Physical Sciences Platform, Sunnybrook Research Institute, Toronto, ON, Canada, 2Department of Medical Biophysics, University of Toronto, Toronto, ON, Canada, 3Department of Radiation Oncology, Sunnybrook Health Sciences Centre, Toronto, ON, Canada, 4Department of Medical Imaging, Sunnybrook Health Sciences Centre, Toronto, ON, Canada, 5Department of Neurosurgery and Paediatric Neurosurgery, Medical University, Lublin, Poland
Synopsis
For radiotherapy of high-grade glioma, dose escalation to hypercellular tumour could improve local control, but changes during treatment might necessitate target volume adaptation. Since hypercellular tumour causes low apparent diffusion coefficient (ADC) values, volumetric changes in low-ADC regions were quantified using near-daily MR-Linac imaging to evaluate adaptation necessity. Low-ADC regions increased in volume (median extremal change: 12.2%) and changed rapidly for certain patients (maximum growth/shrinkage rate: 7.1/9.1% per day). Low-ADC regions changed more in magnitude and grew more rapidly for resected tumours than intact ones. These findings imply that adaptation may be required for dose escalation to hypercellular glioma regions.
Introduction
MRI-linear accelerators (MR-Linacs/MRLs) enable daily target volume adaptation based on changes in tumour anatomy or physiology. Dose escalation (“boosting”) to therapy-resistant tumour regions may reduce rates of recurrence for high-grade gliomas1. A potential boost target in high-grade glioma is hypercellular tumour identified by low values of apparent diffusion coefficient (ADC), a parameter from diffusion-weighted imaging (DWI). A previous Phase II study showed that dose escalation to a hypercellular, hyperperfused region potentially extended survival2. However, the magnitude and rate of changes of hypercellular regions during radiotherapy is not clear. If significant changes occur, then using a fixed boost target may be insufficient. In this work, volumetric changes of a low-ADC region were quantified using near-daily MR-Linac DWI of glioma patients during radiotherapy. The low-ADC region was defined using a threshold (<1.25 µm2/ms). This threshold was chosen because of (1) the known ADC-cellularity correlation3-5, and (2) previous literature showing associations between overall survival and mid-treatment volume changes in this low-ADC region6. Using the same ADC threshold is justified by our previous work confirming that ADC values are comparable between the MR-Linac and diagnostic scanners7.Methods
Imaging: Patients with high-grade (III/IV) gliomas (N=56) were treated on a 1.5T Elekta Unity MR-Linac. MRI treatment planning was performed on a Philips Ingenia 1.5T or Achieva 3T (“MR-sim”), less than two weeks from treatment start. Single-shot EPI DWI were acquired (MRL: 2.0×2.2×5.0 mm3 voxels, b-values in 0—800 s/mm2; Ingenia: 1.1×1.5×5.0 mm3 voxels, b-values in 0—1000 s/mm2; Achieva: 1.5×1.5×3.0 mm3 voxels, b-values in 0—1000 s/mm2), as well as T1-weighted images. DWI was performed on the MR-Linac on days one through four of each five-day week.Image processing: For each patient, the MR-Linac and MR-sim scans were aligned by rigid registration using FSL FLIRT8,9. The gross tumour volume (GTV) was propagated to the same geometry by rigid registration of the planning CT and T1-weighted scans. DWI were resampled to the acquisition resolution then fit voxel-wise to produce ADC maps, as described previously7, with subsets of the b-values (MR-Linac: [200,400,800] s/mm2, MR-sim: [200,400,600,800] s/mm2). Brain masks were generated using HD-BET10. All image analysis used MATLAB R2018b.
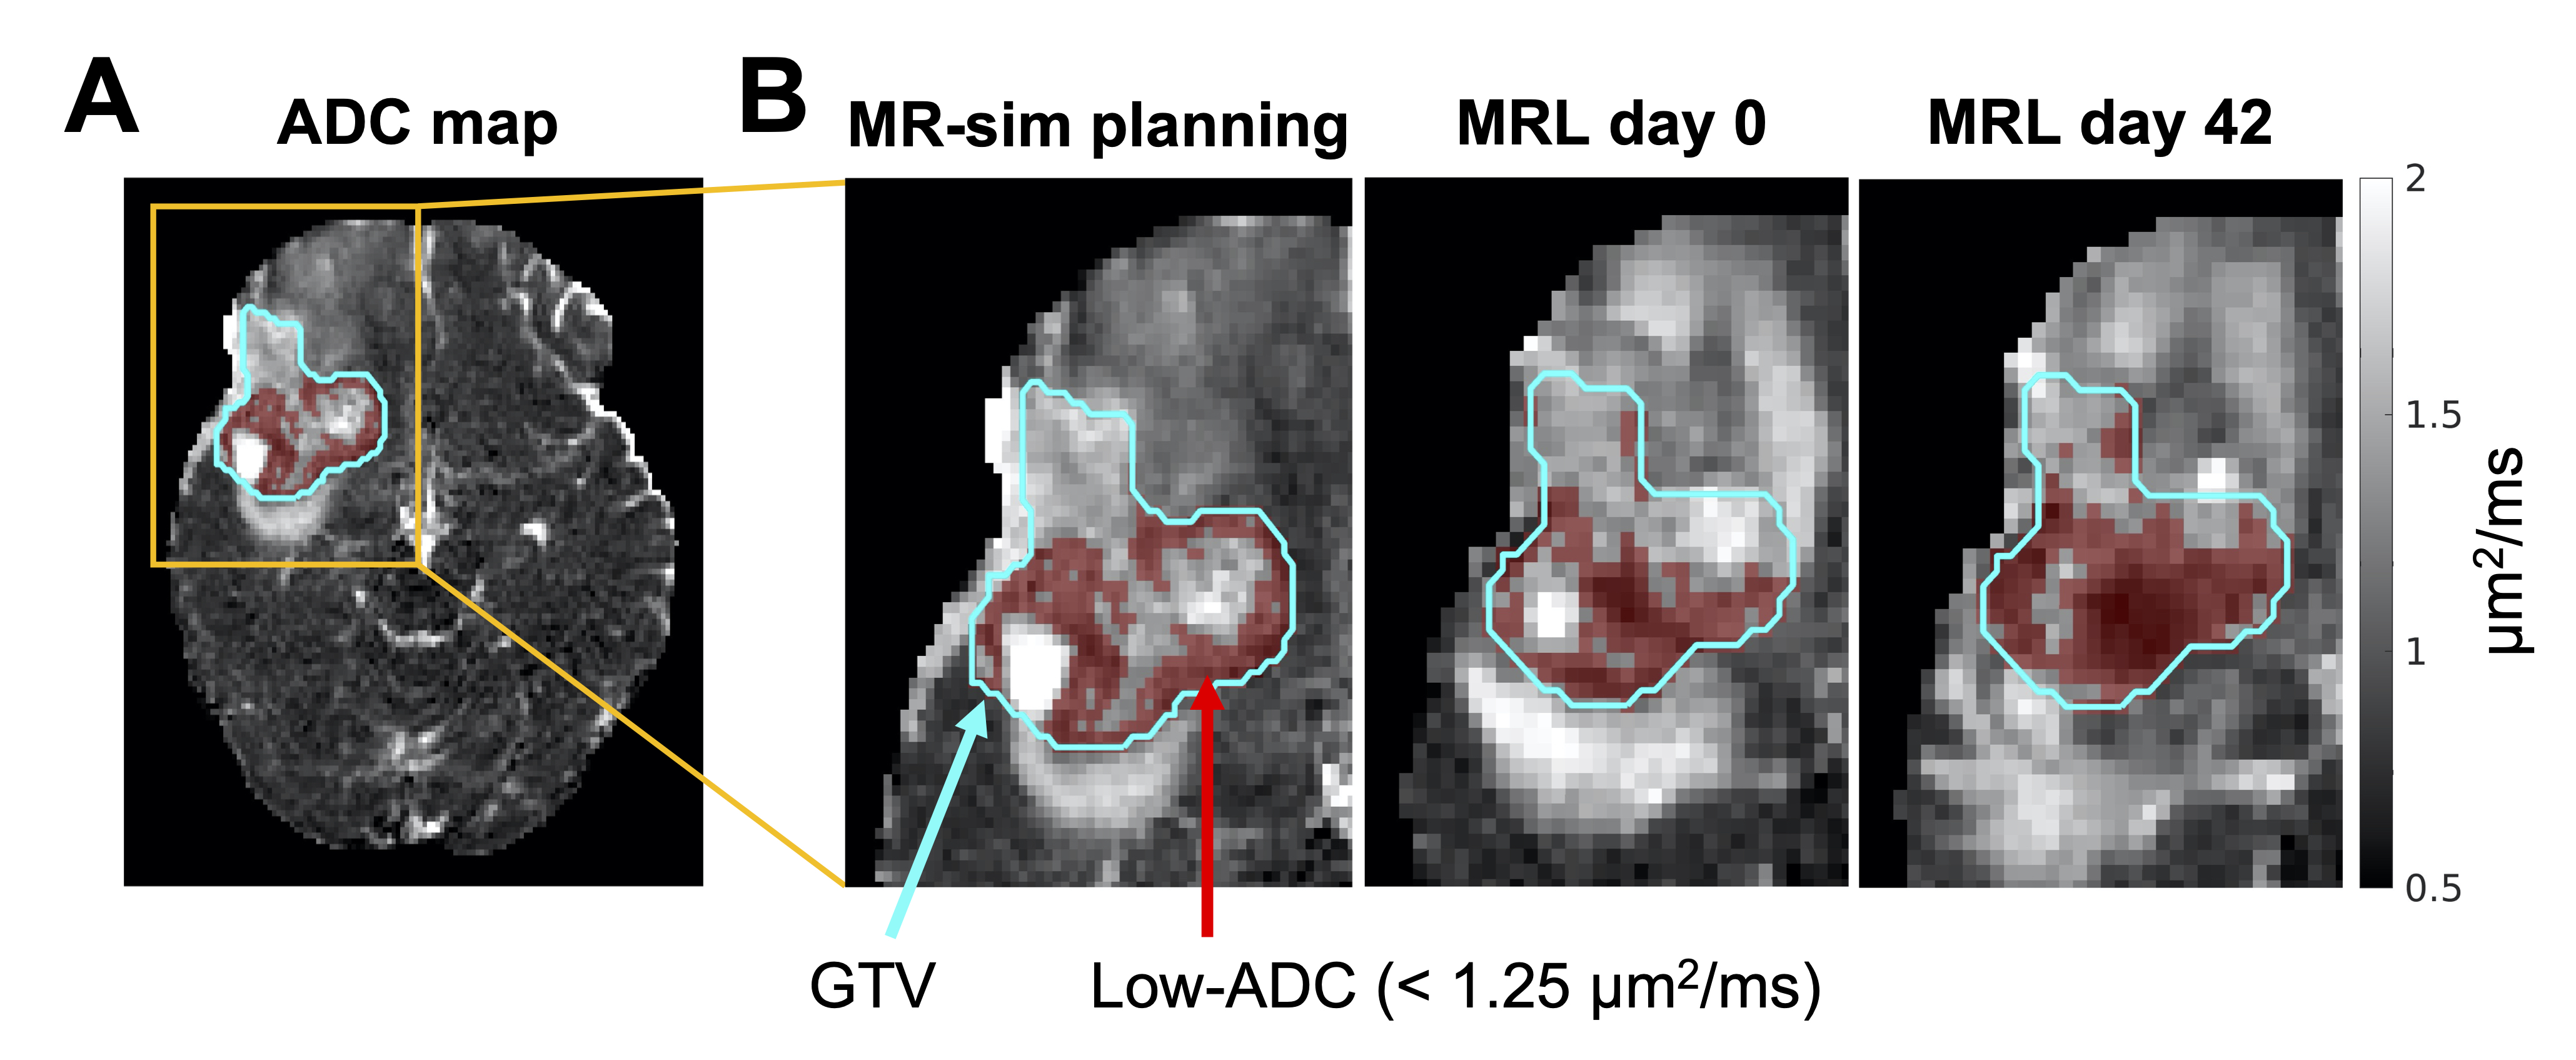
The low-ADC region was defined as the largest connected component of the set of voxels within the GTV having ADC<1.25 µm2/ms (Figure 1). Changes in the low-ADC volume ($$$V$$$) at each imaging session were calculated relative to the treatment planning scan. To compute the volume rate of change ($$$dV/dt$$$), the volume data were fit by LOESS regression11 and the derivative of the regression curve was evaluated. The greatest-magnitude (“extremal”) volume change and the maximum growth/shrinkage rates (magnitude of most positive/negative $$$dV/dt$$$ values) were computed.
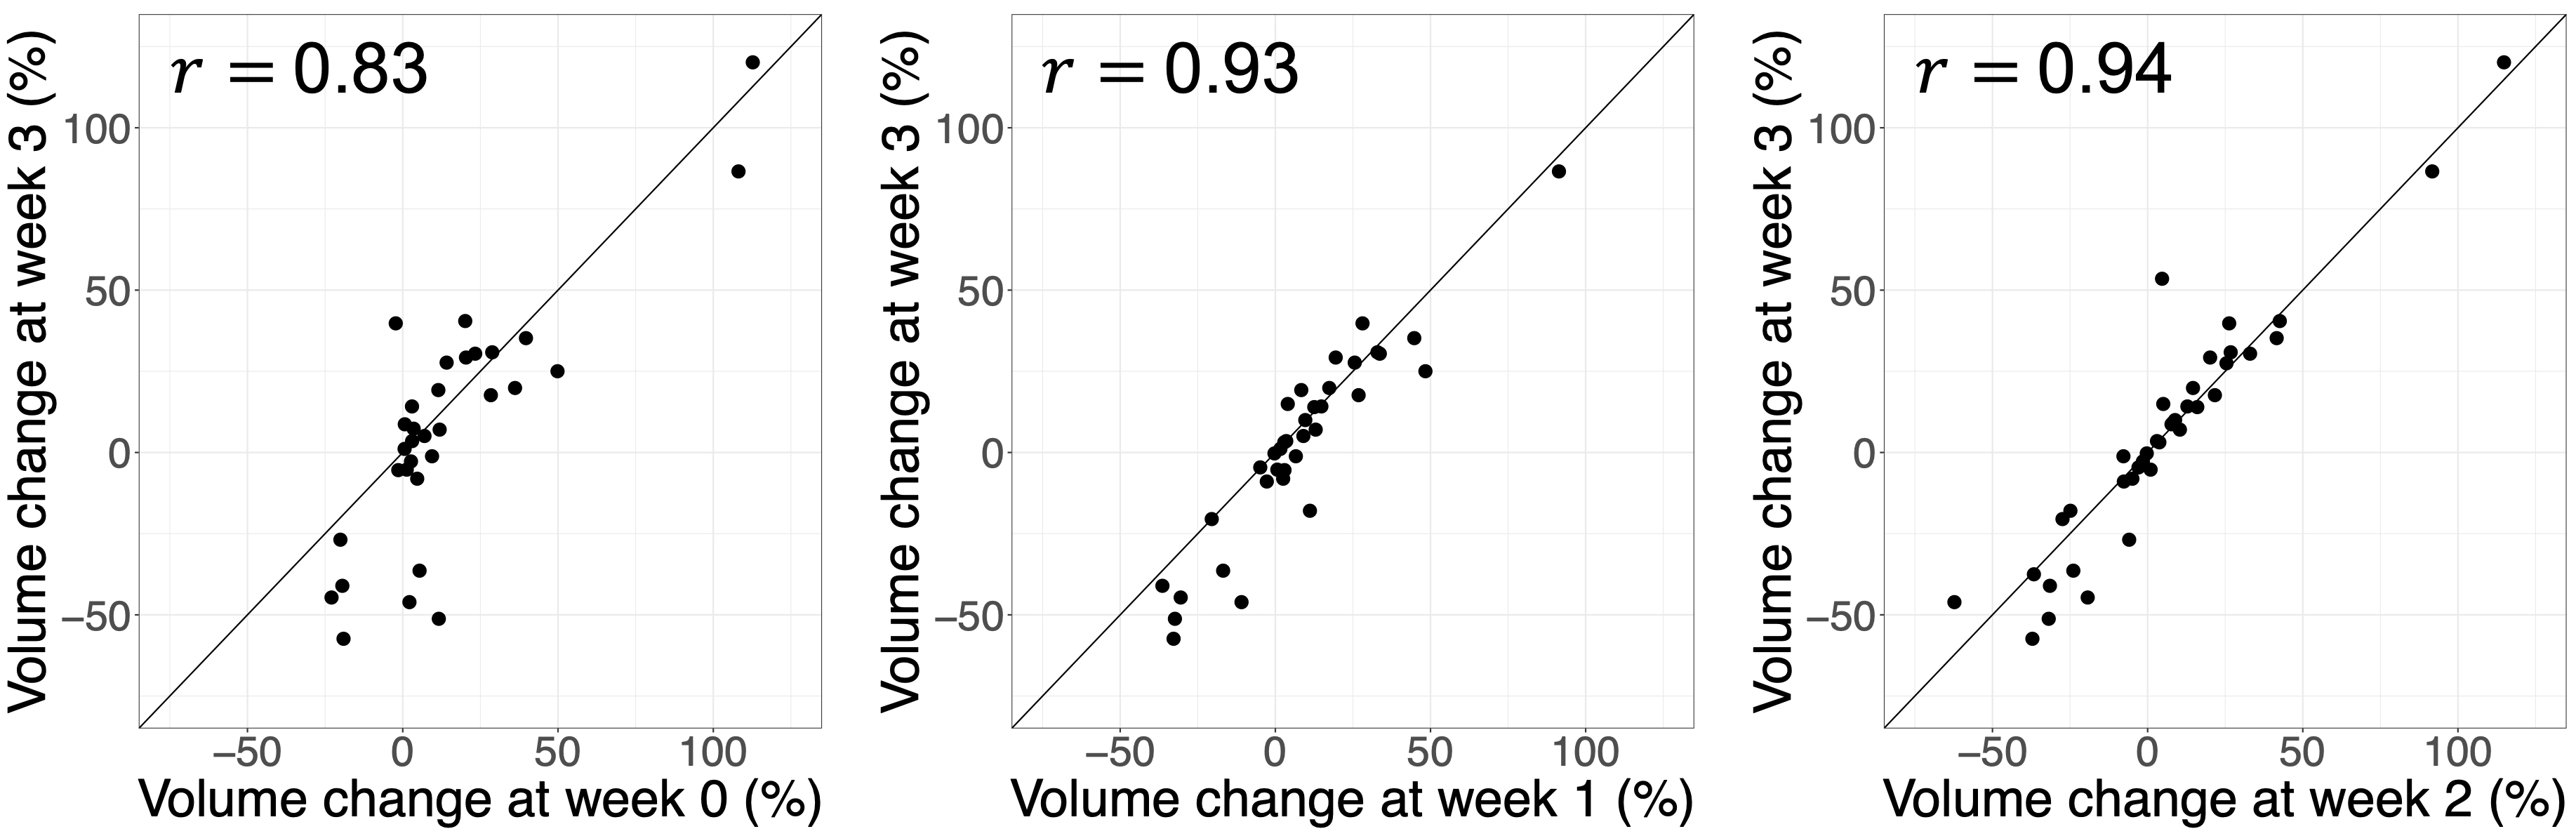
Statistical analysis: First, Pearson’s correlation coefficients were computed between the volume change (relative to treatment planning) at week 3 (days 19-21) and at weeks 0 (days 0-2), 1 (days 5-7), and 2 (days 12-14). Second, a one-sided Wilcoxon rank-sum test was used on the hypothesis that partially or completely resected tumours exhibited greater extremal changes and maximum growth rates than intact ones. Within each analysis, p-values were adjusted for multiple comparisons using Holm’s method12 and a significance threshold of $$$\alpha=0.05$$$ was applied. Statistics used R v3.6.1.
Results
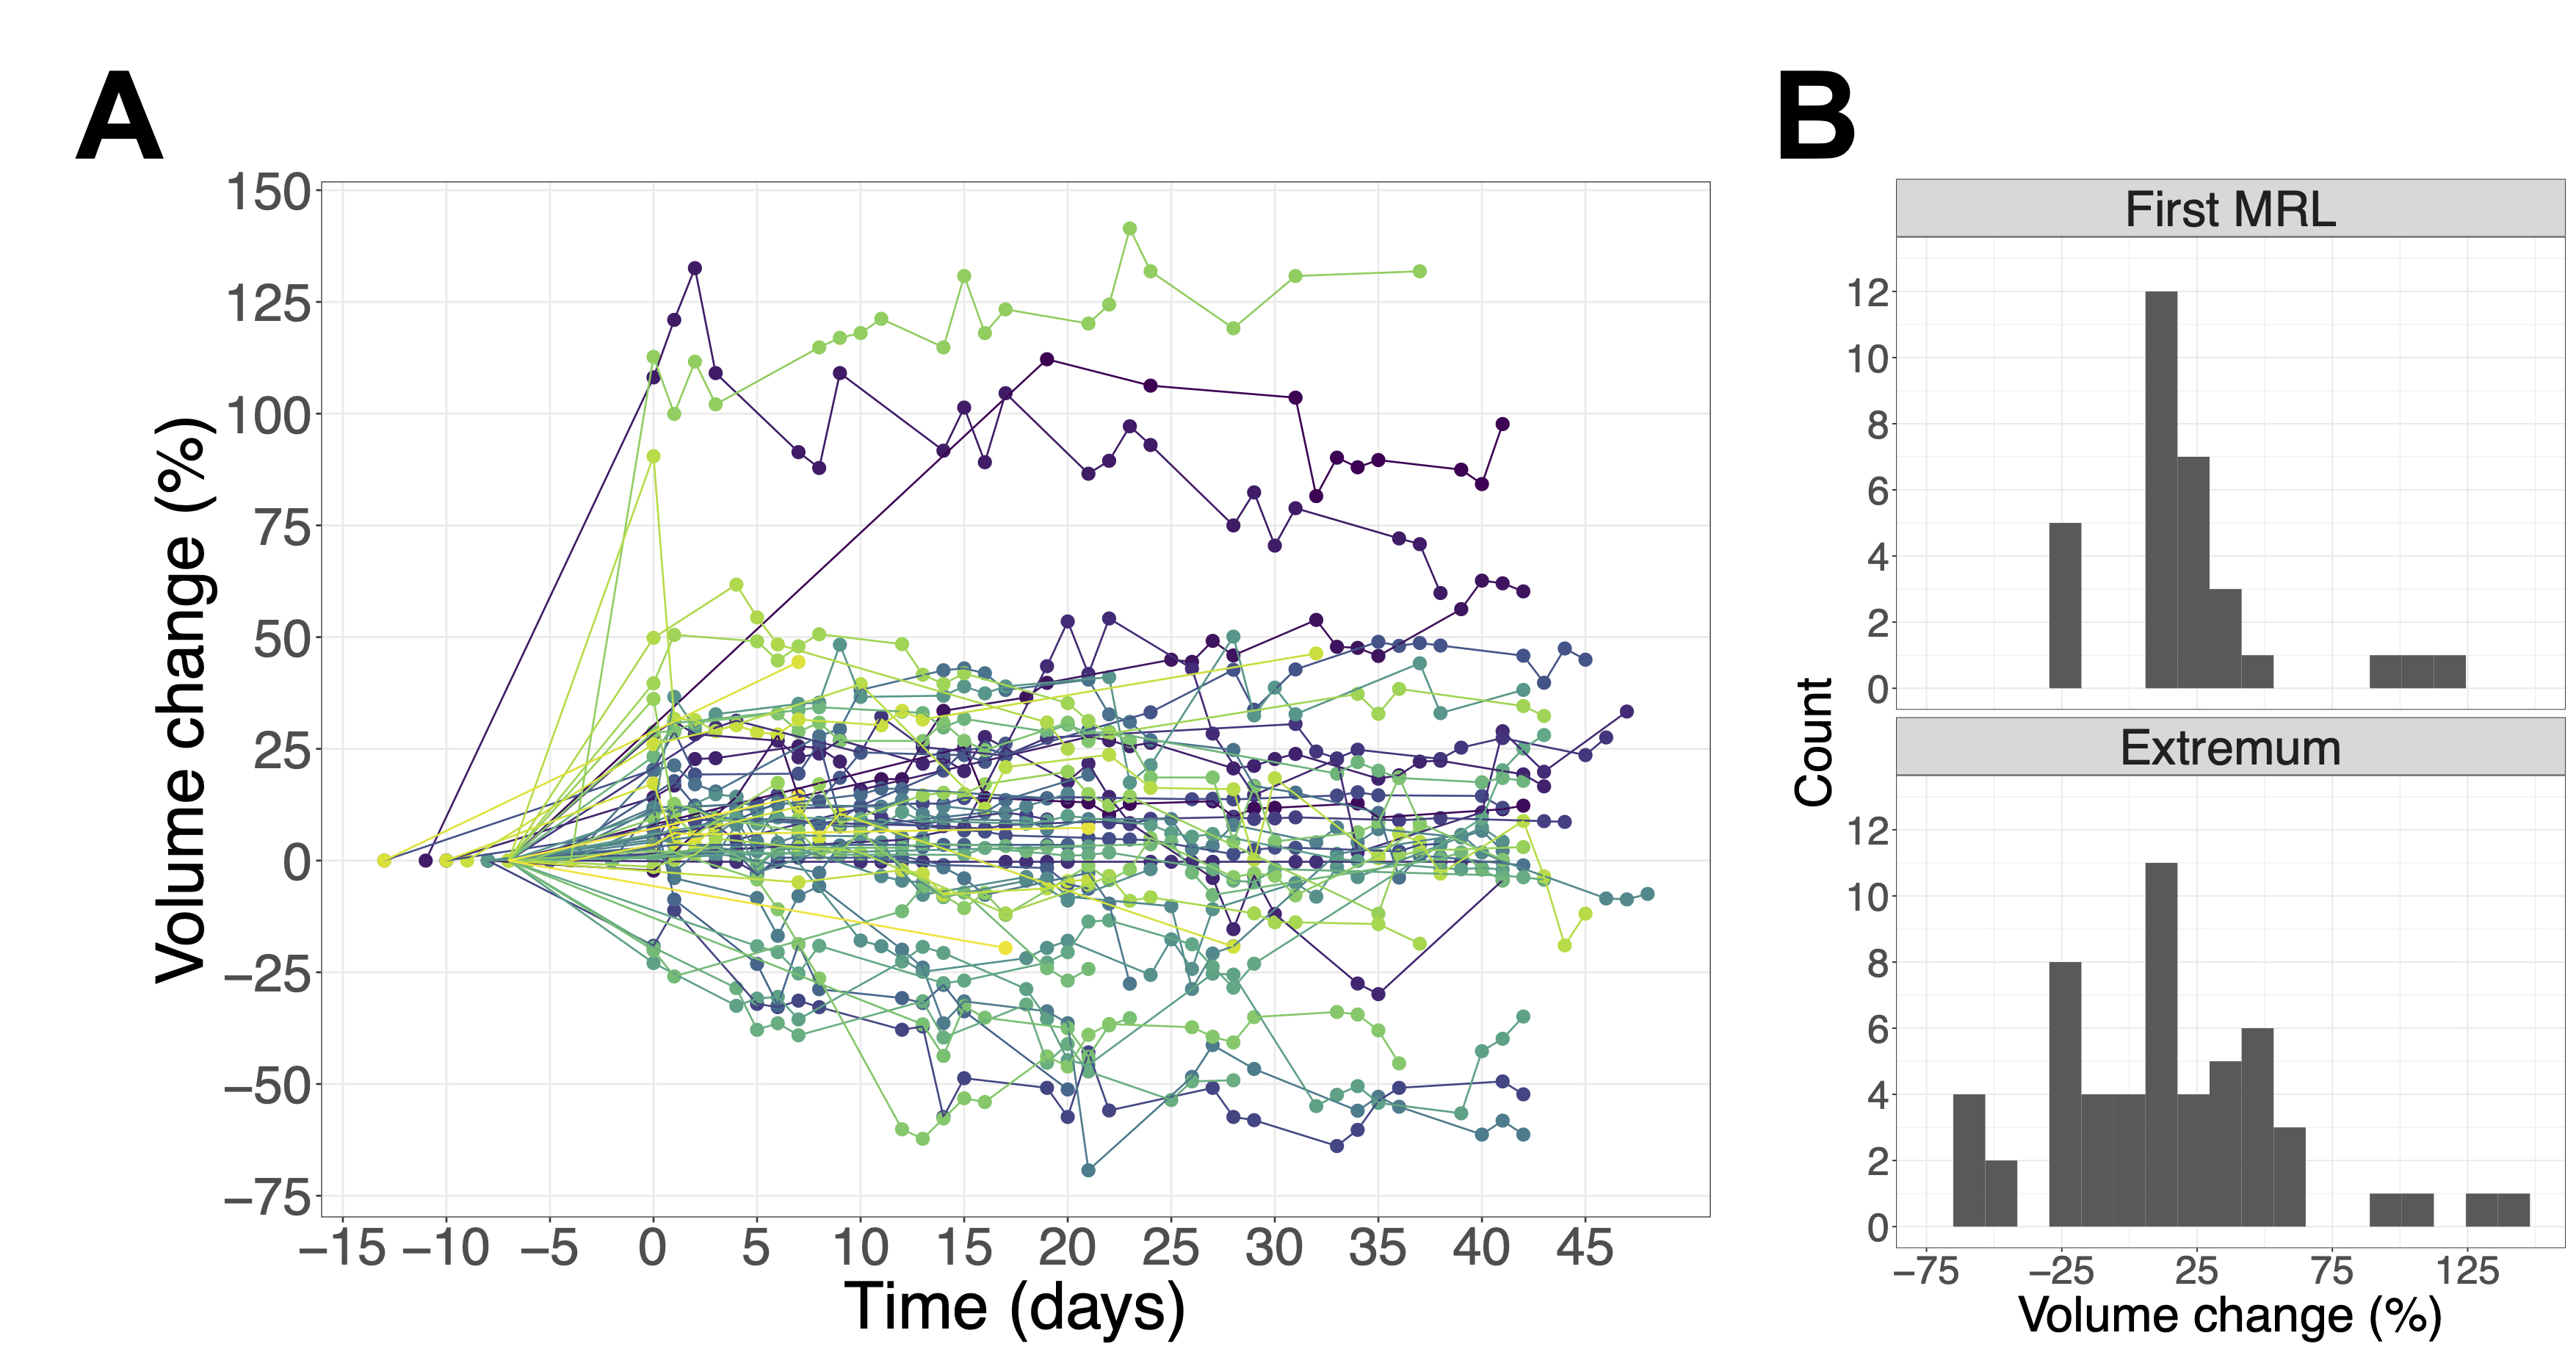
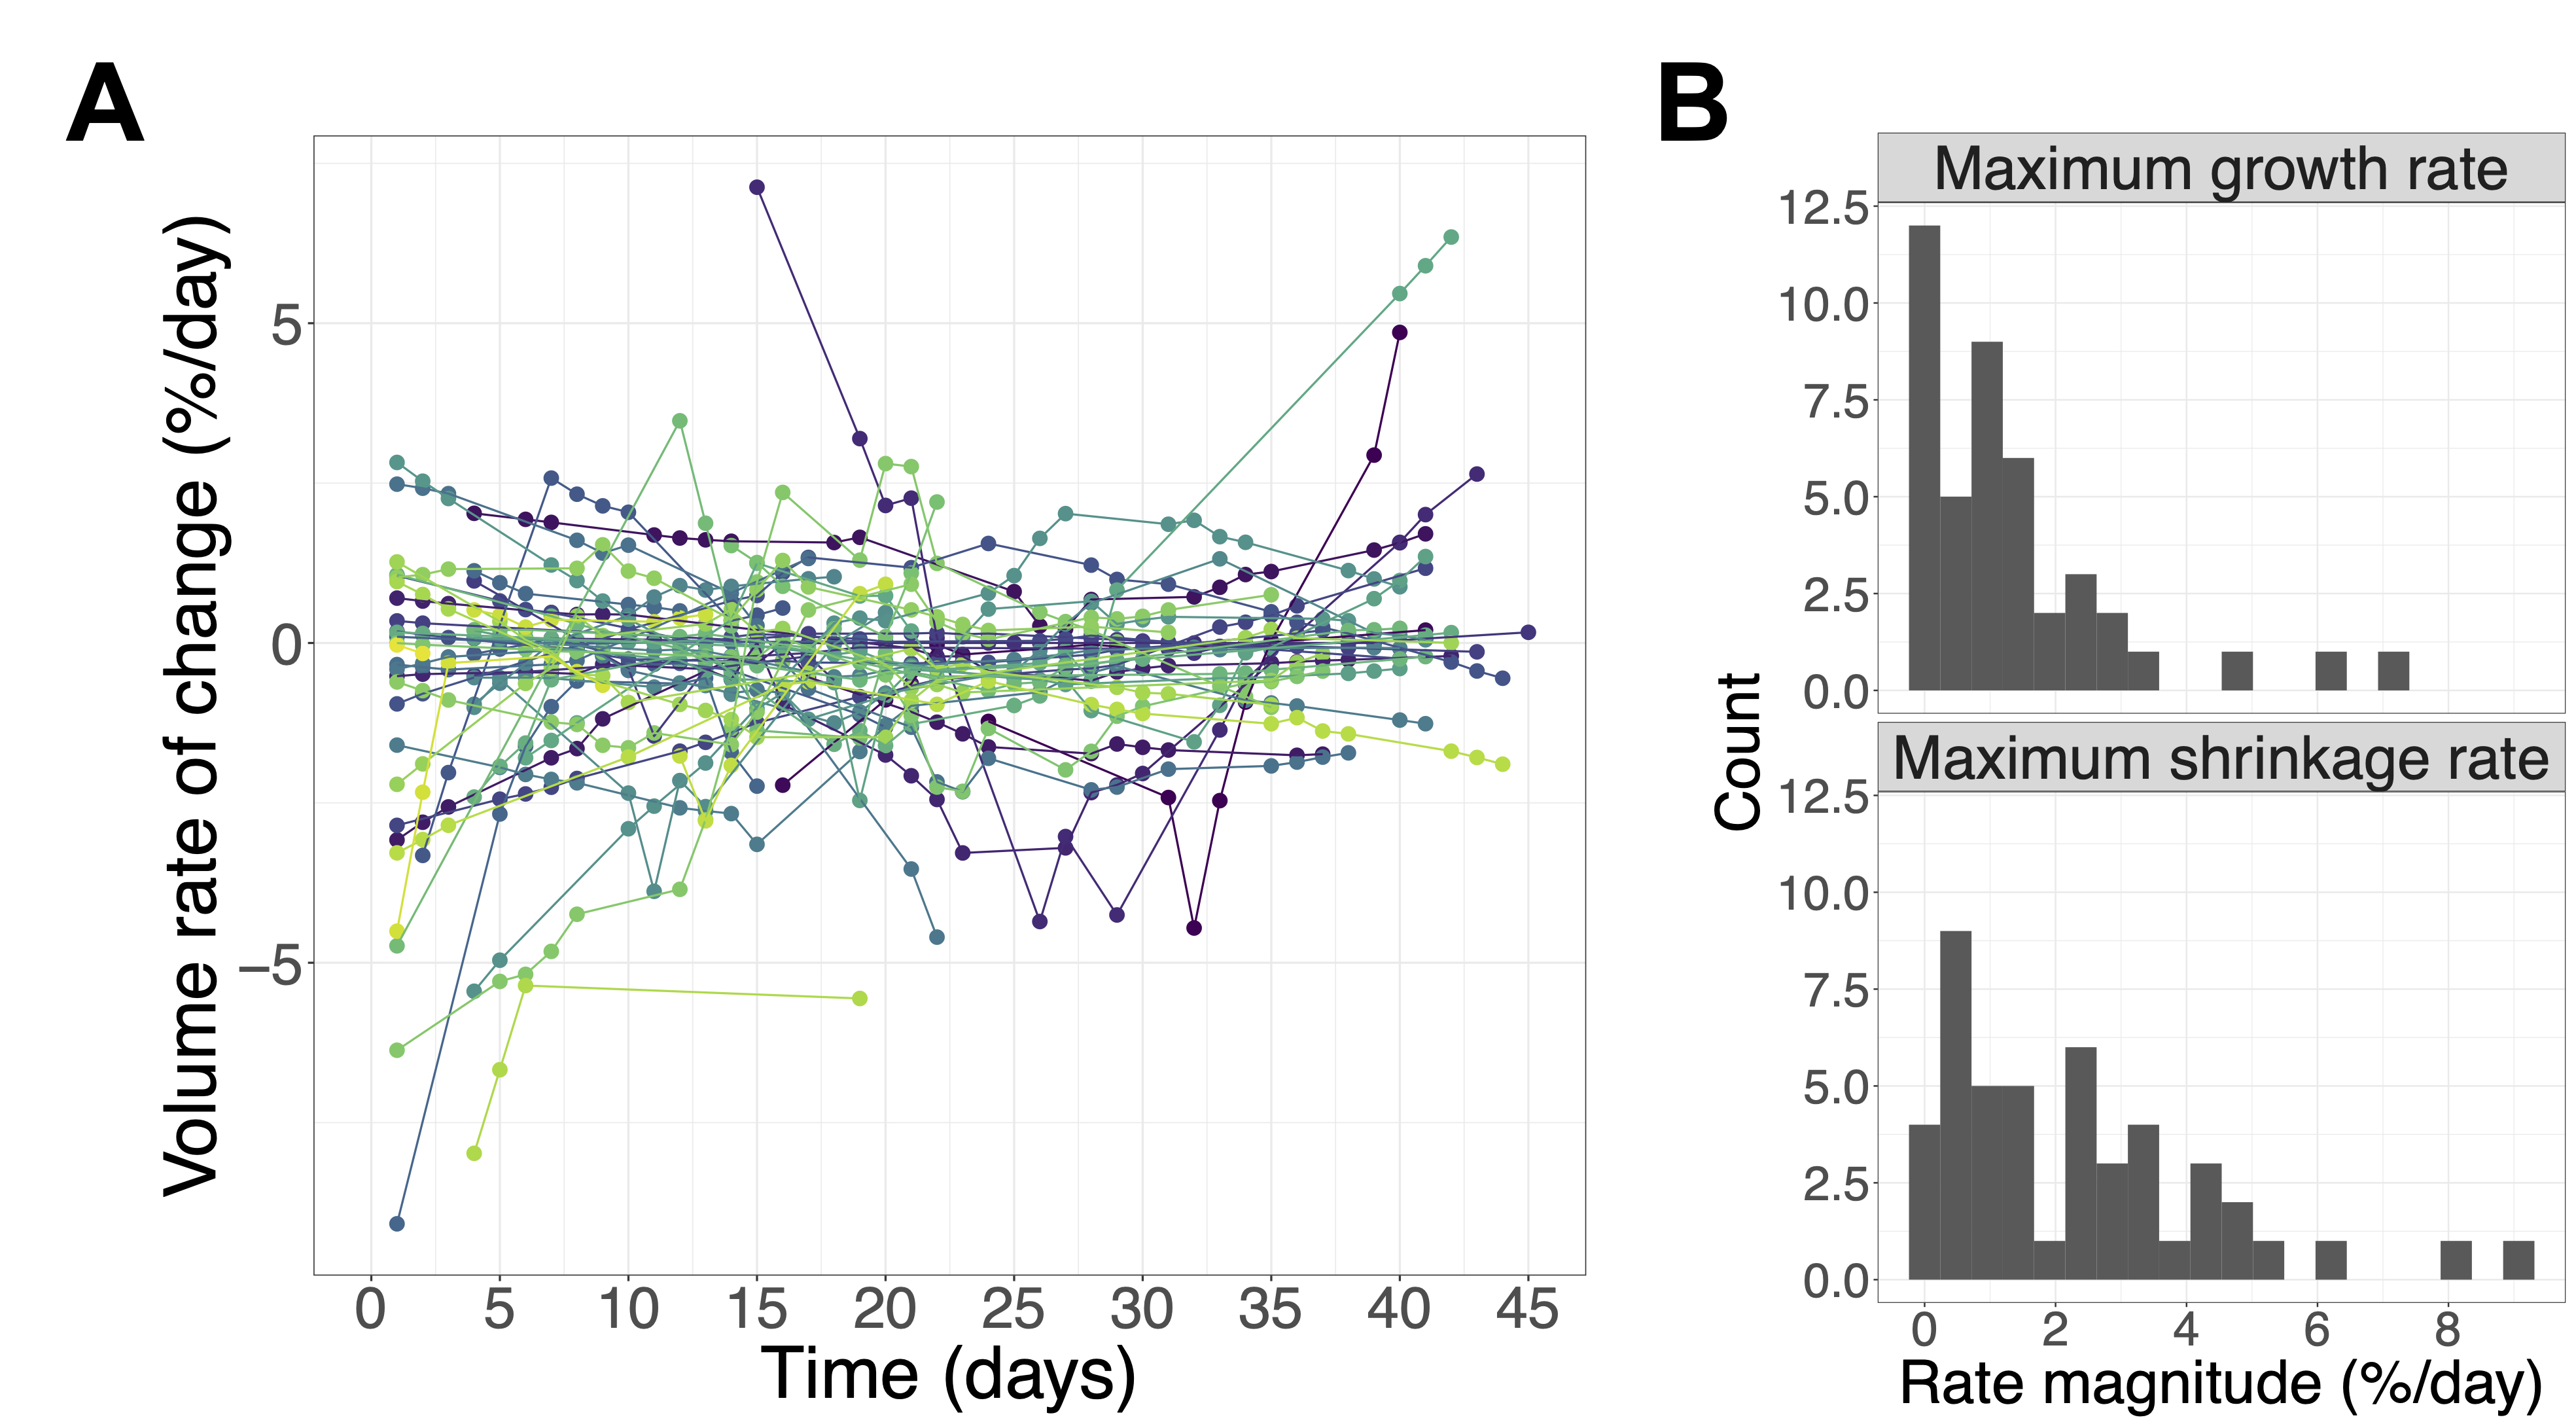
Median volume changes relative to treatment planning were as follows: first MR-Linac session (day<7): 8.4% (IQR=[1.7,20.2], range=[-23,113], N=47); mid-treatment (days 19-21): 7.2% (IQR=[-6.1,26], range=[-57,120], N=48); extremal change: 12.2% (IQR=[-19,35], range=[-69,141], N=56) (Figure 2). The medians for the maximum growth rate and maximum shrinkage rate were 1.0%/day (IQR=[0.22,1.8], range=[0.0077,7.1], N=43) and 1.8%/day (IQR=[0.62,3.3], range=[0.0088,9.1], N=47), respectively (Figure 3).The volume change at weeks 0, 1, and 2 was positively correlated with the volume change at week 3 ($$$r=0.83,0.93,0.94$$$, respectively; $$$p<10^{-3}$$$ for all). (Figure 4). Resected tumours showed greater maximum growth rates and extremal volume changes than intact ones ($$$p=.041$$$, N=43 and $$$p=.041$$$, N=56, respectively) (Figure 5A).
Discussion
Low-ADC regions within the GTV tended to increase in volume during radiotherapy relative to planning and changed at rates of up to 9.1%/day. Our finding that low-ADC volumes change during therapy agrees with that of Chenevert et al6. Our median volume change at 3 weeks differed (+7.2% versus -7.8%), but whether this discrepancy is significant is difficult to evaluate because Chenevert et al. did not report the variability of this quantity. Changes in the low-ADC volume motivate target adaptation if these regions are dose-escalated.Surgical resection predicted greater and more rapid low-ADC volume increases. A possible explanation is that as the resection cavity shrinks during radiotherapy13-15, more tissue enters the GTV, which increases the low-ADC volume (Figure 5B). Adapting the radiation boost target may require multiple image contrasts to distinguish surgical cavity changes from growth of hypercellular tumour.
Early changes in the low-ADC volume were positively correlated with the change at week 3, which has previously been shown to predict overall survival6. This suggests that early changes can guide boost target definition. Future validation will include correlating volume changes with treatment response once outcome data have matured.
Conclusion
Low-ADC regions, which may reflect hypercellular tumour, can change substantially in volume relative to treatment planning and grow or shrink rapidly. Dose escalation to these targets may benefit from adaptations using an MR-Linac.Acknowledgements
We thank the MR-Linac radiation therapists Shawn Binda, Danny Yu, Renée Christiani, Katie Wong, Helen Su, Monica Foster, Rebekah Shin, Khang Vo, Ruby Bola, Susana Sabaratram, Christina Silverson and Anne Carty for scanning and for their assistance with the protocol; Mikki Campbell for study coordination; Brian Keller and Brige Chugh for MR-Linac operations; Dr. Hanbo Chen for statistical advice; and Wilfred Lam for (very) useful advice. We gratefully acknowledge the following sources of funding: Natural Sciences and Engineering Research Council; Terry Fox Research Institute; Canadian Institutes of Health Research; and Canadian Cancer Society Research Institute.References
1. Kim MM, Speers C, Li P, et al. Dose-intensified chemoradiation is associated with altered patterns of failure and favorable survival in patients with newly diagnosed glioblastoma. J Neurooncol. 2019;143(2):313-319. doi:10.1007/s11060-019-03166-3
2. Kim MM, Sun Y, Aryal MP, et al. A Phase II Study of Dose-Intensified Chemoradiation Using Biologically-Based Target Volume Definition in Patients with Newly Diagnosed Glioblastoma. Int J Radiat Oncol. Published online January 2021:S0360301621000936. doi:10.1016/j.ijrobp.2021.01.033
3. Chenevert TL, Stegman LD, Taylor JMG, et al. Diffusion Magnetic Resonance Imaging: an Early Surrogate Marker of Therapeutic Efficacy in Brain Tumors. J Natl Cancer Inst. 2000;92(24):2029-2036. doi:10.1093/jnci/92.24.2029
4. Sugahara T, Korogi Y, Kochi M, et al. Usefulness of diffusion-weighted MRI with echo-planar technique in the evaluation of cellularity in gliomas. J Magn Reson Imaging. 1999;9(1):53-60. doi:10.1002/(SICI)1522-2586(199901)9:1<53::AID-JMRI7>3.0.CO;2-2
5. Ellingson BM, Malkin MG, Rand SD, et al. Validation of functional diffusion maps (fDMs) as a biomarker for human glioma cellularity. J Magn Reson Imaging. 2010;31(3):538-548. doi:10.1002/jmri.22068
6. Chenevert T, Malyarenko D, Galbán C, et al. Comparison of Voxel-Wise and Histogram Analyses of Glioma ADC Maps for Prediction of Early Therapeutic Change. Tomography. 2019;5(1):7-14. doi:10.18383/j.tom.2018.00049
7. Lawrence LSP, Chan RW, Chen H, et al. Accuracy and precision of apparent diffusion coefficient measurements on a 1.5 T MR-Linac in central nervous system tumour patients. Radiother Oncol. Published online September 2021:S0167814021067438. doi:10.1016/j.radonc.2021.09.020
8. Jenkinson M, Smith S. A global optimisation method for robust affine registration of brain images. Med Image Anal. 2001;5(2):143-156. doi:10.1016/S1361-8415(01)00036-6
9. Jenkinson M, Bannister P, Brady M, Smith S. Improved Optimization for the Robust and Accurate Linear Registration and Motion Correction of Brain Images. NeuroImage. 2002;17(2):825-841. doi:10.1006/nimg.2002.1132
10. Isensee F, Schell M, Pflueger I, et al. Automated brain extraction of multisequence MRI using artificial neural networks. Hum Brain Mapp. 2019;40(17):4952-4964. doi:10.1002/hbm.24750
11. Cleveland WS, Grosse E, Shyu WM. Chapter 8: Local regression models. In: Statistical Models in S. Wadsworth & Brooks/Cole; 1992.
12. Holm S. A Simple Sequentially Rejective Multiple Test Procedure. Scand J Stat. 1979;6(2):65-70.
13. Stewart J, Sahgal A, Lee Y, et al. Quantitating Interfraction Target Dynamics During Concurrent Chemoradiation for Glioblastoma: A Prospective Serial Imaging Study. Int J Radiat Oncol. 2021;109(3):736-746. doi:10.1016/j.ijrobp.2020.10.002
14. Kim TG, Lim DH. Interfractional Variation of Radiation Target and Adaptive Radiotherapy for Totally Resected Glioblastoma. J Korean Med Sci. 2013;28(8):1233. doi:10.3346/jkms.2013.28.8.1233
15. Yang Z, Zhang Z, Wang X, et al. Intensity-modulated radiotherapy for gliomas:dosimetric effects of changes in gross tumor volume on organs at risk and healthy brain tissue. OncoTargets Ther. 2016;9:3545-3554. doi:10.2147/OTT.S100455
Figures