0484
MRI Urodynamics: A 3D approach to Bladder Biomechanics1Mechanical Engineering, University of Wisconsin-Madison, Madison, WI, United States, 2Radiology, University of Wisconsin-Madison, Madison, WI, United States, 3Urology, University of Wisconsin-Madison, Madison, WI, United States
Synopsis
Lower urinary track symptoms (LUTS) affect many older adults. Existing methods to evaluate the lower urinary tract are invasive and provide limited information about changes in bladder anatomy and detrusor muscle function. Use of non-invasive methods for the study of lower urinary tract anatomy and function has been limited. This pilot study demonstrates the feasibility of MRI urodynamics in healthy subjects and in LUTS patients. Future advancements in this study will be aimed at using the data acquired to further deepen the comprehension of the bladder voiding cycle.
Introduction
Lower urinary track symptoms (LUTS) generally progress with age[1]. The existing method procedure to evaluate lower urinary tract function in men with lower urinary tract symptoms, multichannel urodynamics, is invasive and does not provide any anatomic information[2]. Previous studies have demonstrated that MRI can provide both static and dynamic high fidelity 3D images of the bladder, prostate, and urethra[3]. Therefore, the aim of this pilot study is to implement an MRI urodynamics protocol for the comprehensive assessment of the bladder during voiding.Methods
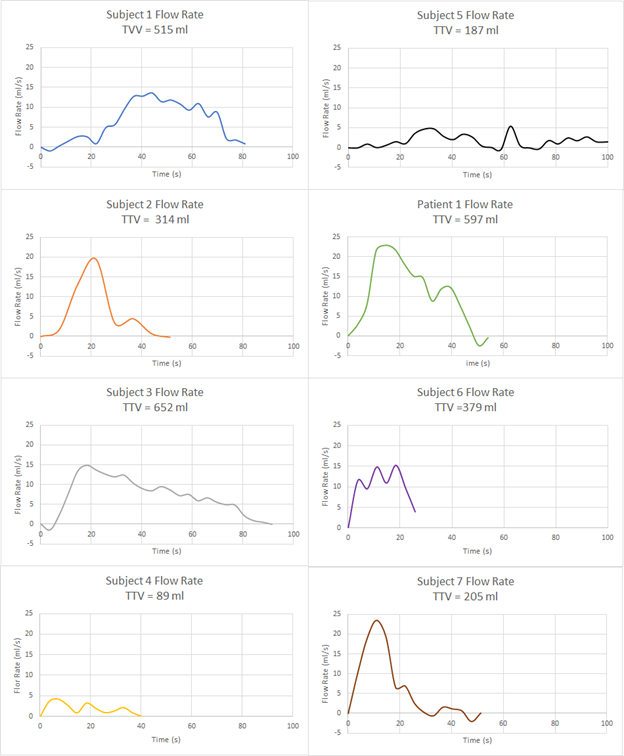
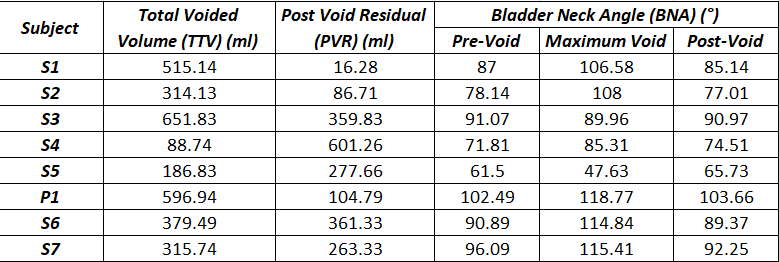
In this IRB approved and HIPAA compliant study, 7 healthy male subjects (46+-) with no history of LUTS and 1 patient with benign prostate hyperplasia (BPH) were recruited. A single weight-based dose (0.1 mmol/kg) of gadolinium-based contrast was prepared and 1/3 of the dose was hand injected 15 minutes prior to MRI. Prior to the MRI, subjects were equipped with a condom catheter. While voiding on a 3.0T scanner (Premier, GE Healthcare, Waukesha, WI) with a high-density flexible array coil (AIR Coil, GE Healthcare), a 3D Differential Subsampling with Cartesian Ordering (DISCO) Flex acquisition of the pelvis, centered on the bladder and prostate, was obtained at a temporal resolution of 3.7s. Images were imported into Mimics (Materialise, Leuven, Belgium), where the bladder lumen was segmented at each of time points. The segmentations were used to 1) create 3D renderings of the bladder lumen and 2) calculate bladder neck angle, bladder volume and post void residual (PRV)(Fig1). A voiding flow rate curve was generated using the volumetric data for each patient (Figure 2). Bladder neck angle (BNA) was measured previously described[4] . The BNA was calculated in three stages of the voiding process, prior to voiding (Pre-Void), during maximum flow rate (Maximum Flow Rate) and after voiding was complete (Post-Void). Total voided volume (TVV) was calculated as the difference between the initial bladder lumen volume and the PVR.Results
All subjects were able to void in the scanner and real time MR images were successfully obtained. 3D virtual models of the bladder lumen throughout the voiding process were created from the segmentation of the images. Table 1. summarizes the quantitative results. BNA increased substantially in subjects 1, 2, 6 and 7 between the resting BNA and maximum flow rate BNA. High variability was found in PVR. Subjects 3, 6 and 7 display TTVs between 300 and 500 ml, subjects 1,3 and patient 1 voided in the 500 to 700 ml range and only subject 4 and 5 voided under the 200 ml. Figures 2 and 3 show distinct voiding patterns between patient voiding cycles. These are observed in varying time length, maximum and average flow rate, TTV, PVR, and high frequency flowrate variations. BNA variations can be observed throughout all the patients, the maximum variations in BNA are observed in the phase where the maximum flow rate is recorded for each patient in figure 2. As the volumetric flow increases though the voiding event, the bladder neck displaces towards lower pelvis in a funnel shape favoring the urine flow until it reaches maximum rate (Fig1 A). When the flow rate starts to decrease the bladder starts shifting again until it reaches its original position once again with the PVR.Discussion
A Dynamic MRI protocol capable of acquiring images with high contrast, volumetric coverage of the bladder and prostate during voiding was implemented. This protocol provides anatomical data and functional bladder information, such as volumetric displacement of the bladder neck during the voiding event to facilitate the urinary flow through the urethra. The functional and anatomical information that results from this non-invasive methodology provides an invaluable tool that has the potential to improve our knowledge of the lower urinary tract in healthy subjects and patients with LUTS and serve as a non-invasive clinical diagnostic tool.An overall trend observed in the bladder voiding events is that independent of the subject the bladder descends during the voiding cycle. These displacements of the bladder neck vary from patient to patient but there is a prevalence of an initialization phase where the bladder descends before reaching maximum voiding rate. A stabilization phase where the bladder neck remains in the same area but keeps voiding at higher rates. And a recovery phase, where the voiding rate decreases again, and the bladder neck returns to its original position with a PVR. This can also be observed in the BNA calculations where the Pre-Void and Post-Void BNAs are similar but there are variations as the voiding event approaches the maximum flow rate.
Conclusion
This pilot study demonstrates the feasibility of MRI urodynamics in healthy subjects and in LUTS patients. Future advancements in this study will be aimed at using the data acquired to further deepen the comprehension of the bladder voiding cycle.Acknowledgements
The authors would like to acknowledge GE Healthcare and support from the NIH (R01 DK126850-01)References
1.G. Fananapazir, A. Kitich, R. Lamba, S. L. Stewart, and M. T. Corwin. Normal reference values for bladder wall thickness on CT in a healthy population, Abdominal Radiology. 2018;43(9)
2. R. Pewowaruk, D. Rutkowski, D. Hernando, B. B. Kumapayi, W. Bushman, and A. Roldán-Alzate. A pilot study of bladder voiding with real-time MRI and computational fluid dynamics. PLoS ONE;2020;15(11)
3. L. E. Anzia et al., “Comprehensive non-invasive analysis of lower urinary tract anatomy using MRI,” Abdominal Radiology. 2021;46(4)
4. Y. Li, Z. Chen, R. Zeng, J. Huang, Y. Zhuo, and Y. Wang, “Bladder Neck Angle Associated with Lower Urinary Tract Symptoms and Urinary Flow Rate in Patients with Benign Prostatic Hyperplasia,” Urology, 2021
Figures