0482
A Travelling Kidney study using a harmonised multiparametric renal MRI protocol1Sir Peter Mansfield Imaging Centre, University of Nottingham, Nottingham, United Kingdom, 2Department of Radiology, University of Cambridge, Cambridge, United Kingdom, 3Centre for Cardiovascular Science, University of Edinburgh, Edinburgh, United Kingdom, 4Department of Infection, Immunity and Cardiovascular Disease, University of Sheffield, Sheffield, United Kingdom, 5Neuroradiological Academic Unit, UCL Queen Square Institute of Neurology, University College London, London, United Kingdom, 6Dementia Research Centre, UCL Queen Square Institute of Neurology, University College London, London, United Kingdom, 7Wellcome Centre for Human Neuroimaging, UCL Queen Square Institute of Neurology, University College London, London, United Kingdom, 8Department of Radiology, Addenbrooke’s Hospital, Cambridge, United Kingdom
Synopsis
Standardisation and multicentre evaluation of renal MRI measures is crucial for clinical translation. Here we present results of a Travelling kidney study on GE, Philips and Siemens using a harmonised multiparametric renal MRI protocol, and show results of B0 and B1 mapping, T1, and T2* mapping. The mode B0 within the kidneys did not vary across vendors, however the FWHM was narrower for Vendor 1. No significant differences were seen in MOLLI T1 values of the renal cortex and medulla after this data was corrected for the offset in T1 seen in the NIST phantom.
INTRODUCTION
Harmonisation of MR protocols and standardisation of measures is crucial for the multicentre evaluation of clinical translation of renal MRI measures1. Here we perform a Travelling Kidney study to evaluate the impact of vendor on a multiparametric renal 3T MRI acquisition protocol that has been harmonised across vendors for field of view (FOV), spatial resolution, slice orientation and ordering, sequence timings (repetition time, echo time, inversion time, echo-spacing), bandwidth, flip angle, fat-suppression scheme and flow compensation, and vendor specific acceleration factors (ASSET, GRAPPA, SENSE).METHODS
A Travelling Kidney study was performed using a multiparametric renal MRI protocol harmonised across three 3T MR vendors (Philips, Siemens and GE) randomly assigned to Vendor 1, 2 and 3. Vendor 1 was a 60 cm bore scanner, and Vendors 2 and 3 were wide bore scanners with a 70 cm bore and one system had dual transmit capability. Data was acquired on six healthy volunteers (age 32±6 yrs), four participants were scanned on each of the three vendor scanners, two participants underwent scans on only two vendors. The protocol comprised of B0 and B1 mapping to characterise scanners, relaxometry (T1, T2 and T2* mapping), phase contrast (PC-MRI) and volumetric T1- and T2-weighted scans, and ASL scans. Results of B0 and B1 mapping, T1, and T2* mapping will be reported here, all measures were collected at end-expiration breathhold. B0 mapping used an in-phase dual-echo mapping scheme with phase images saved to generate B0 maps, B1+ mapping used the optimal sequence from each vendor: DREAM2 for Philips, TurboFLASH B1 mapping3 for Siemens and Bloch-Siegert4 for GE. T2* and T1 mapping was collected using both a 5-slice sequence acquisition with 1.5×1.5×5mm3 resolution, a single slice per breath-hold. The gradient echo (GRE) data was collected in-phase (TE/DTE = 4.61ms) and the T1 mapping was acquired using a Modified Look-Locker Imaging (MOLLI) sequence5 with 5(3)3 acquisition scheme. The ISMRM/NIST system phantom was used to evaluate the standardisation of T1 mapping, these phantom measures provided T1-mapping functions from which to correct the in-vivo T1 measures. Data were analysed using UKAT software6. For B0 and B1 analysis, whole kidney ROIs were manually defined on the B0 magnitude images and applied to both. For T1 and T2* analysis whole kidney ROIs were manually defined and histogram analysis was applied to segment the cortex from medulla7.RESULTS
Figure 1 shows histograms of B0 mapping, no significant difference in the mode of B0 was seen between vendors, but there was a significant difference in FWHM of the B0 histograms with Vendor 1 (the narrow bore system) having a significantly narrower FWHM at p=0.01 and p=0.02 compared to Vendors 2 and 3 respectively.The B1 shown on Figure 2 was found to significantly differ across scanners, with Vendor 1 having a significantly higher B1 at 103.7±4.1% of the nominal flip angle compared to vendors 2 (93.8±4.3%, p=0.01) and Vendor 3 (85.2±4.6%, p=0.02).
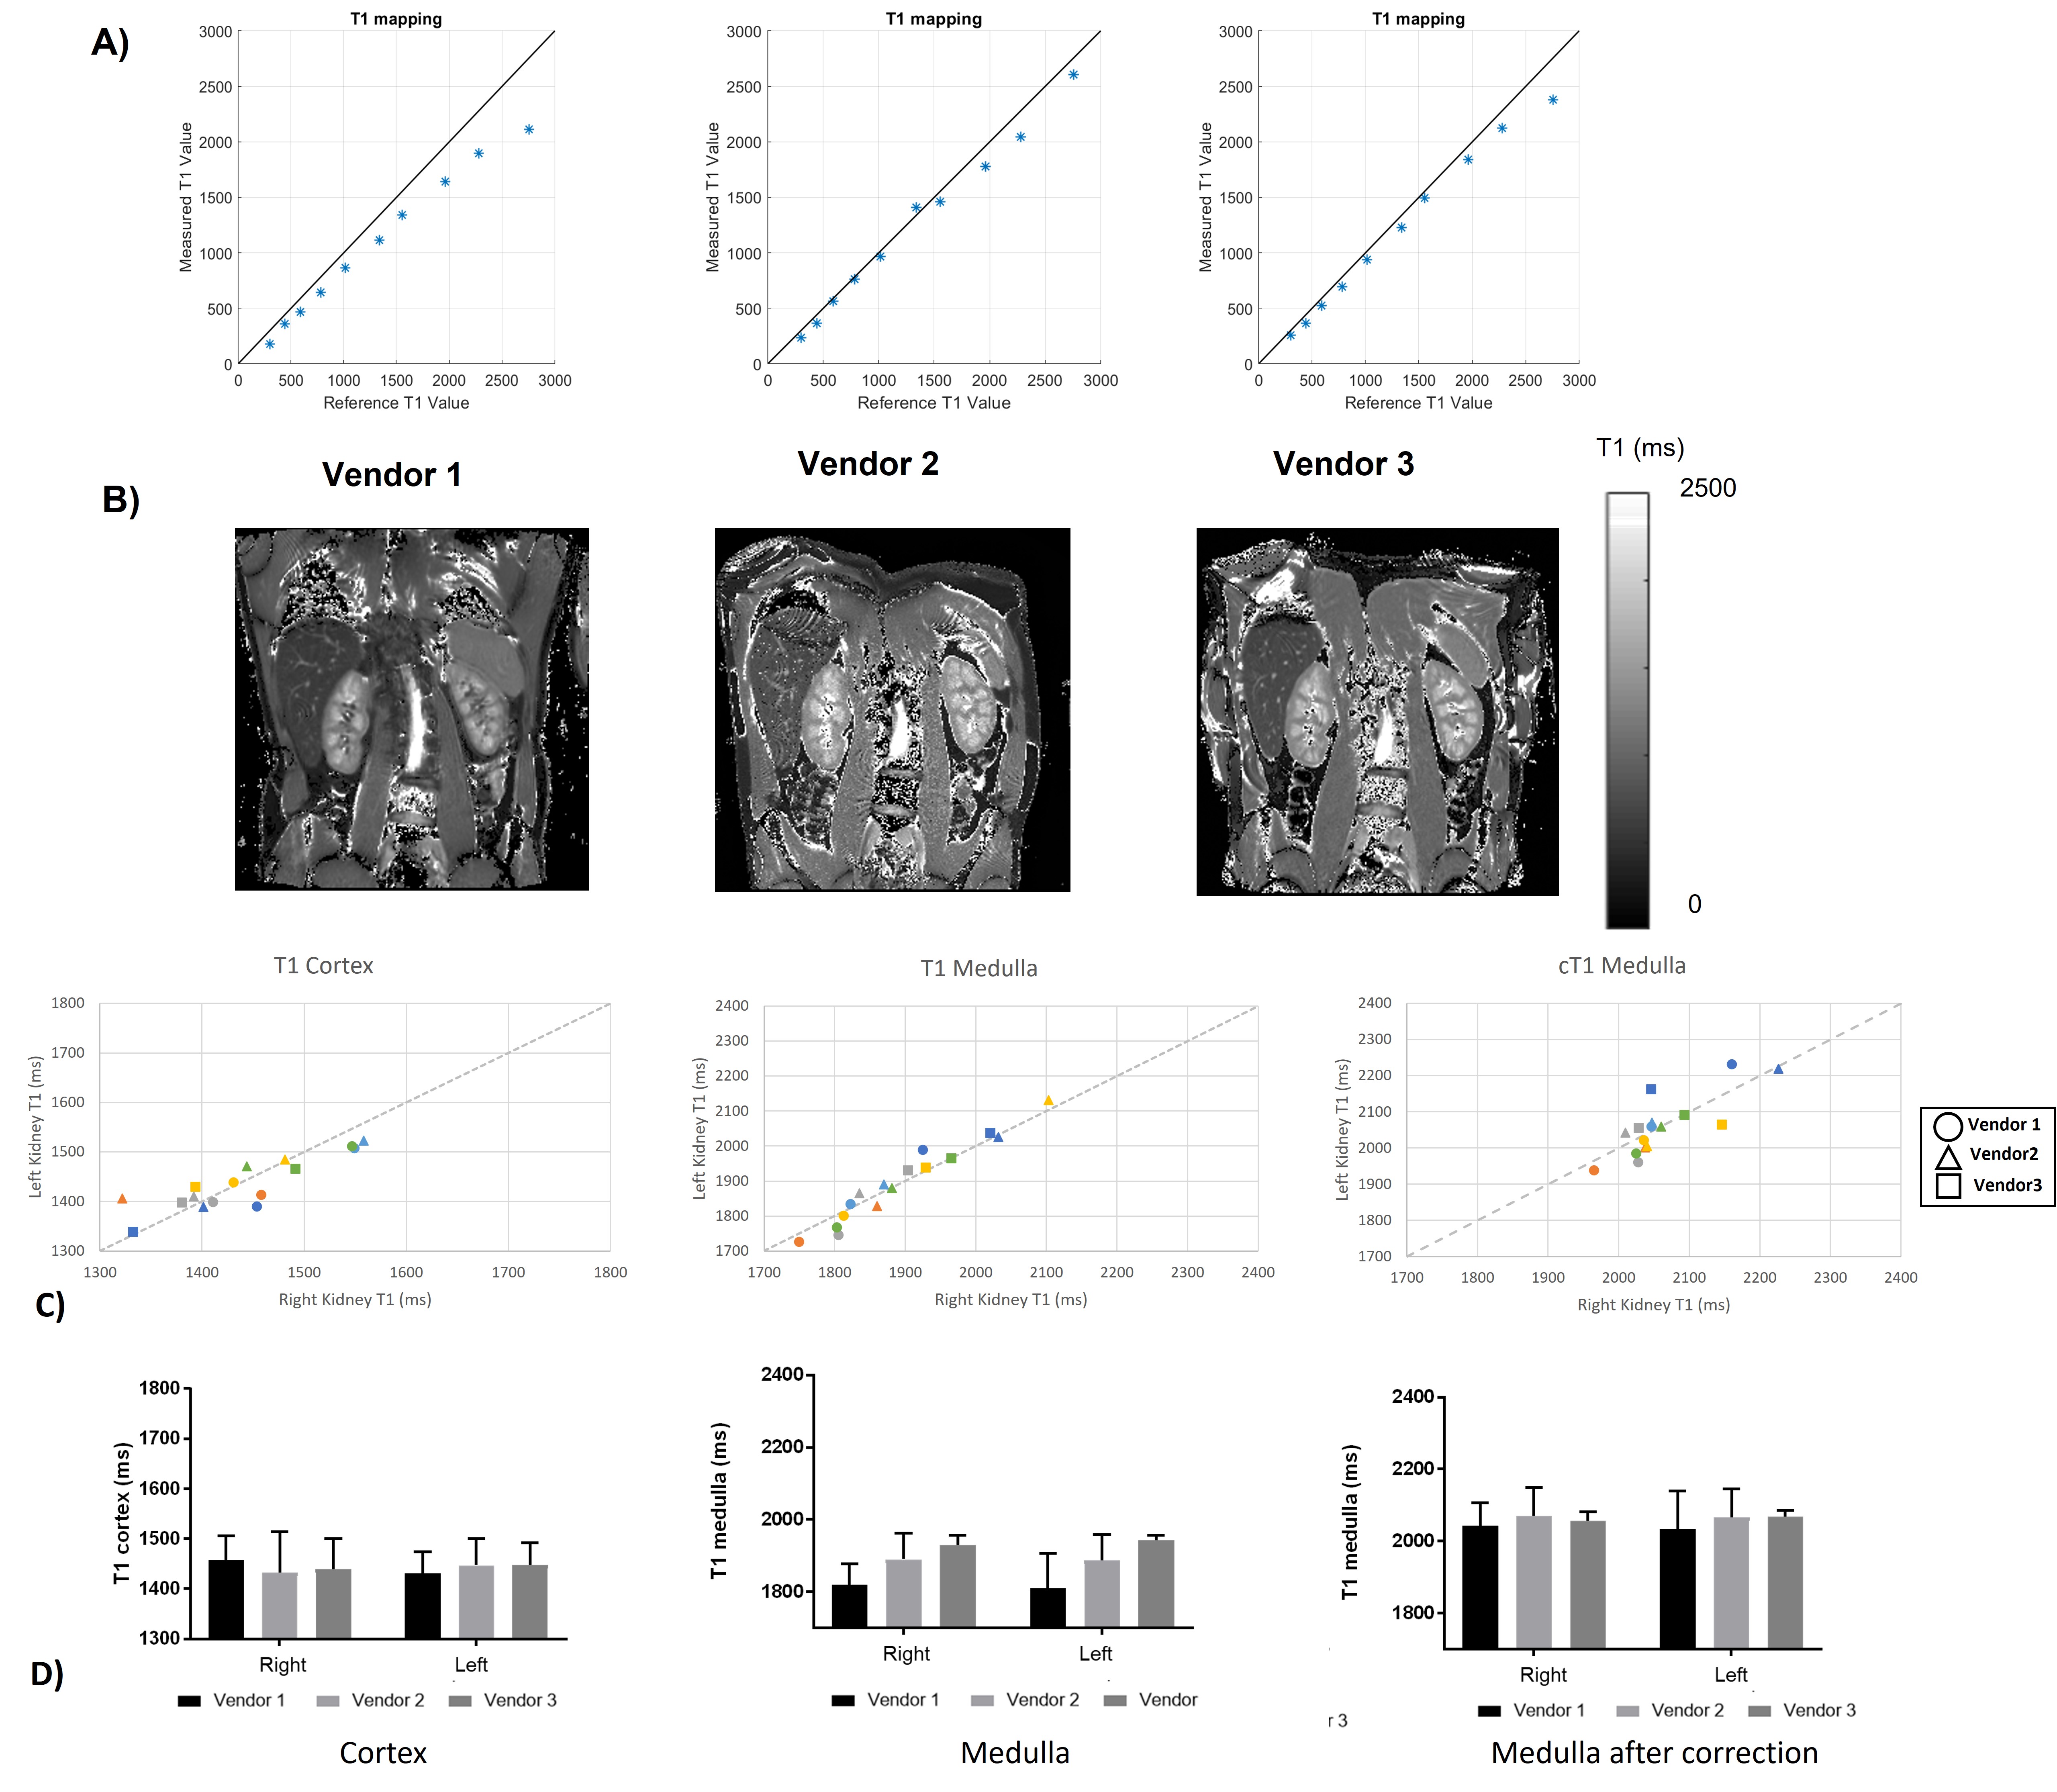
Phantom results for the MOLLI T1 mapping on the NIST phantom are shown in Figure 3a for each of the spheres plot against their reference values, the error at high T1 spheres in the range of the medulla is apparent, particularly for Vendor 1. In-vivo data is shown in Fig 3b, along with plots of the cortex and the medulla which is shown with and without correction. An intra-subject CoV of 1.6±0.8% was found for the cortex, and 3.2±1.0% for the medulla, which reduced to 1.2±1.0% after correction. Prior to correction, a difference was seen in the medulla T1 between Vendors 1 and 3 (p=0.002). After correction, no significant differences were measured in T1 values across vendors.
Figure 4 shows the results of the T2*mapping. T2* values had a larger CoV at 10.4±6.5% and 12.2±6.3% for the cortex and medulla.
DISCUSSION AND CONCLUSION
Here we characterise the B0 and B1 fields and assess renal MOLLI T1 and T2* in a Travelling Kidney study across the three main vendors. B1 maps are shown to vary across vendors/hardware with Vendor 1 having a significantly higher B1. The mode B0 value within the kidneys did not vary across vendors, however the FWHM was shown to be narrower for Vendor 1. The effects seen here in B0 and B1 are likely due to the system used for Vendor 1 being a narrow (60cm) bore system.No significant differences were seen in MOLLI T1 values of the renal cortex and medulla after this data was corrected for the offset in T1 seen in the NIST phantom. In future, simulations will be performed of the MOLLI RF and gradient waveforms used on each of the vendors. T2* data showed a higher CoV than T1 measures, this could be due to the quality of the breath hold acquisition for these measures and in future multiple repeats of these measures will be performed. There was a significant difference in T2* of the medulla between Vendors 1 and 2 (p=0.02).
Acknowledgements
This work is funded by MRC Partnership grant MR/R02264X/1.References
1. Mendichovszky I, Pullens P, Dekkers I et al. Technical recommendations for clinical translation of renal MRI: a consensus project of the Cooperation in Science and Technology Action PARENCHIMA. Magn. Reson. Mater. Physics, Biol. Med. 2019.
2. Nehrke K, Börnert P. DREAM-a novel approach for robust, ultrafast, multislice B1 mapping. Magn. Reson. Med. 2012;68:1517–1526.
3. Klose U. Mapping of the Radio Frequency Magnetic Field With A Mr Snapshot Flash Technique. Med. Phys. 1992.
4. Sacolick LI, Wiesinger F, Hancu I, Vogel MW. B1 mapping by Bloch-Siegert shift. Magn. Reson. Med. 2010;63:1315–1322. 4. Russek SE, Boss M, Jackson EF, et al. Characterization of NIST/ISMRM MRI system phantom. In: Proc. Intl. Soc. Mag. Reson. Med. 20. Online; 2012 (p. 2456).
5. Messroghli DR, Radjenovic A, Kozerke S, et al. Modified Look-Locker inversion recovery (MOLLI) for high-resolution T1 mapping of the heart. Magn. Reson. Med. 2004;52:141–6.
6. Daniel AJ, Nery F, et al. UKRIN Kidney Analysis Toolbox (UKAT): A Framework for Harmonized Quantitative Renal MRI Analysis in Proc. Intl. Soc. Mag. Reson. Med. 29 proc 3765
7. Cox EF, Buchanan CE, Bradley CR, et al. Multiparametric renal magnetic resonance imaging: Validation, interventions, and alterations in chronic kidney disease. Front. Physiol. 2017;8:1–15.
Figures