0481
Validation of automatically measured ΔT1 values correlated with eGFR and fibrosis assessment of allograft kidneys
Ibtisam Aslam1,2, Fariha Aamir3, Miklos KASSAI1, Lindsey A CROWE1, Sophie de Seigneux4, Solange Moll5, Lena BERCHTOLD4, and Jean-Paul VALLEE1
1Service of Radiology, Geneva University Hospitals and Faculty of Medicine, University Hospital and University of Geneva, Geneva, Switzerland, 2Medical Image Processing Research Group (MIPRG), Deptt. of Electrical & Computer Engineering, COMSATS University Islamabad, ISLAMABAD, Pakistan, 3Medical Image Processing Research Group (MIPRG), Deptt. of Electrical & Computer Engineering, COMSATS University Islamabad (CUI), Pakistan, ISLAMABAD, Pakistan, 4Service and Laboratory of Nephrology, Department for Statistics, Department of Internal Medicine Specialties and of Physiology and Metabolism, University Hospital and University of Geneva, Geneva, Switzerland, 5Department of Clinical Pathology, Institute of Clinical Pathology, University Hospital and University of Geneva, Geneva, Switzerland
1Service of Radiology, Geneva University Hospitals and Faculty of Medicine, University Hospital and University of Geneva, Geneva, Switzerland, 2Medical Image Processing Research Group (MIPRG), Deptt. of Electrical & Computer Engineering, COMSATS University Islamabad, ISLAMABAD, Pakistan, 3Medical Image Processing Research Group (MIPRG), Deptt. of Electrical & Computer Engineering, COMSATS University Islamabad (CUI), Pakistan, ISLAMABAD, Pakistan, 4Service and Laboratory of Nephrology, Department for Statistics, Department of Internal Medicine Specialties and of Physiology and Metabolism, University Hospital and University of Geneva, Geneva, Switzerland, 5Department of Clinical Pathology, Institute of Clinical Pathology, University Hospital and University of Geneva, Geneva, Switzerland
Synopsis
Chronic kidney disease (CKD) affects 11% of the population in Switzerland & US per year and is a major public health issue. Also, the CKD is 16th most prominent reason of life lost worldwide. MRI T1-mapping is a non-invasive way to monitor the renal prognosis. Recent studies show that the ∆T1 (cortex-medullary difference) has a strong positive correlation with fibrosis in CKD patients and is an important biomarker for CKD. This work proposes a validation of the T1-map cortico-medullary difference (ΔT1) values measured from automatically segmented cortex and medulla for eGFR and fibrosis assessment of allograft kidneys.
Introduction
Assessment of renal microstructure is an important step for diagnosis and monitoring of renal diseases. Magnetic Resonance Imaging (MRI) T1 mapping1 is a non-invasive way to monitor the renal prognosis2. In addition, T1 map is sensitive to pathological changes occurring in the tissues and can differentiate cortex and medulla. Recent studies show that the ∆T1 (cortex-medullary difference) has a strong positive correlation with fibrosis in chronic kidney disease (CKD) patients and is an important biomarker for CKD2. However, measuring the cortico-medullary values by manually drawing ROIs on cortex and medulla (a gold standard way to measure the cortex and medulla values) is challenging, time-consuming and required training. Moreover, human error may also affect the reproducibility of the work.This work proposes a validation of the T1 map cortico-medullary difference (ΔT1) values measured from automatically segmented cortex and medulla for eGFR and fibrosis assessment of allograft kidneys that helps to reduce the computation burden in terms of time to measure ROIs values for cortex and medulla and also will help to improve the work reproducibility
Method
In this study, 114 allograft kidney patient’s data2 were used for measuring the correlation between eGFR and fibrosis. The eGFR was calculated using the Chronic Kidney Disease Epidemiology Collaboration equation (CKD-EPI). Also, the renal fibrosis was assessed quantitatively on the kidney biopsy specimen using Masson’s trichrome-stained kidney sections. The expert pathologist was blinded to the other results, including eGFR and MRI.The MRI data was acquired on a Prisma 3T MR scanner (Siemens AG, Erlangen, Germany) with the standard 32-element spine coil and the 18-element phased-array abdominal coil with the MOLLI T1-mapping sequence. Parameters were: Resolution: 2×2×5mm; TE/TR=1.2/1500ms; iPAT=2 (GRAPPA reconstruction); flip angle:35º.Figure-1 shows the block diagram of the proposed modified U-Net architecture for cortex and medulla segmentation. The U-Net is trained on a set of 40 transplanted T1-maps that was augmented to produce 2400 training images and tested on 114 T1-map images. For training, convolutional layers weights are initialized with a zero centric normal distribution with a standard deviation of 0.05. The loss function is minimized via an RMSProp optimizer with a learning rate of 1×10⁻⁴. The training was implemented on Python 3.8 by Keras using TensorFlow as backend3 on Intel(R) Xeon(R) CPU, 128 GB RAM, and GPU NVIDIA GeForce GTX 1080Ti, with a batch size of 5 for 100 epochs using early stopping criteria. The network required approximately 1.5 hours for training. The quality of the proposed modified U-Net segmentation was compared with standard VGG16, RESNET34 and RESNET50 with U-Net as backbone. The reference gold standard mask was obtained by manual segmentation using 3D slicer by a radiologist with 2 years of training in renal MRI research.
The Dice Coefficient (DC), Accuracy (ACC), specificity (SP) and sensitivity (SE) of all the AI-based segmentation methods were measured using Keras built-in libraries3. The CNNs-measured ΔT1 is correlated with renal fibrosis and eGFR, and the results are compared with Gold standard2 (manually drawn ROIs) correlation analysis. For the Gold standard values, ROIs were manually drawn using Horos (https://horosproject.org/) to measure the mean cortex and medulla values on T1 maps2.
Results and Discussion
Figure-2 presents the Reference T1-map, gold standard manually drawn ROIs over cortex & medulla and the deep-learning predicted cortex (yellow) & medulla (red) masks registered on T1-map. The registered masks show that the proposed modified U-Net provides more robust predicted mask of cortex and medulla than other CNNs.Figure-3 shows the bar graph comparison in terms of DC, ACC, SP and SE evaluation for the proposed method, VGG16, RESNET34 and RESNET50 for cortex and medulla, respectively. The quantitative results show that the proposed modified U-Net have better DC, ACC, SP and SE scores as compared to the other CNN architectures for both cortex and medulla.
From the deep learning-based methods, Modified U-Net (Proposed method) and VGG16 segmentations results were chosen (on the basis of segmentation quantifying parameters i.e. DC, ACC, SP and SE) to automatically measure the ΔT1 values. Additionally, we also performed ROIs erosion for the deep learning-based cortex and medulla ROIs to strongly match the hand-drawn ROIs2.
Figure-4 shows correlations analysis of ΔT1 vs eGFR and percentage fibrosis for allograft kidneys. The manual ROI data correlation results2 are reproduced and considered as reference for automatically measured ΔT1 correlation results. The results show that the modified U-Net has better correlation (r= -0.2, p=0.039) as compared to VGG16 (r= -0.23, p=0.019) in reference to the standard Manual ROIs correlation2 (r= -0.19, p=0.0508) for eGFR. Similarly, the modified U-Net has superior correlation values (r= 0.25, p=0.007) as compared to VGG16 correlation (r= 0.18, p=0.062) in reference to the standard Manual ROIs2 (r = 0.3, p=0.0013) with percentage fibrosis.
Conclusion
This work validates the automatically measured ΔT1 values of allograft kidneys from deep learning-based segmented cortex and medulla for eGFR and fibrosis assessment. Our U-net-based approach provides a negative correlation with eGFR while a positive correlation with fibrosis as reported in literature2. It will help to reduce the computation burden to measure the ROIs values for cortex and medulla to measure the ΔT1 values.Acknowledgements
This work is partially supported by the Swiss National Science Foundation (grant IZCOZO_177140/1)References
- D. R. Messroghli, A. Radjenovic, S. Kozerke, D. M. Higgins, M. U. Sivananthan, and J. P. Ridgway, “Modified Look-Locker inversion recovery (MOLLI) for high-resolution T1 mapping of the heart,” Magn. Reson. Med., vol. 52, no. 1, pp. 141–146, Jul. 2004
- L. Berchtold et al., “Validation of the corticomedullary difference in magnetic resonance imaging-derived apparent diffusion coefficient for kidney fibrosis detection: A cross-sectional study,” Nephrol. Dial. Transplant., vol. 35, no. 6, pp. 937–945, Jun. 2020.
- “Metrics.” [Online]. Available: https://keras.io/api/metrics/. [Accessed: 26-Jul-2021].
Figures
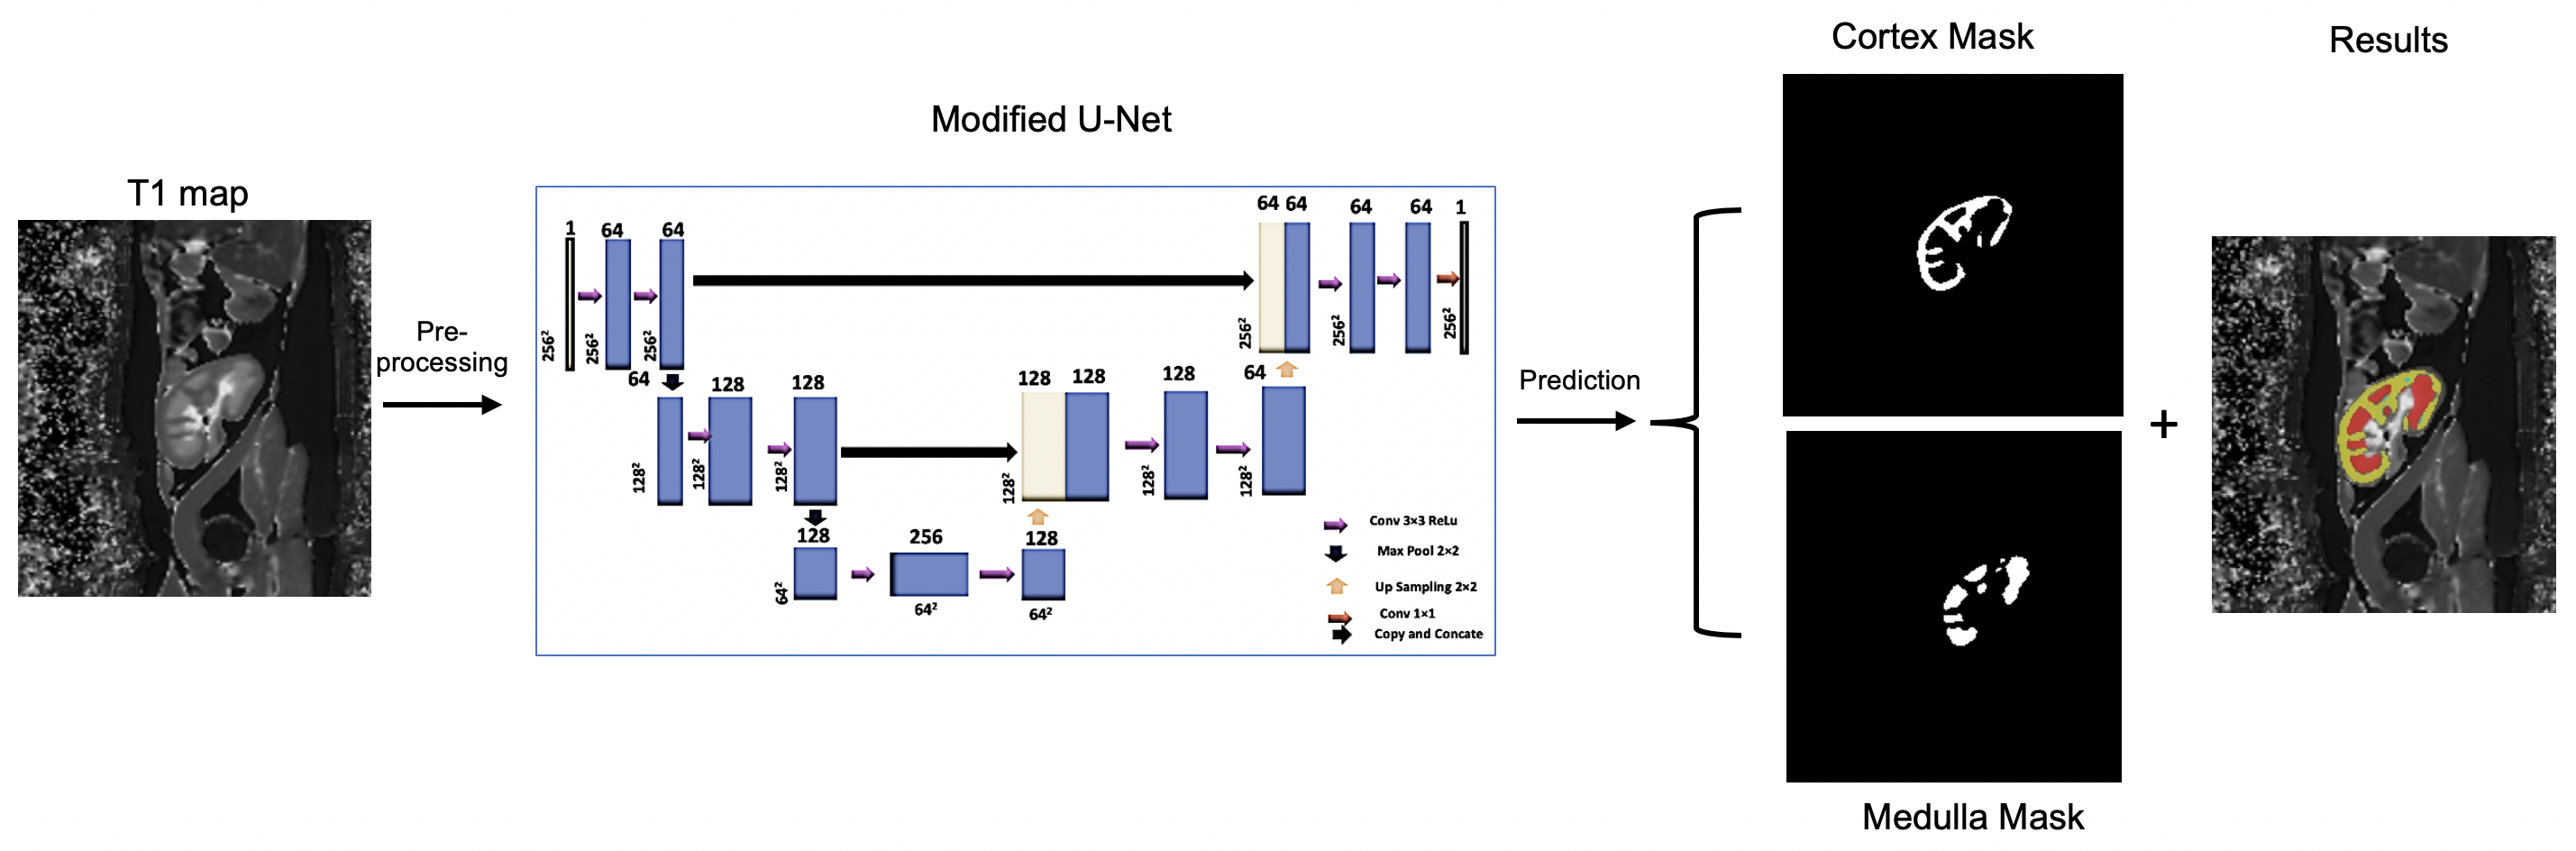
Figure 1: Schematic presentation of proposed modified U-Net to segment the cortex and medulla of allograft kidneys
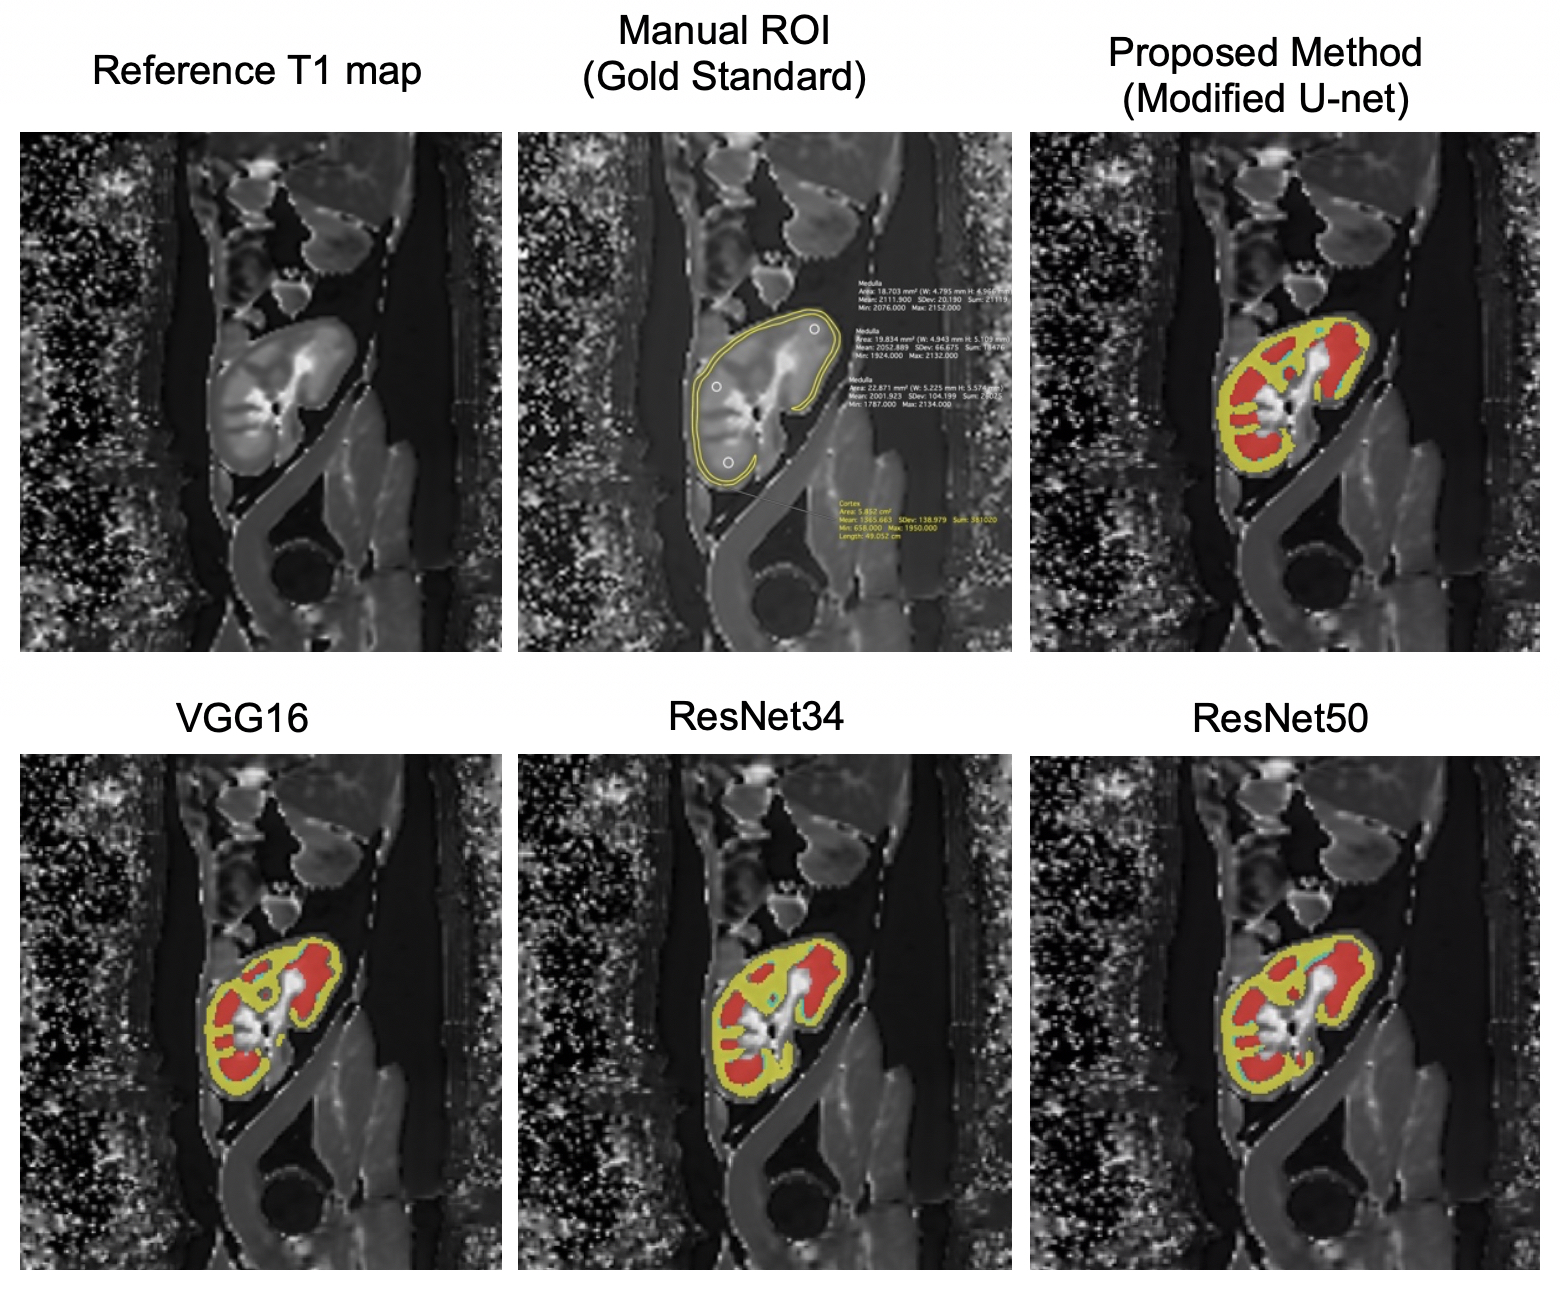
Figure 2: Predicted mask registered with Cortex and Medulla on allograft kidney T1 map. Manual ROI: Gold standard method to compute the cortico-medullary values. Deep Learning-based Segmentation: Cortex (Yellow), Medulla (Red)
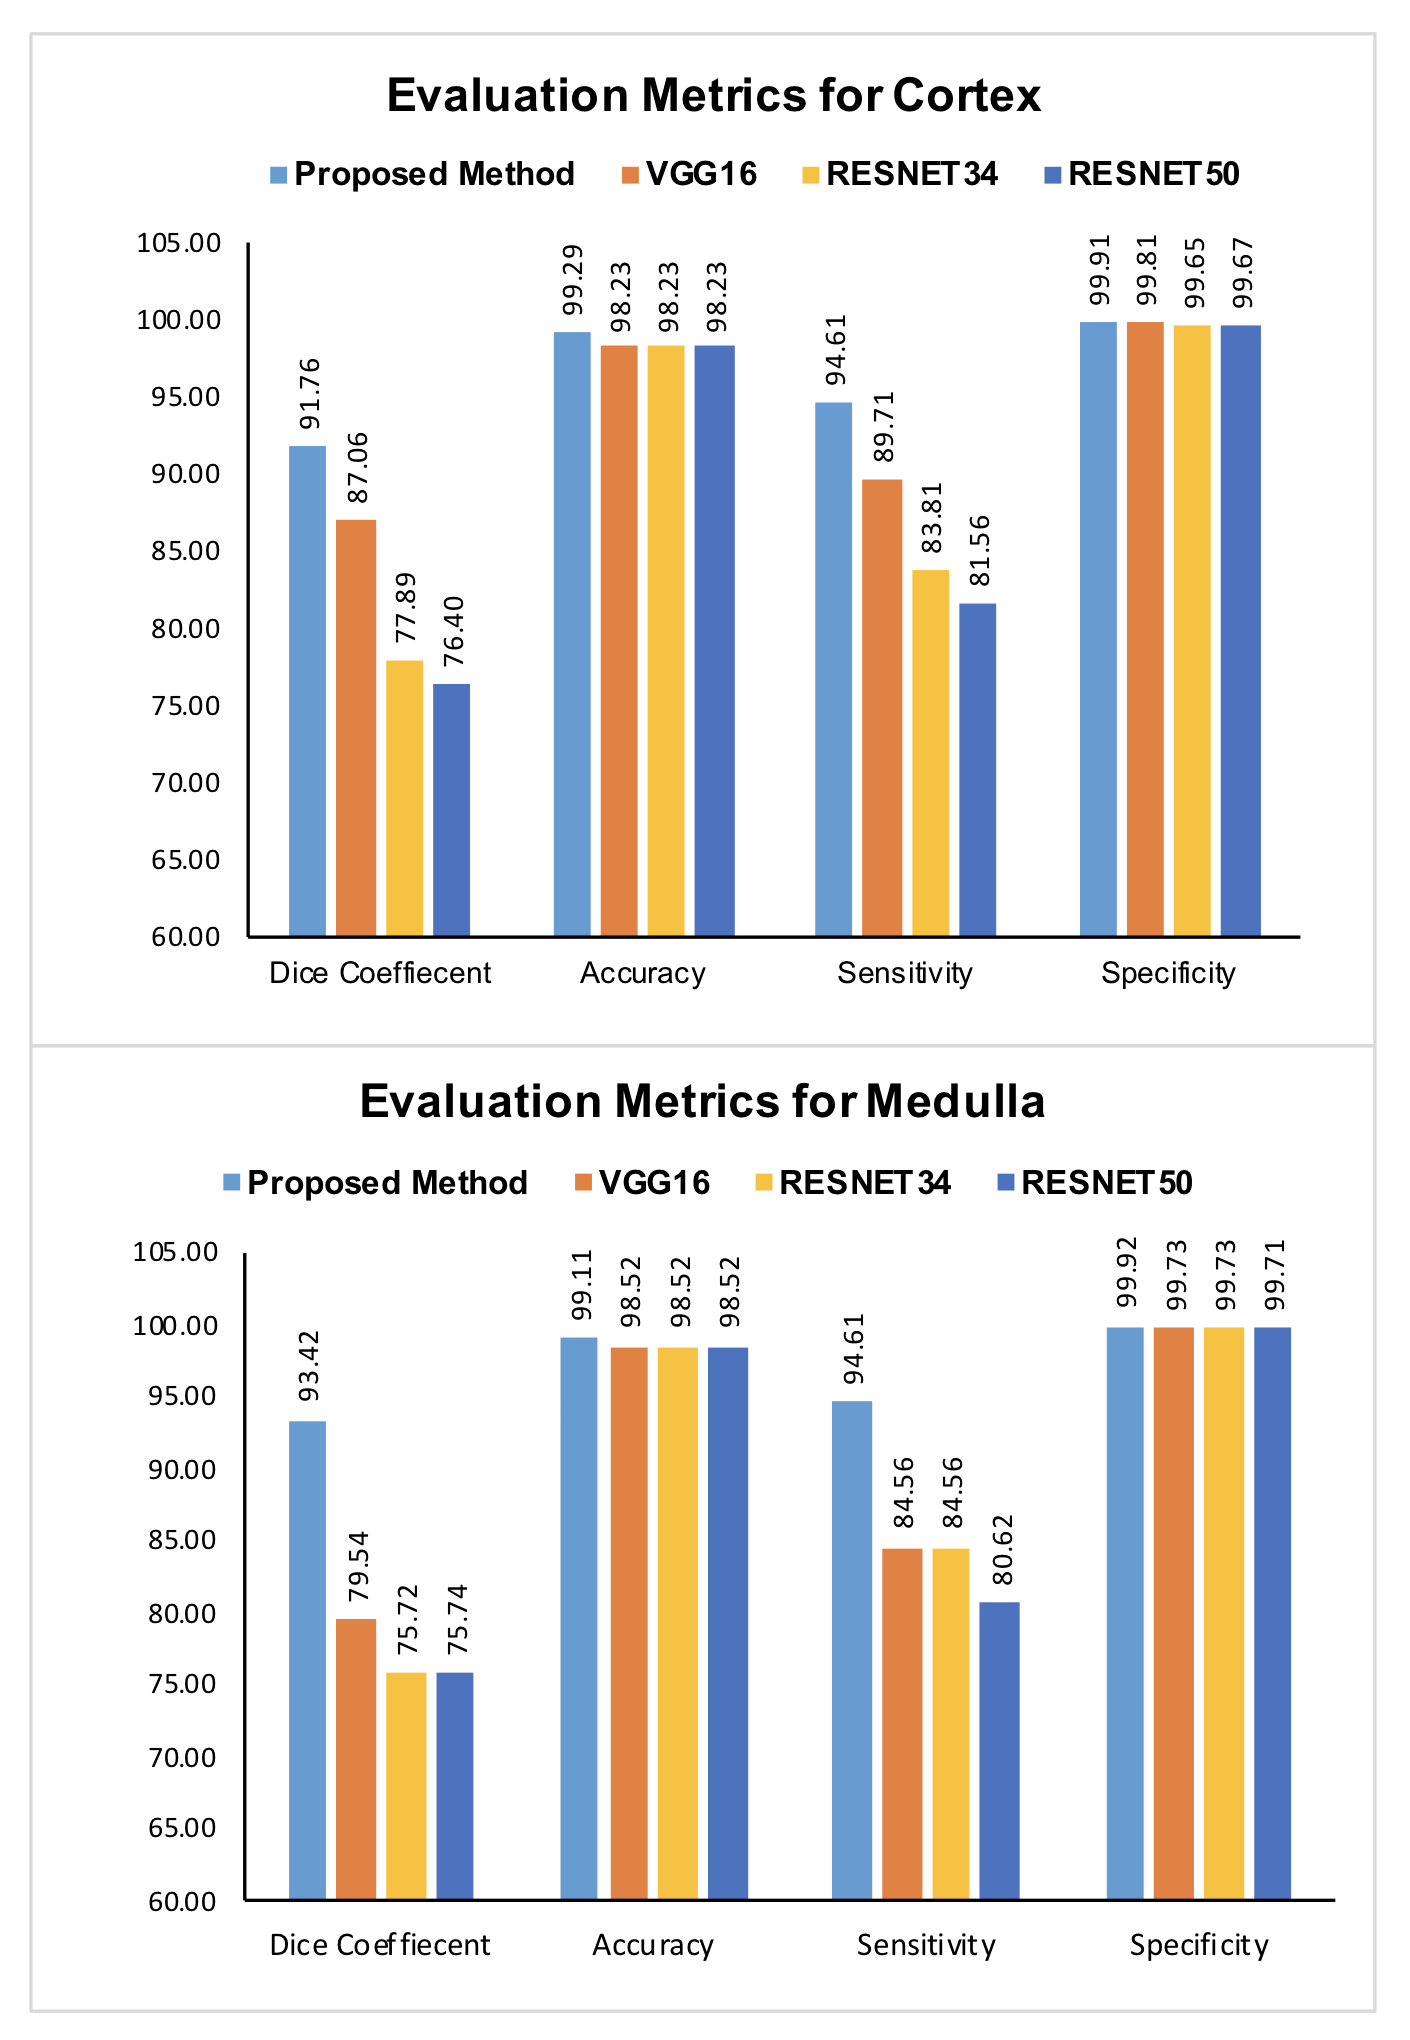
Figure 3: CNN architectures predications evaluated via Dice Coefficient (DC), Accuracy (ACC), Specificity (SP) and Sensitivity (SE) for both cortex and medulla segmentation.
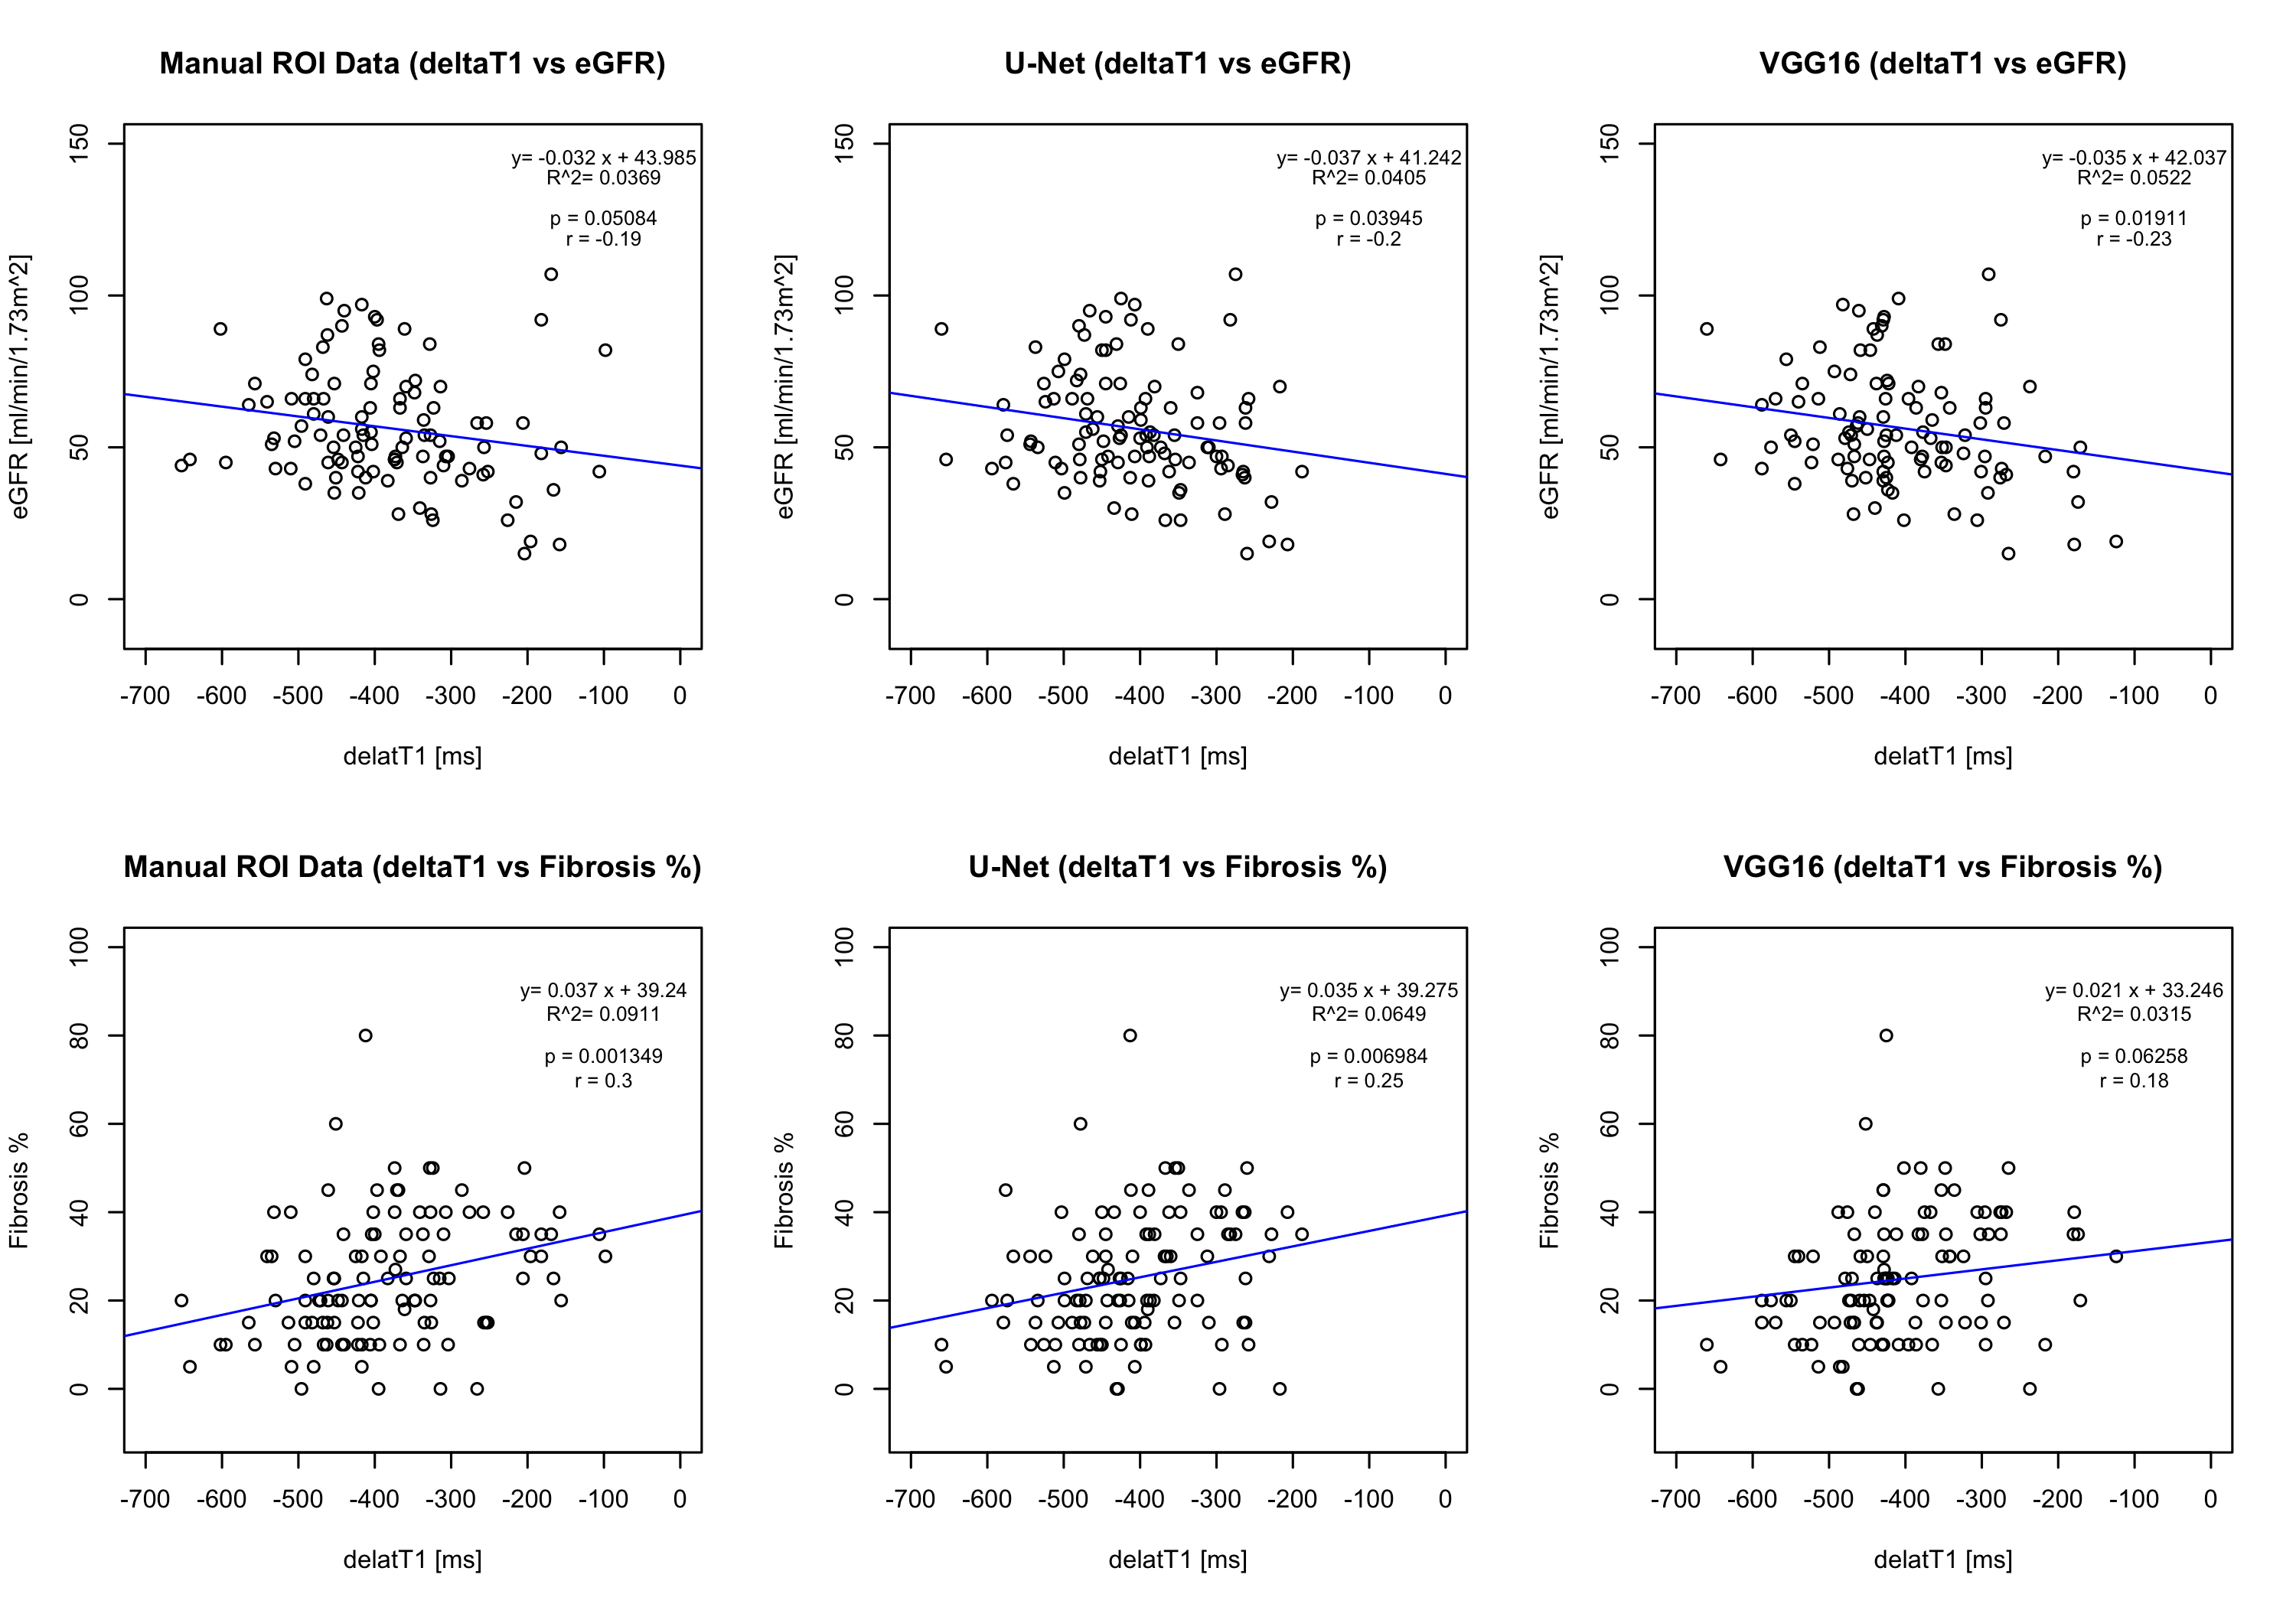
Figure 4: Correlations between MRI T1 map cortico-medullary difference (ΔT1) values with eGFR and percentage fibrosis. Each circle represents one patient and the continuous line indicates least-square linear regression.
DOI: https://doi.org/10.58530/2022/0481