0479
Prognostic potential of multiparametric MRI in the assessment of renal allografts early after transplantation
Rebeca Echeverria-Chasco1,2, Paloma L. Martin Moreno3, Nuria Garcia-Fernandez2,3, Marta Vidorreta4, Anne Oyarzun5, Arantxa Villanueva Larre2,5,6, Gorka Bastarrika1,2, and Maria A. Fernandez-Seara1,2
1Radiology, Clinica Universidad de Navarra, Pamplona, Spain, 2IdiSNA, Instituto de Investigación Sanitaria de Navarra, Pamplona, Spain, 3Nephrology, Clinica Universidad de Navarra, Pamplona, Spain, 4Siemens Healthcare, Madrid, Spain, 5Electrical Electronics and Communications Engineering, Public University of Navarre, Pamplona, Spain, 6ISC, Institute of Smart Cities, Pamplona, Spain
1Radiology, Clinica Universidad de Navarra, Pamplona, Spain, 2IdiSNA, Instituto de Investigación Sanitaria de Navarra, Pamplona, Spain, 3Nephrology, Clinica Universidad de Navarra, Pamplona, Spain, 4Siemens Healthcare, Madrid, Spain, 5Electrical Electronics and Communications Engineering, Public University of Navarre, Pamplona, Spain, 6ISC, Institute of Smart Cities, Pamplona, Spain
Synopsis
Purpose: to evaluate the prognostic potential of a multiparametric renal MRI protocol (perfusion, diffusion and T1) for the assessment of the allograft in the very early stages after transplantation.
Methods: 18 transplanted patients were imaged 6 days after the transplantation with ASL, IVIM and T1 mapping sequences. 2 groups were made depending on the allograft evolution (group A: no adverse events and group B: any adverse event).
Results: eGFR, album-creatinine ratio and cortical and medullary RBF were significantly higher in allografts of group A than in group B. Significant correlations between eGFR and RBF were found.
INTRODUCTION
The treatment of choice for patients at end stage of chronic kidney disease is kidney transplantation. Monitoring renal function after transplantation is essential to allow early detection of allograft impairment and thus, to evaluate therapeutic strategies before an irreversible damage occurs.In the clinical routine, evaluation of the allograft is based on serum creatinine measurements, doppler ultrasonography and in some cases renal biopsy. However, these methods have different limitations1,2. MRI has appeared as a promising noninvasive technique for the assessment of functional and structural parameters of the allograft. Arterial spin labeling (ASL)3 allows the quantification of renal perfusion without contrast agents. Intravoxel Incoherent Motion (IVIM)4 provides information on microvascular perfusion and diffusion in the tissue. Longitudinal relaxation times (T1 values) can be indicative of alterations in tissue composition5.
Thus, the main goal of this work was to evaluate the prognostic potential of a multiparametric renal MRI protocol (including perfusion, diffusion and T1 measurements) for the assessment of the allograft in the very early stages after transplantation.
METHODS
SUBJECTS:This study was approved by the local Ethics Committee. Written informed consent was obtained from all subjects.
18 transplanted patients (mean age ± standard deviation (SD) = 56±13 years, 6 female) were included . The interval between the renal surgery and the MR scan was 6±3 days.
Blood and urine samples were obtained from all patients the day of the MR scan. Estimated glomerular filtration rate (eGFR) was calculated according to Chronic Kidney Disease Epidemiology Collaboration (CKD-EPI) equations based on creatinine6. None of the patients had any complication during the surgery. All patients were followed for 3 months, monitoring any adverse events (severe or moderate acute rejection, delayed graft function, inflammation or infection).
According to the allograft evolution after transplantation, subjects were divided into 2 groups: group A, recipients with no adverse events (n=13) and group B, recipients that experienced any adverse event (n=5).
MRI PROTOCOL:
Scans were performed on a 3T Skyra (Siemens, Erlangen, Germany) using an 18-channel body-array coil, without specific preparations, such as fasting or fluid intake restrictions.
ASL: Pseudo-continuous ASL (PCASL) was implemented as previously optimized7 with a SE-EPI readout, with background suppression. PCASL was unbalanced with average gradient=0.5mT/m and ratio=6. RF pulses were Hann-shaped (duration=500μs, period=1ms, B1=1.6µT). Labeling duration was 1.6s and PLD was 1.2s. Sequence parameters are described in Table 1.
IVIM: Data was obtained for 13 b-values: 0,10, 20, 30, 40, 50, 70, 100, 200, 300, 400, 500, 800 s/mm2, acquiring 3 signal averages with monopolar gradients in 3 orthogonal directions. Single-shot EPI readout parameters are described in Table 1.
T1 mapping: An Inversion Recovery sequence with a SE-EPI readout and 14 TIs was employed. Readout parameters were identical to PCASL sequence (Table 1).
IMAGE PROCESSING:
Motion was corrected for each sequence and slice using a PCA-groupwise registration method8 implemented in Elastix9. RBF maps in ml/min/100g were computed using the single compartment model (Table 1). IVIM data was analyzed using a biexponential decay model (Table 1), in which the second term describes pure water diffusion, coefficient D (10-3mm2/s) and the first term represents the fast molecule movement associated with microperfusion, coefficient D∗ (10-3mm2/s) and Fp (perfusion fraction) (%). T1 maps were calculated by fitting the signal to the inversion-recovery equation (Table 1).
For each parameter map, tissue means were calculated in manually defined masks in the cortex and medulla, drawn in the M0 or b=0 images.
STATISTICAL ANALYSIS:
Differences between the groups were evaluated using a Wilcoxon-Mann-Whitney test. Correlations between eGFR and imaging parameters were assessed using Spearman correlation. P values<0.05 were considered statistically significant.
RESULTS
Figure 1 shows perfusion and diffusion parameter maps for one subject in each group. In Figure 2 the parameter boxplots are illustrated for the 2 groups in the renal cortex and medulla.Table 2 shows cortical and medullary parameters averaged for each group. eGFR, album-creatinine ratio and cortical and medullary RBF were significantly higher in allografts of group A than in group B.
Significant correlations between eGFR and RBF were found in the cortex: r=0.68 (p<0.001) (Figure 3). However, eGFR did not correlate significantly with the other imaging parameters.
DISCUSSION AND CONCLUSSION
The results of this study suggest that perfusion measured in the early post-operative period (one week after surgery) could be predictor of allograft dysfunction during the initial months after transplantation.RBF showed a good correlation with eGFR, demonstrating its potential as a marker of renal function. In addition, a significant reduction in renal perfusion was found in patients that presented adverse events in the following months after the transplantation. RBF was low before these episodes occur, being therefore a promising parameter with a predictive potential of allograft dysfunction. Diffusion coefficients did not show statistically significant differences between groups suggesting that the microstructure of the kidney tissue was not altered in the early post-operative period.
Future work will include follow-up of these groups of patients within a year after the transplantation.
In conclusion, RBF correlated significantly with allograft function. Lower perfusion was found in patients that suffered an adverse event in the following weeks after the transplantation, revealing its promising clinical prognostic value.
Acknowledgements
This project was supported by Government of Navarra, under the frame of ERA PerMed (ERAPERMED2020-326 - RESPECT) and under the Grant: PC181-182 RM-RENAL. Rebeca Echeverria-Chasco received Ph.D. grant support from Siemens Healthcare SpainReferences
- Parrish AE: Complications of percutaneous renal biopsy: a review of 37 years’ experience. Clin Nephrol 1992; 38:135–141.
- Wu O et al.: Acute rejection and chronic nephropathy: a systematic review of the literature. Transplantation 2009; 87:1330–1339.
- Nery F et al.: Consensus-based technical recommendations for clinical translation of renal ASL MRI. Magn Reson Mater Physics, Biol Med 2020; 33:141–161.
- Ljimani A et al.: Consensus-based technical recommendations for clinical translation of renal diffusion-weighted MRI. Magn Reson Mater Physics, Biol Med 2020; 33:177–195.
- Dekkers IA, et al.: Consensus-based technical recommendations for clinical translation of renal T1 and T2 mapping MRI. Magn Reson Mater Physics, Biol Med 2020; 33:163–176.
- Levey AS et al.: A new equation to estimate glomerular filtration rate. Ann Intern Med 2009; 150:604–612.
- Echeverria-Chasco R et al.: Optimization of pseudo-continuous arterial spin labeling for renal perfusion imaging. 2020(September):1–15.
- Huizinga W et al.: PCA-based groupwise image registration for quantitative MRI. Med Image Anal 2016; 29:65–78.
- Klein S et al.: elastix: A Toolbox for Intensity-Based Medical Image Registration. IEEE Trans Med Imaging 2010; 29:196–205.
Figures
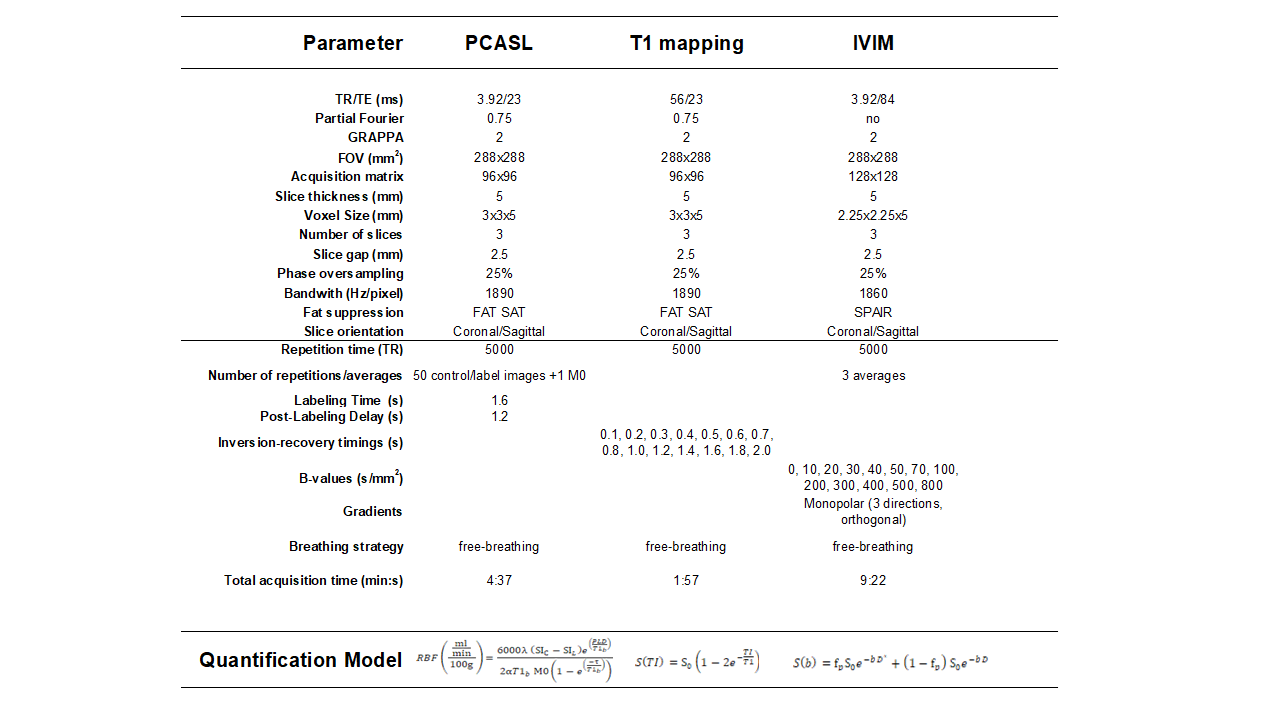
Table 1:
Description of sequence parameters employed in the MRI
protocol, and equations used in the quantitative analysis
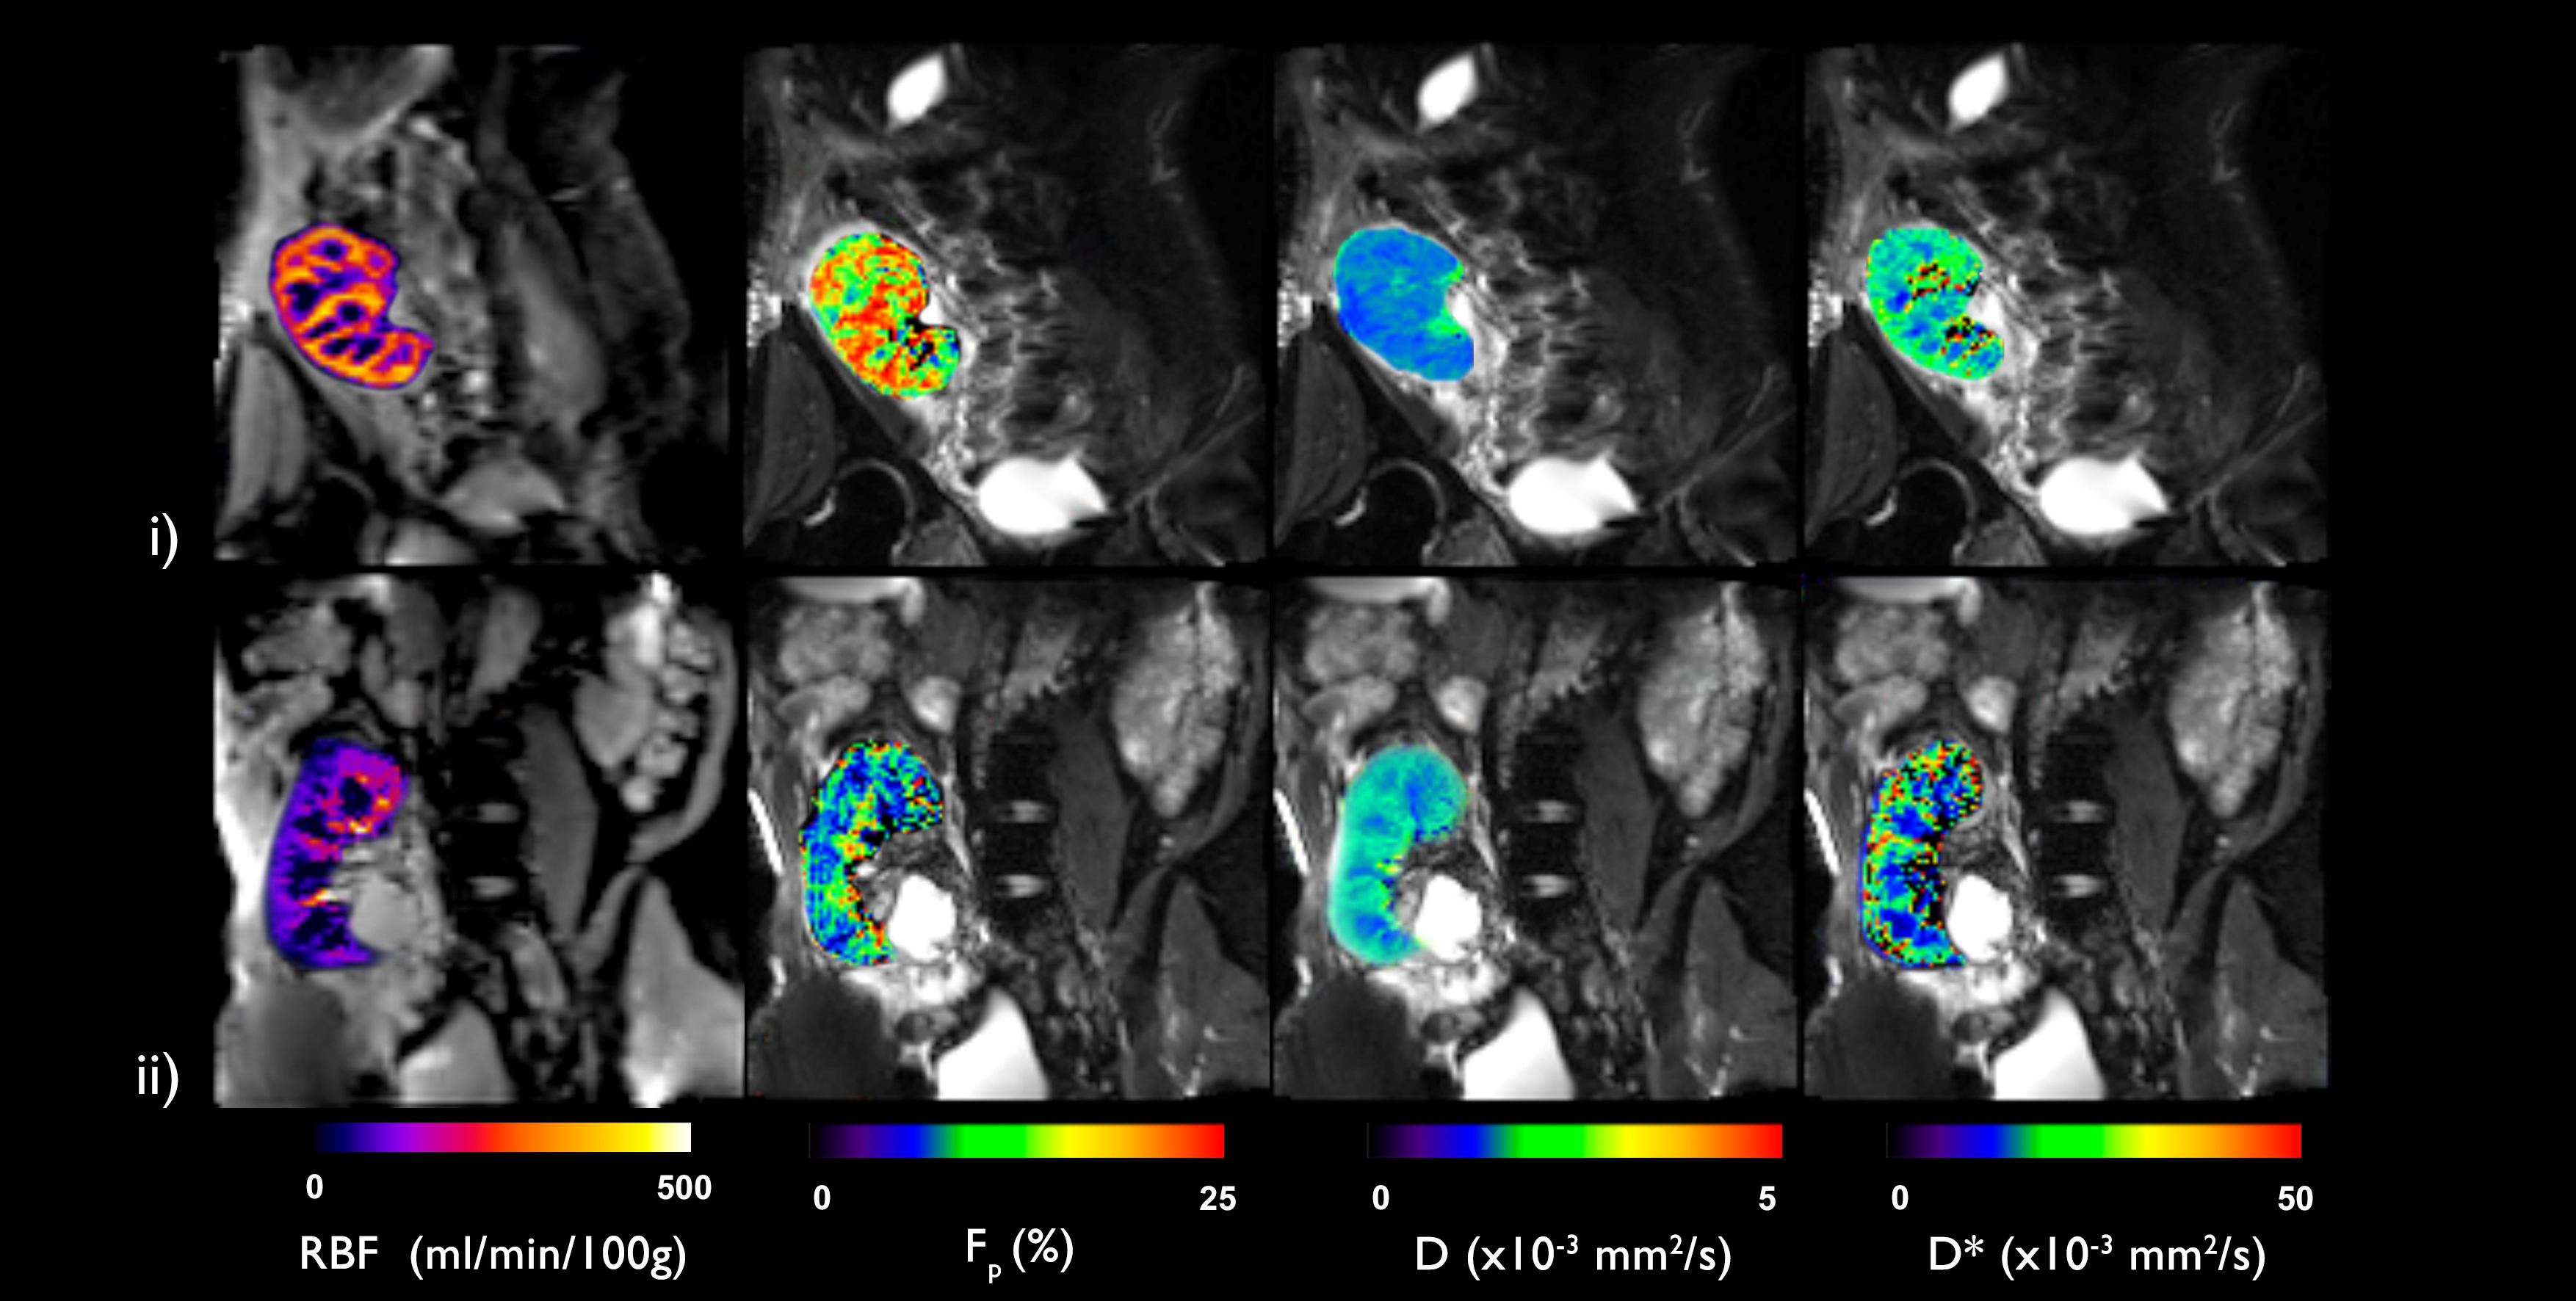
Figure 1:
Perfusion and diffusion parameter maps (RBF, Fp,
D and D*) from representative subjects in each group: i) subject with good post
operative progression from group A and ii) subject with delayed graft function
after transplantation from group B
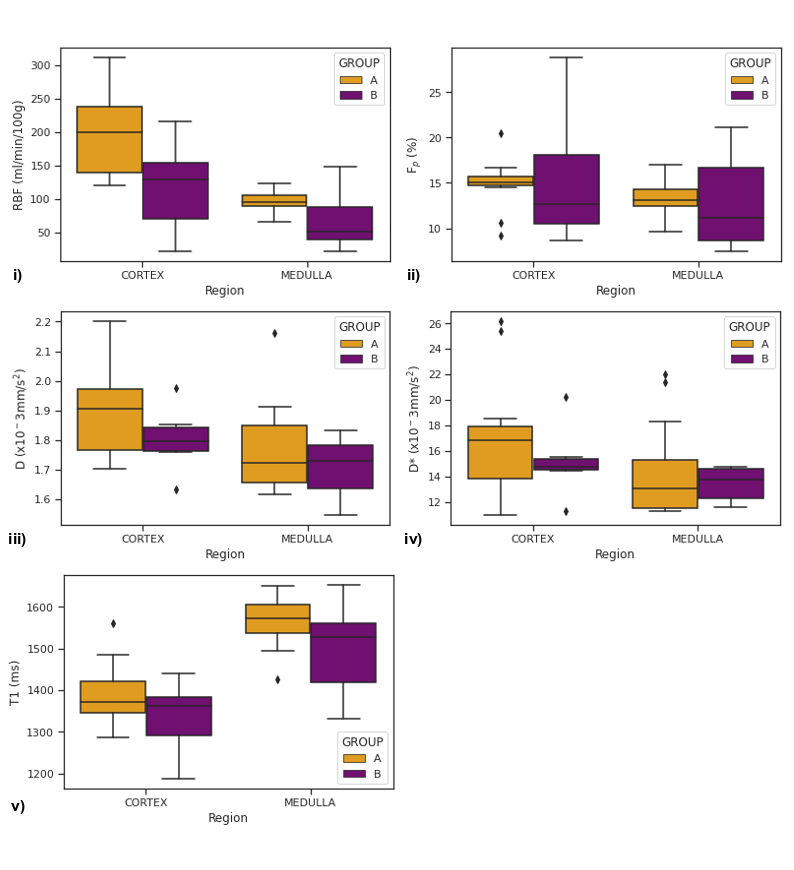
Figure 2: Overview of cortical and medullary RBF, D, D* and Fp
across the two groups: patients with good progression (group A) and patients
with complications during the follow up period (group B). Boxplot of: i) renal
blood flow, ii) perfusion fraction, iii) diffusion coefficient D, iv) D* diffusion coefficient and v) T1 values.
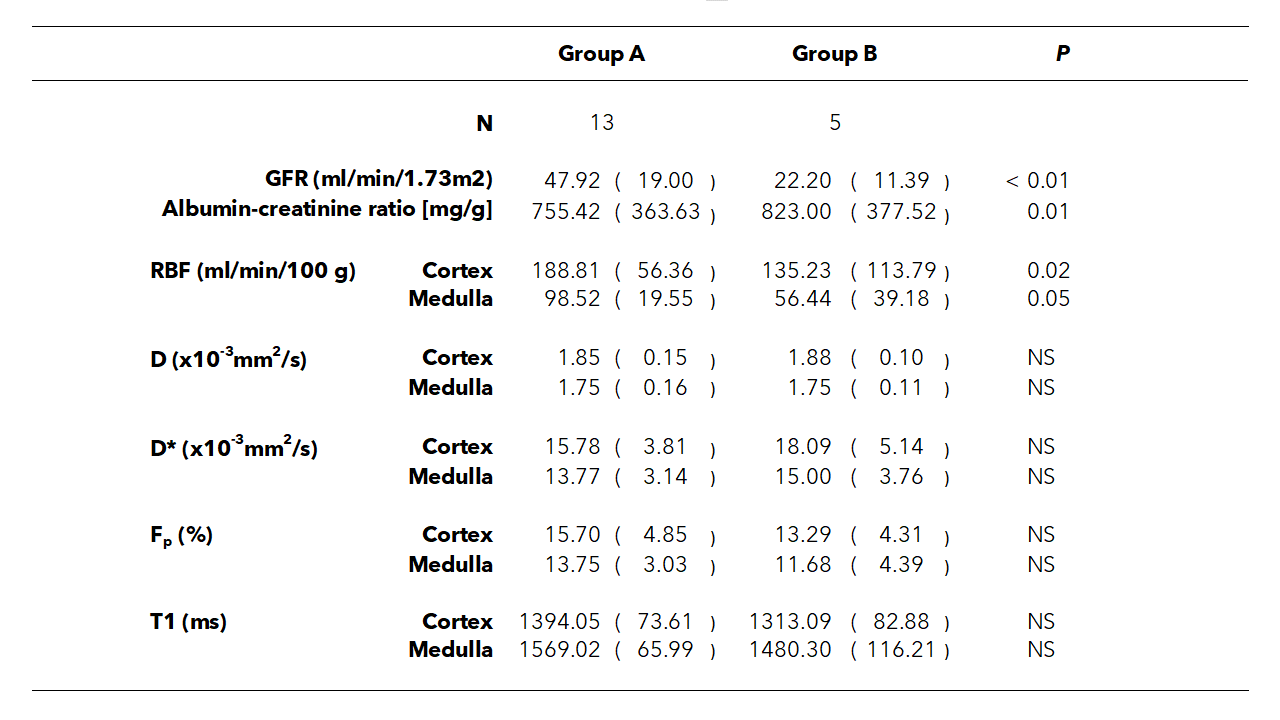
Table 2:
Clinical and imaging parameters for each group and results
of groupwise comparison. Values are reported as mean (SD). P value –
significant differences between groups. Significance level was p < 0.05.
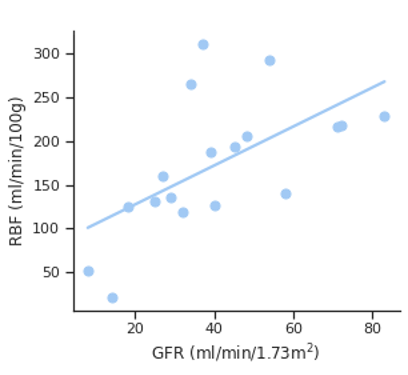
Figure 3:
Correlation of cortical RBF with eGFR. Correlation
coefficient was: r = 0.68 (p < 0.00).
DOI: https://doi.org/10.58530/2022/0479