0478
Measurement of renal perfusion using ASL-MRI and renal oxygenation using BOLD-MRI in dogs: a pilot study1Department of Morphology, Imaging, Orthopedics, Rehabilitation and Nutrition, Faculty of Veterinary Medicine, Ghent University, Merelbeke, Belgium, 2Department of Radiology and Nuclear Medicine, Ghent University Hospital, Ghent, Belgium
Synopsis
ASL- and BOLD-MRI have shown great potential in humans and rodents. To date, however, these techniques have not been used to image the canine kidney. Therefore, renal blood flow (RBF) and relaxation rate (R2*) were assessed using ASL and BOLD sequences on a beagle at 3T to examine the feasibility of both techniques in dogs. Mean RBF was 263.3 ± 39.0 and 277.4 ± 83.3 ml/100g/min in the right and left kidney, respectively. Mean R2* in the right kidney was 22.6 (range 14.8 - 36.8) s-1. This pilot-study demonstrates the feasibility of ASL- and BOLD-MRI for renal assessment in dogs.
Introduction
Renal disorders are a common problem, in both humans and companion animals. In dogs, the prevalence of chronic kidney disease alone is estimated to be between 0.5 and 7% 1. Previous studies in veterinary medicine have urged the need for better methods that can diagnose kidney diseases and elucidate the pathophysiological process 2,3. Current methods to assess canine kidney function (e.g. renal biomarkers in blood and urine) are cumbersome and ineffective to detect early kidney damage 3-5.Noninvasive magnetic resonance imaging (MRI) methods like arterial spin labeling (ASL) MRI and blood oxygenation level dependent (BOLD) MRI show great potential to address these challenges. Both techniques rely on an endogenous contrast to assess renal perfusion and renal tissue oxygenation, respectively 6. Unlike contrast-enhanced ultrasound, which usually takes single plane images, ASL- and BOLD-MRI characterize the entire kidney.
Functional MRI measures in combination with standard anatomical images allow comprehensive characterization of the kidney 6. To date, ASL- and BOLD-MRI have been used in humans and rodents7, but has not been used to image the canine kidney. Therefore, the purpose of this study was to determine whether a scan protocol could be composed to visualize renal perfusion and renal tissue oxygenation in dogs.
Methods
A healthy Beagle (male, 3 years, 10 kg) was scanned in dorsal recumbency on a Siemens PrismaFit 3T. Before the MRI scan, the dog was deprived of water and food for 5 and 12 hours, respectively. Sedation was achieved with administration of butorphanol (0.2 mg/kg, i.v.). Anesthesia was induced with propofol (4 mg/kg, i.v.) and maintained with inhalation of isoflurane (2%) in 100% oxygen. Midazolam (0.2 mg/kg, i.v.) was supplemented because of superficial breathing. To evaluate perfusion, a multi-TI FAIR QTIPS ASL scan with background suppression was performed (Siemens WIP ASP 1023H), with TIs ranging from 250 to 2500ms, Bolus length 1000ms. TR/TE 4500/23.58ms, matrix 64x64, 8 oblique coronal 8mm slices, 272x136mm FOV, 5 measurements per TI. Afterwards a second single-TI FAIR ASL was performed with TI=2000ms, 30 measurements. RBF maps are calculated on the scanner. Segmentation and statistics were done with FSL (https://fsl.fmrib.ox.ac.uk/). A multi-echo GRE sequence with 12 equally spaced echo times (TR 70ms/TEs 4.20:4.20:50.40ms), matrix 96x96, FOV 180x180, four 4mm slices, was used to generate BOLD contrast. A 15 sec breath-hold was induced by applying end-expiratory positive pressure with the breathing balloon. R2* maps were calculated with T2Processor (https://github.com/gifmi) in Matlab R2019a, and the TLCO (Twelve-Layer Concentric Objects) method8 was used to calculate mean R2* in the cortex and medulla.Results
In dogs, the kidneys are oriented oblique in two axes in the abdomen, which makes positioning more challenging compared to humans (Fig 1). Fig 2 shows multi-TI FAIR QTIPS perfusion weighted images. Based on these data, a TI of 2000 ms was chosen to be optimal. Fig 3 shows the Renal Blood Flow (RBF) map, scaled from 0 to 500 ml/100g/min. Mean (sd) RBF in the R kidney was 263.3 (39.0), in the L kidney 277.4 (83.3) ml/100g/min. There is a clear distinction in RBF between the cortex and medulla. Fig 4 shows R2*. Mean R2* in twelve concentric layers is from outside to inside; 30.2, 24.0, 20.7, 19.4, 16.8, 15.2, 14.2, 17.2, 20.9, 23.5, 36.8 and 32.8 s-1 respectively.Discussion
Canine renal perfusion MRI can be performed on a clinical scanner. The ASL voxel size was relatively large in this experiment, so future experiments are needed to see if this can be reduced.ASL-MRI derived RBF seems comparable to the true RBF in healthy dogs obtained by an ultrasonic flow-probe 9. Lee et al. (2020) divided the renal arterial flow measured with the ultrasonic flow-probe on the renal artery by the renal cortical volume quantified on CT images to calculate the true RBF of the kidney 9. The researchers reported a mean RBF of 246.28 and 273.68 mL/min/100g versus an RBF of 263.3 and 277.4 mL/min/100g in this study 9. Furthermore, Renal Blood Flow values are in a similar range as human renal perfusion (mean RBF of 229 ± 41 ml/min/100g) 10.
Using induced breath-hold, BOLD data of good quality can be obtained. Positioning of the imaging plane in a dog is more challenging than in human, because of the orientation of the kidneys in the abdomen. As for ASL-MRI, the measurements obtained with BOLD-MRI in dogs were in proximity of to those in humans. In humans, the mean R2* in the outer concentric layers ranged from 23.4 to 27.9 s-1 and from 30.7 to 31.9 s-1 in the inner concentric layers, while the mean R2* of all layers was 28.1 ± 4.5 s-1, which is in line with the values obtained in this experiment 8.
Conclusion
In this study, we demonstrate the feasibility of ASL- and BOLD-MRI for quantification of renal perfusion and tissue oxygenation in dogs by a tailored scan protocol. However, further optimalisation for better image quality is necessary. RBF values are very similar to reference RBF values obtained with ultrasonic flow probes. Both ASL- and BOLD-MRI may contribute to an improved diagnosis of renal diseases and clarification of underlying pathophysiological processes. The canine model can also be used to validate renal ASL in humans.Acknowledgements
Funding was provided by the Special Research Fund of Ghent University, Belgium (BOF grant 01D27919). The authors thank research assistant Stephanie Bogaert and the colleagues of the Department of Morphology, Imaging, Orthopedics, Rehabilitation and Nutrition, and the Small Animal Department for their assistance during the MRI scan, and Dr. Bernd Kühn (Siemens Healthcare AG, Erlangen, DE) for providing the ASL WIP sequence.
References
1. Lund EM, Armstrong PJ, Kirk CA, et al. Health status and population characteristics of dogs and cats examined at private veterinary practices in the United States. J Am Vet Med Assoc. 1999;214(9):1336–41.2. Miyagawa Y, Takemura N, Hirose H. Assessments of factors that affect glomerular filtration rate and indirect markers of renal function in dogs and cats. J Vet Med Sci. 2010;72(9):1129–36.
3. Von Hendy-Willson E V & Pressler B M. An overview of glomerular filtration rate testing in dogs and cats. Vet. J. 2011;188(2):156–165.
4. Schneider M. Ultrasound Contrast Agents. In: Kiessling F, Pichler BJ, editors. Small Animal Imaging. Berlin, Heidelberg: Springer; 2011. p. 219–29.
5. Kazmierski B, Deurdulian C, Tchelepi H, et al. Applications of contrast-enhanced ultrasound in the kidney. Abdom. Radiol. 2018;43(4):880–898.
6. Selby NM, Blankestijn PJ, Boor P et al. Magnetic resonance imaging biomarkers for chronic kidney disease: a position paper from the European Cooperation in Science and Technology Action PARENCHIMA. Nephrol. Dial. Transplant. 2018;33(suppl_2):ii4–ii14.
7. Ku M-C, Fernández-Seara MA, Kober F, Niendorf T. Noninvasive Renal Perfusion Measurement Using Arterial Spin Labeling (ASL) MRI: Basic Concept. In Preclinical MRI of the Kidney: Methods and Protocols. Edited by Pohlmann A, Niendorf T. New York, NY: Springer US; 2021:229–239.
8. Piskunowicz M, Hofmann L, Zuercher E, et al. A new technique with high reproducibility to estimate renal oxygenation using BOLD-MRI in chronic kidney disease. Magnetic Resonance Imaging 2015;33(3):253–261.
9. Lee SK, Jang Y, Jung JW, et al. Comparison of Renal Blood Flow Using Maximum Slope-Based Computed Tomography Perfusion and Ultrasound Flow Probe in Healthy Dogs. Front Vet Sci. 2020;7(541747).
10. Gillis KA, McComb C, Foster JE, et al. Inter-study reproducibility of arterial spin labeling magnetic resonance imaging for measurement of renal perfusion in healthy volunteers at 3 Tesla. BMC Nephrol. 2014;15(23):1–10.
Figures
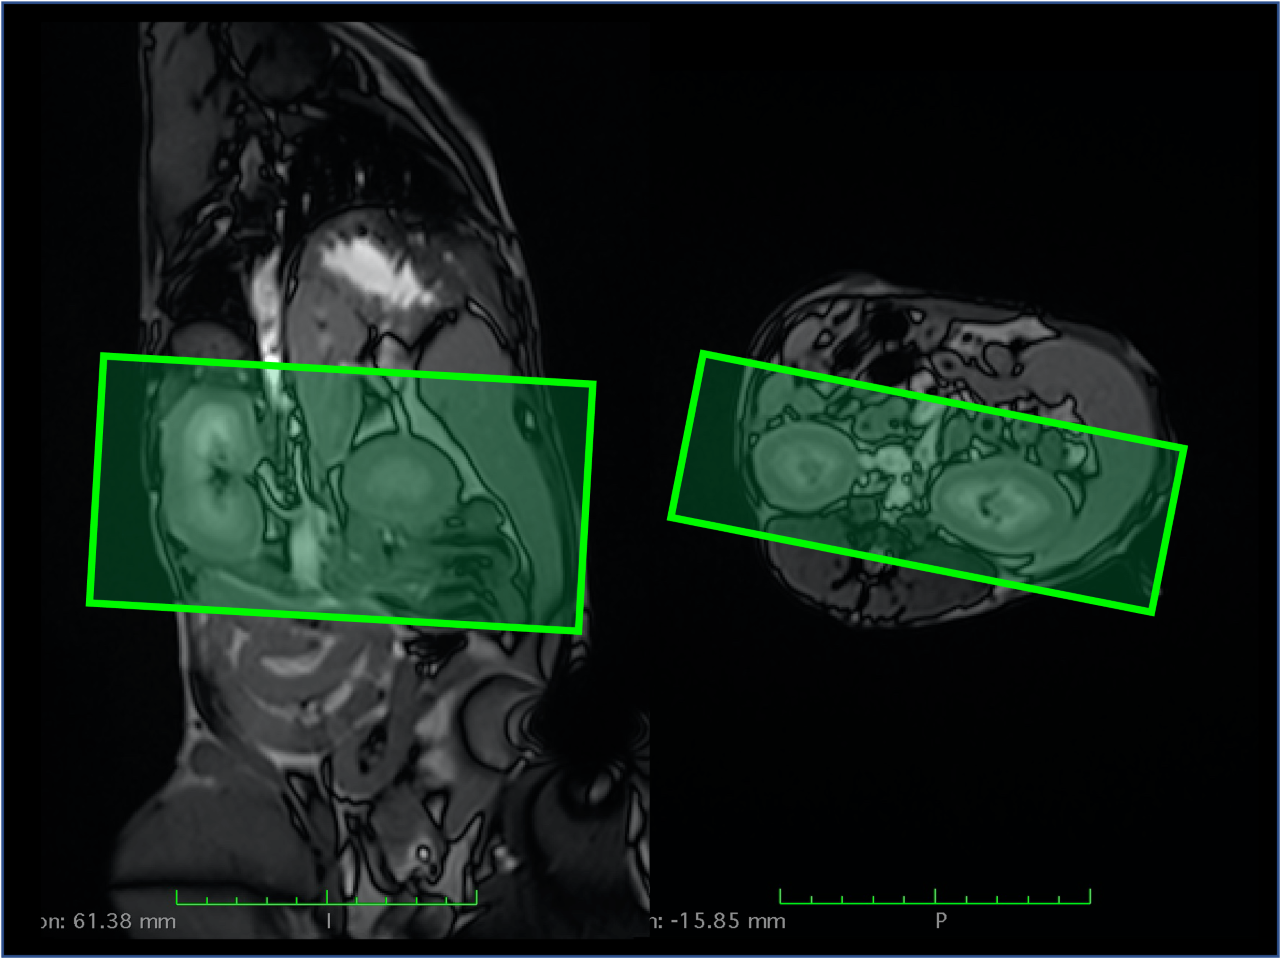
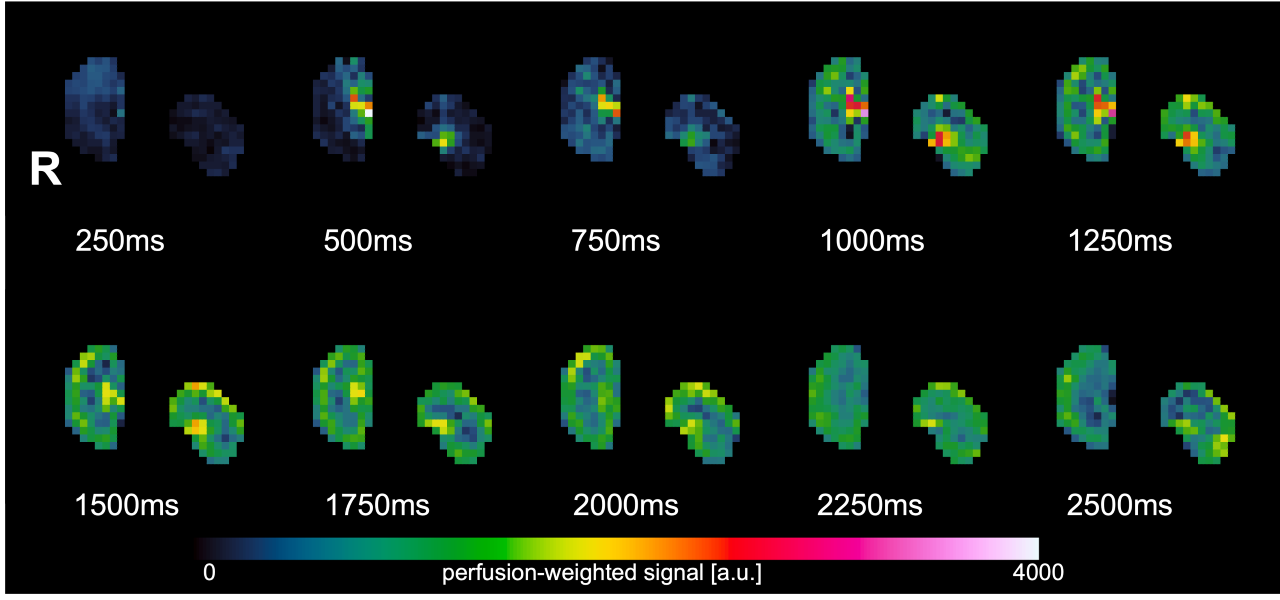

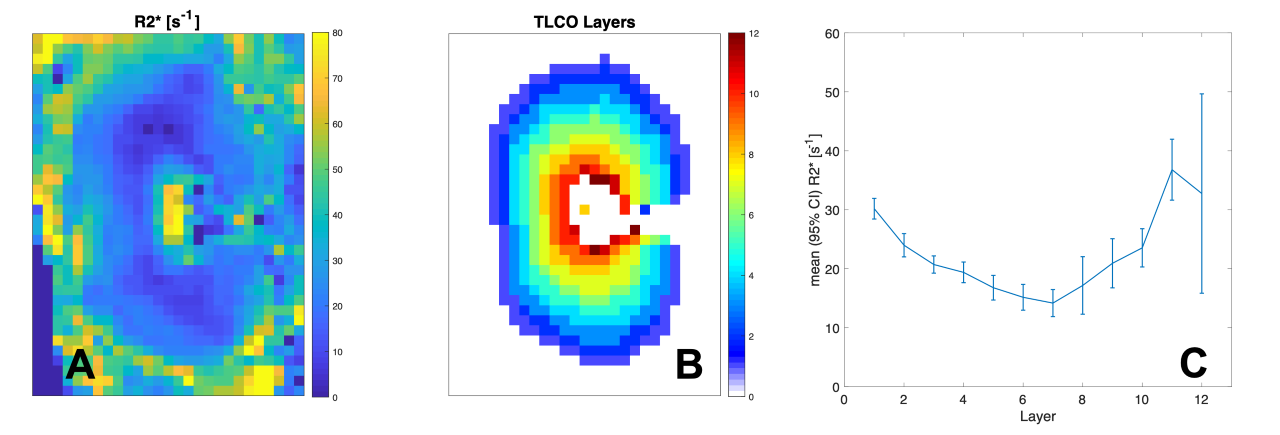
Fig 4: R2* map (A), TLCO layers (B) and R2* in each layer (C). 1 represents the outer layer, 12 the inner layer. Mean R2* ranges from 14.2 to 36.8 s-1, with an average R2* of 22.6 s-1.