0477
Size Matters: Correct diagnoses of MRI based renal oxygenation assessment by monitoring kidney size1Berlin Ultrahigh Field Facility, Max Delbrück Center for Molecular Medicine in the Helmholtz Association, Berlin, Germany, 2Experimental and Clinical Research Center, Charité - Universitätsmedizin Berlin, Berlin, Germany, 3Institute of Physiology, Charite´ - Universitätsmedizin Berlin, Berlin, Germany
Synopsis
Tissue hypoxia occurs during acute kidney injury. MRI-based measurement of renal T2* and T2 could become a non-invasive surrogate marker of tissue oxygenation. However, the relationship between renal oxygenation and T2*,T2 is confounded by changes in the blood and tubular volume fractions, which are often accompanied by changes in kidney size (KS). We performed serial MRI scans along with clinically-realistic interventions acutely affecting renal oxygenation, applied directly while rats were in the scanner. We show that changes in KS correlate with changes in renal T2*,T2, underscoring that monitoring KS is necessary for correct interpretation of renal oxygenation derived from MRI.
Introduction
Current options for treating acute kidney injury (AKI) are disappointing. Serum creatinine-based metrics or alternative blood- or urine-based markers generally do not reveal early events in AKI pathophysiology such as tissue hypoxia.1,2 MRI-based approaches for non-invasive assessment of structural and functional kidney features3 have gained substantial interest, especially kidney size (KS), since several renal pathologies have been associated with changes in KS.4 Moreover, KS is crucial for correct interpretation of MR-based assessments of renal tissue oxygenation by blood oxygenation level-dependent relaxation times T2* and T2. Renal T2*,T2 reflect the amount of deoxygenated hemoglobin per tissue volume, and this is dependent on the renal blood volume and tubular volume fractions.5,6 Because changes in these fractions are often accompanied by KS changes, simultaneous measurements of changes in KS and T2*,T2 are essential for MR-based probing of renal oxygenation. To elucidate this relationship, we performed serial in vivo mapping of T2*, T2 in rats during physiologically realistic interventions that acutely alter renal tissue oxygenation.Methods
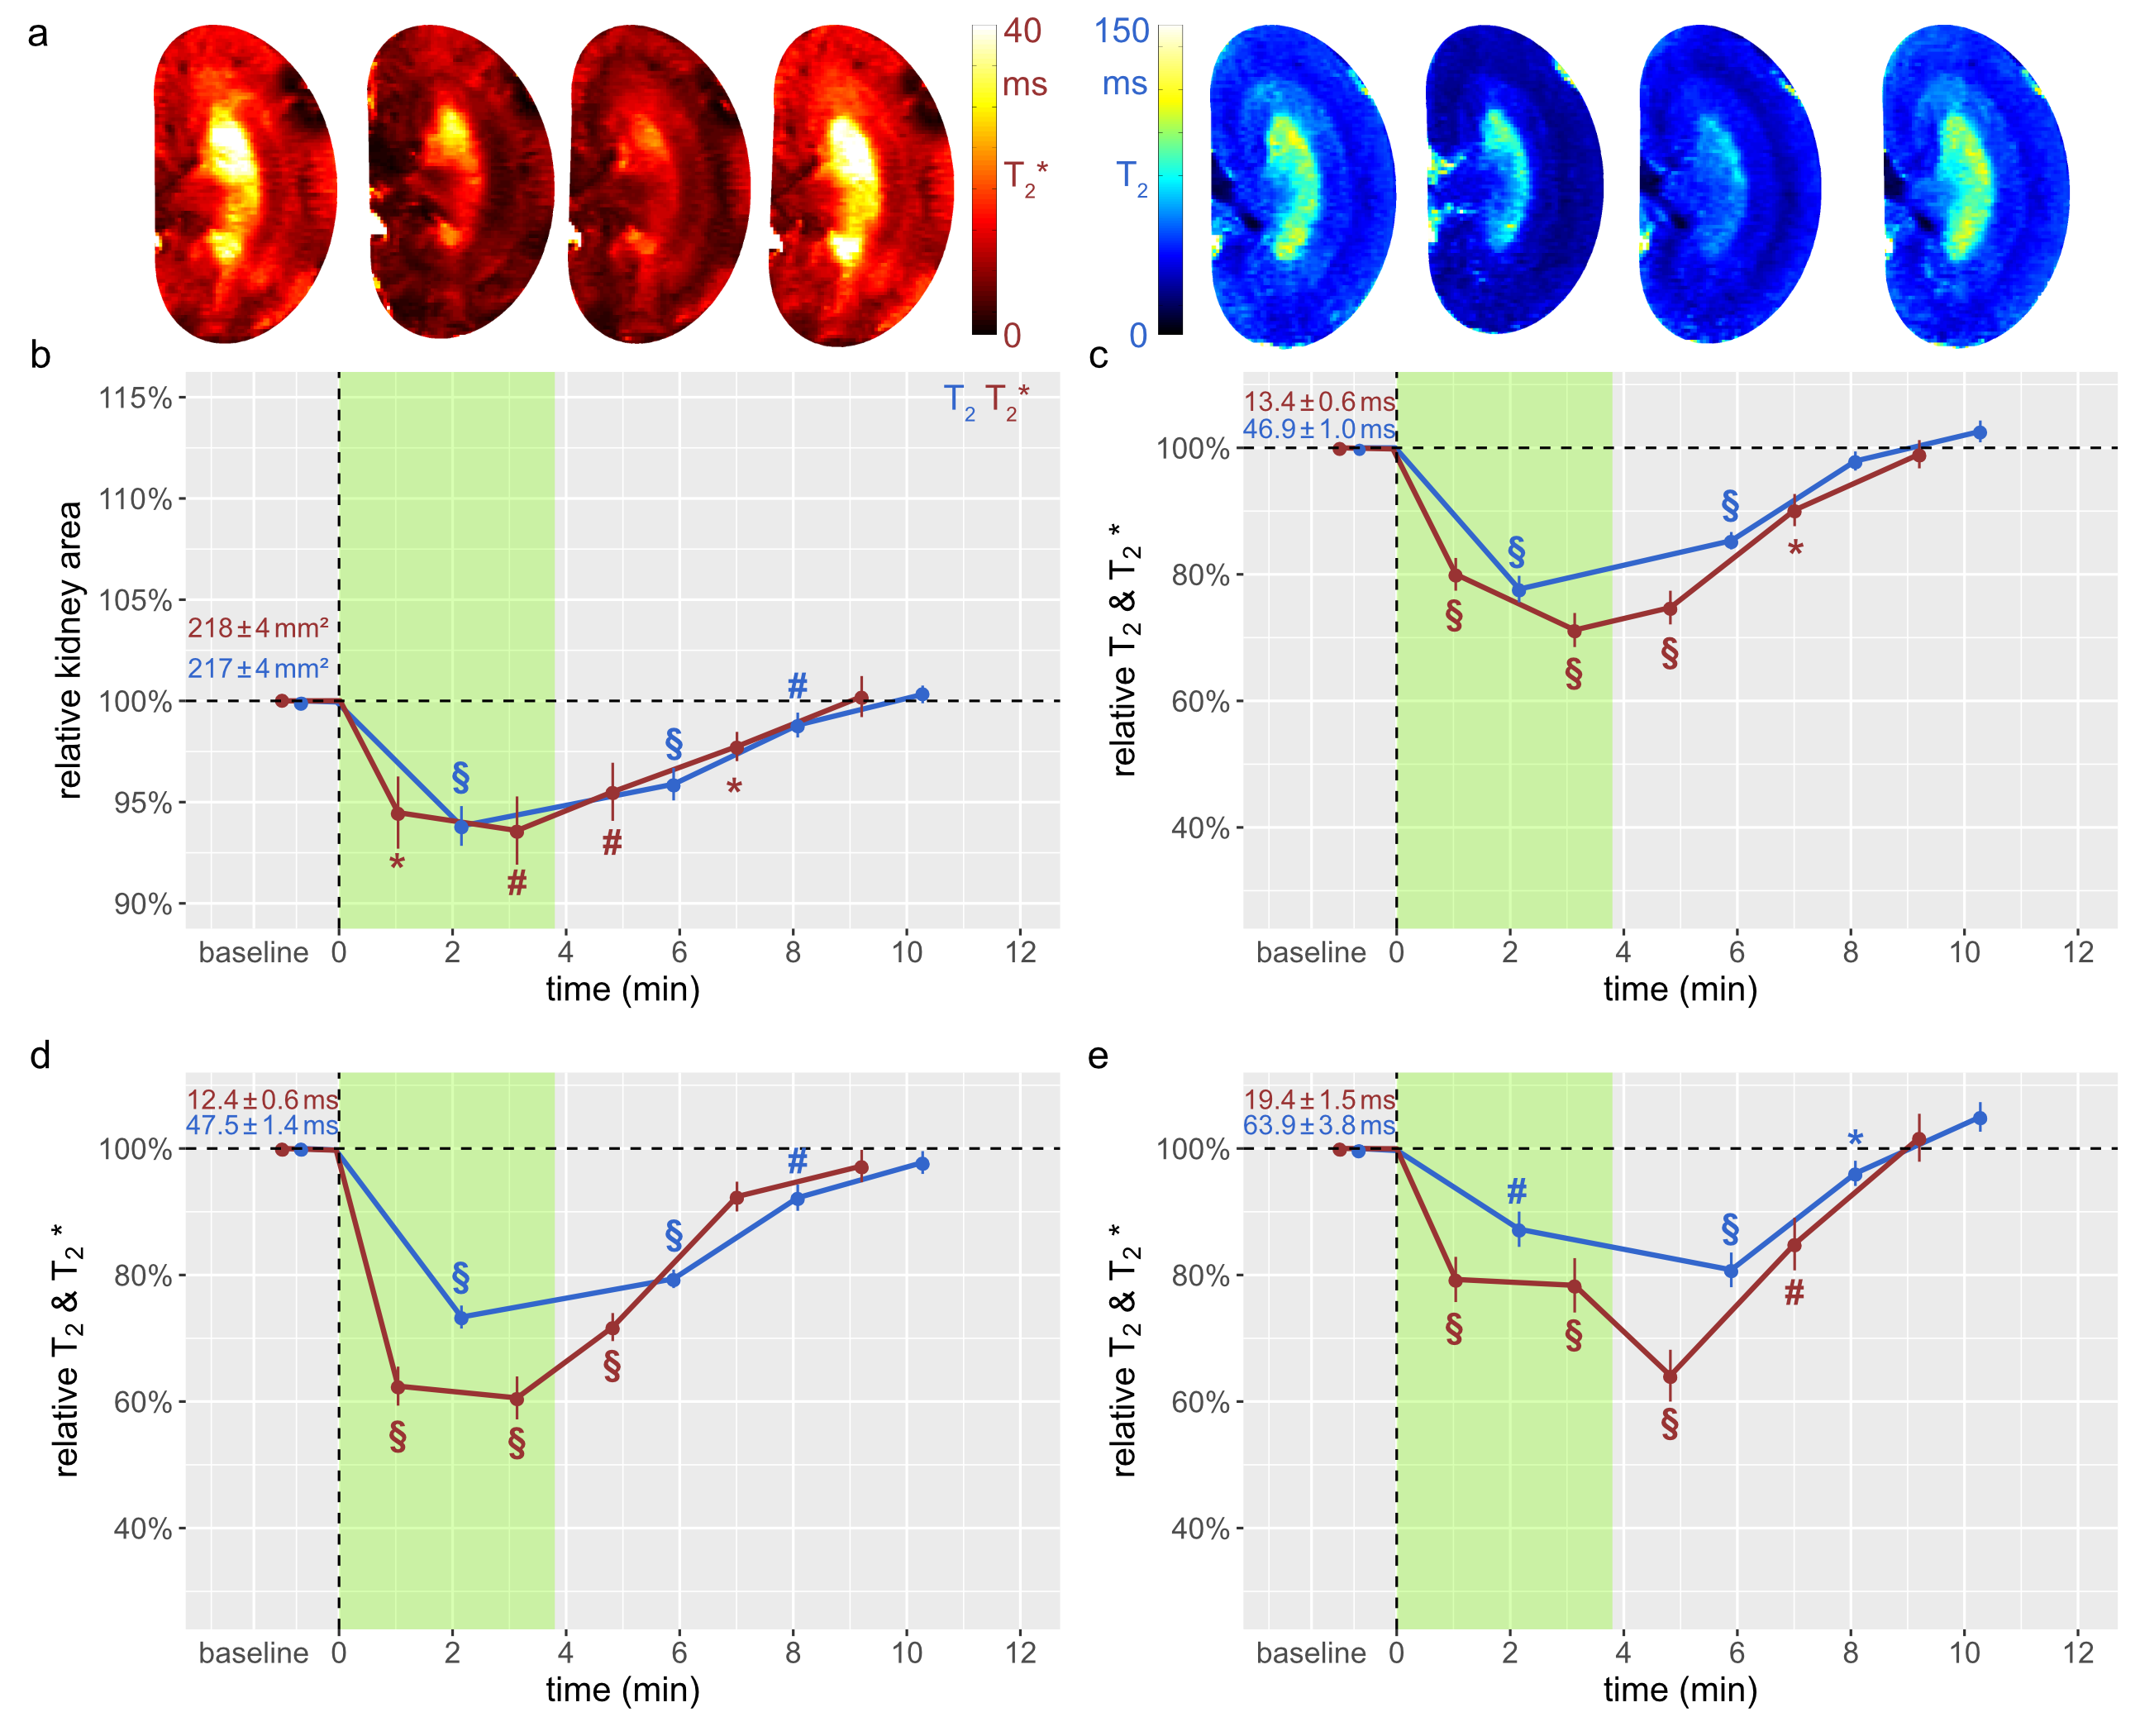
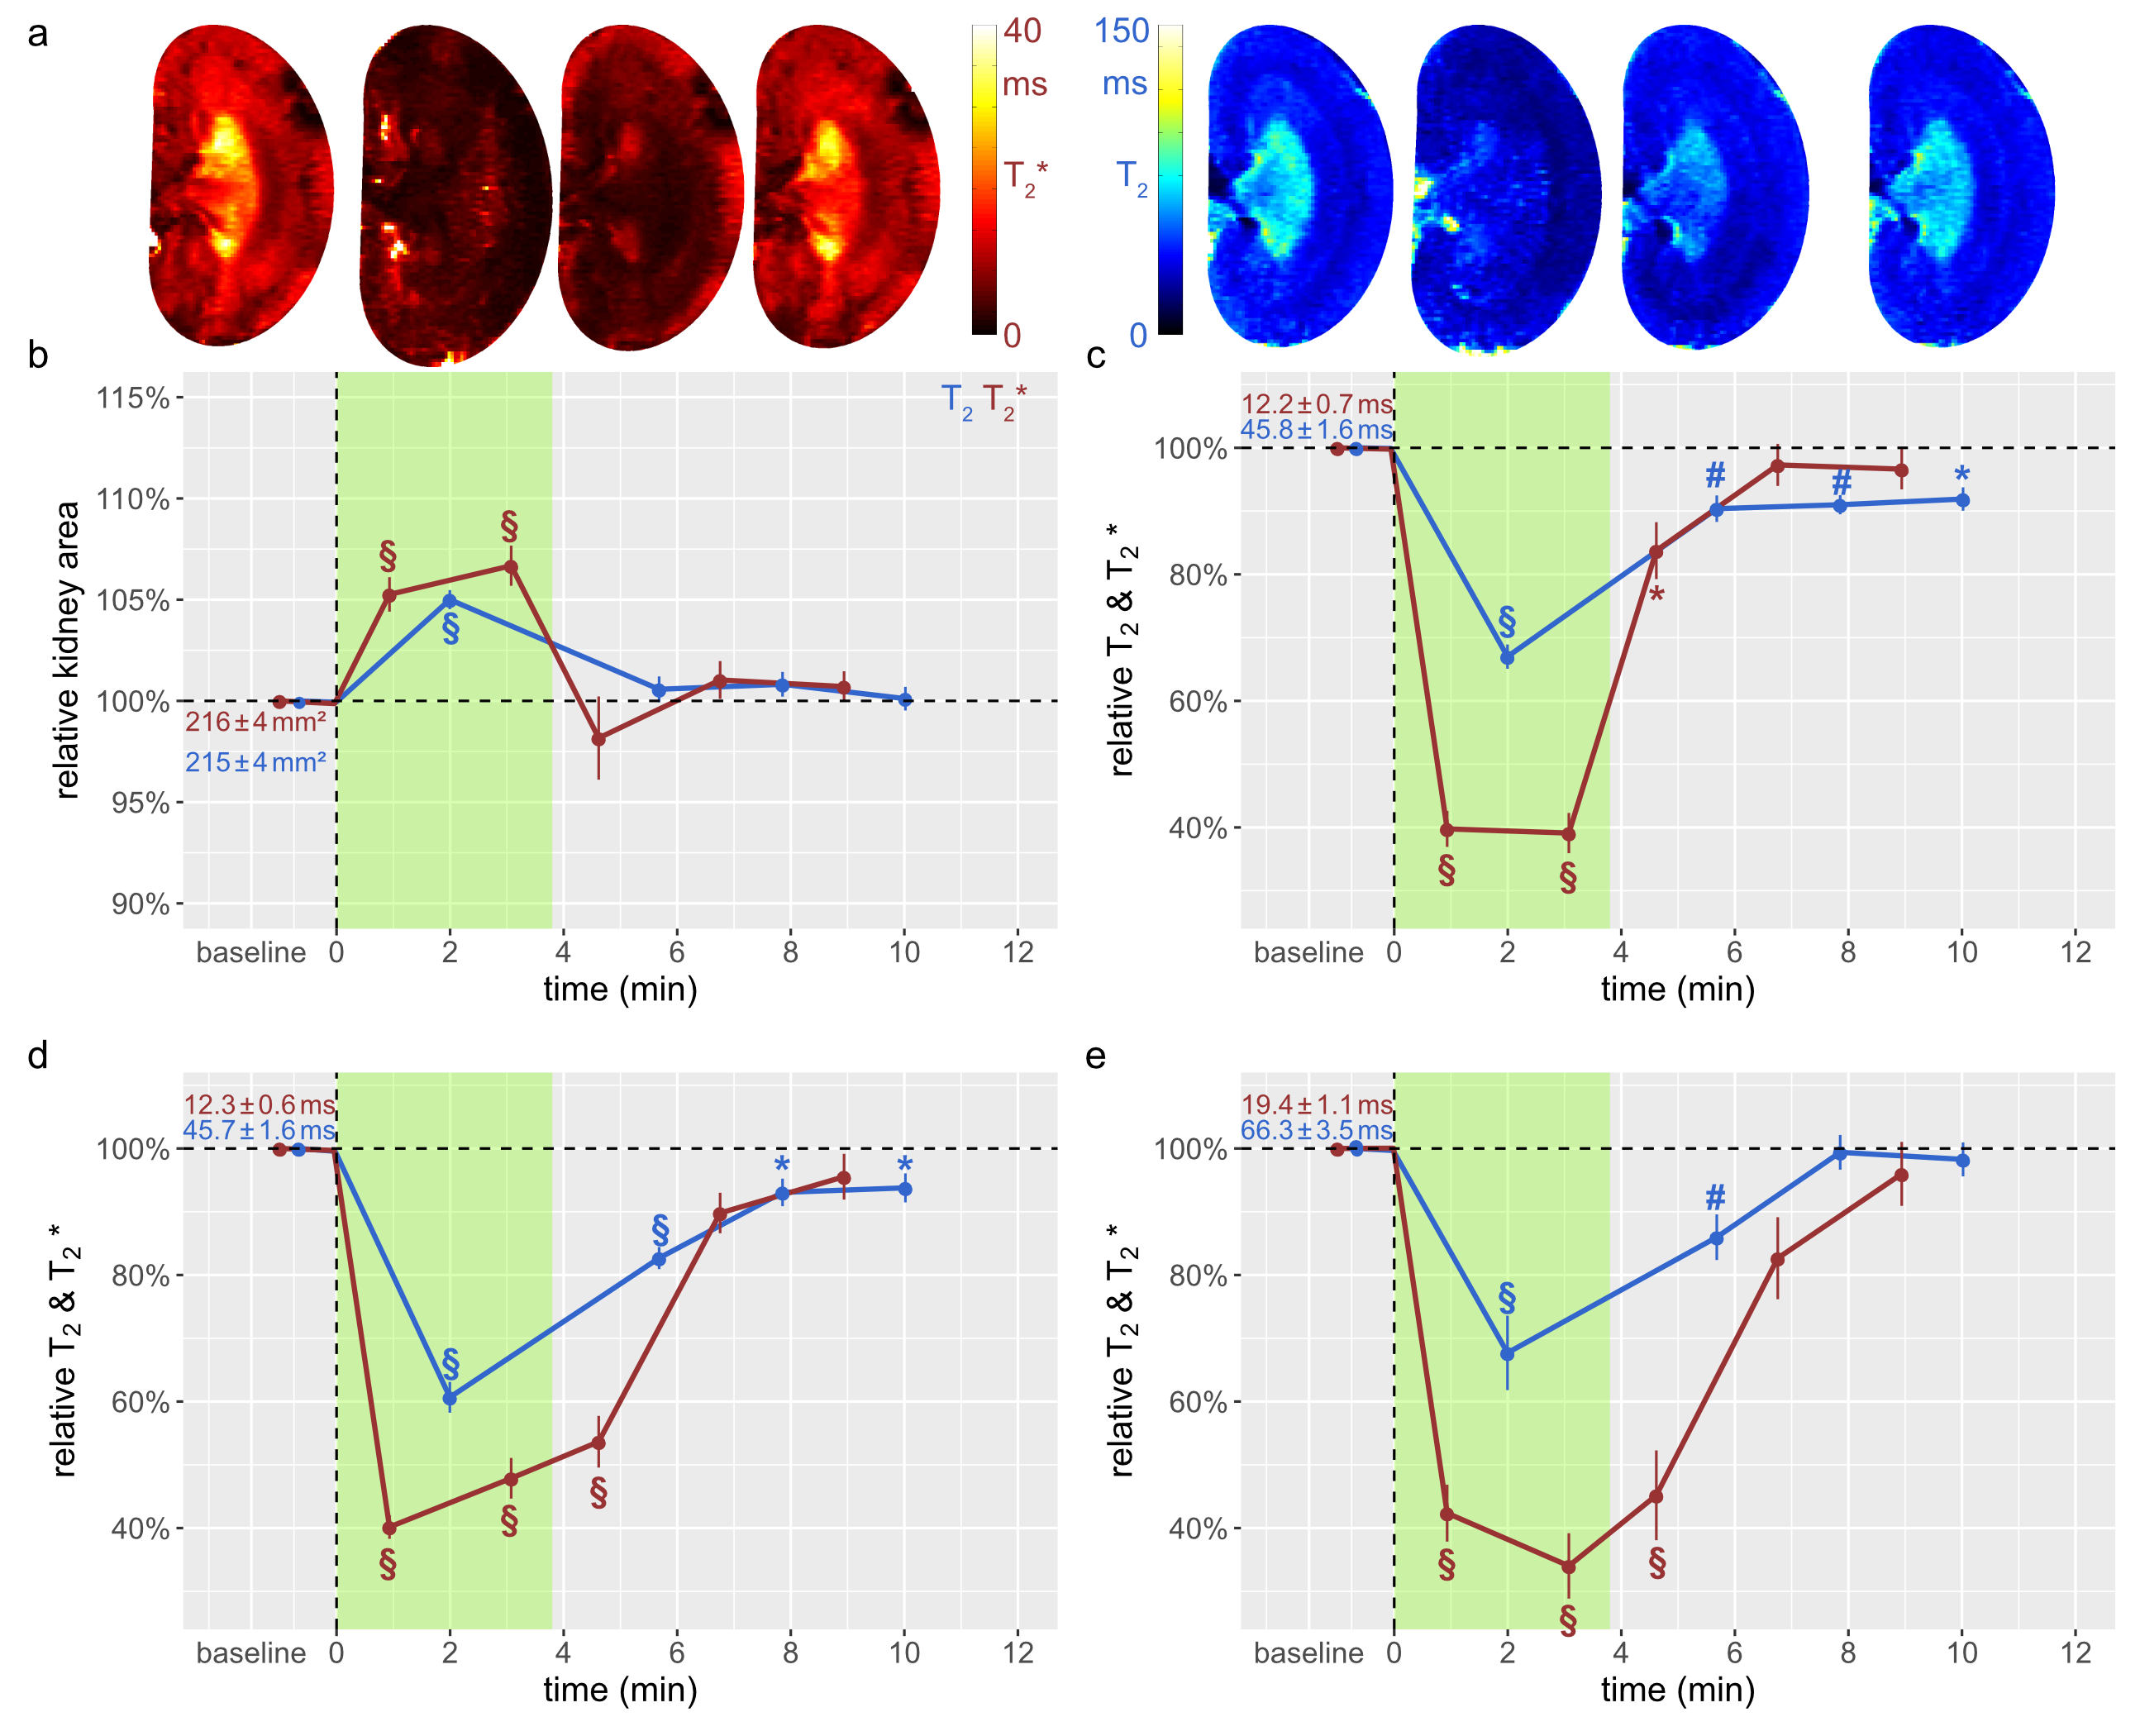
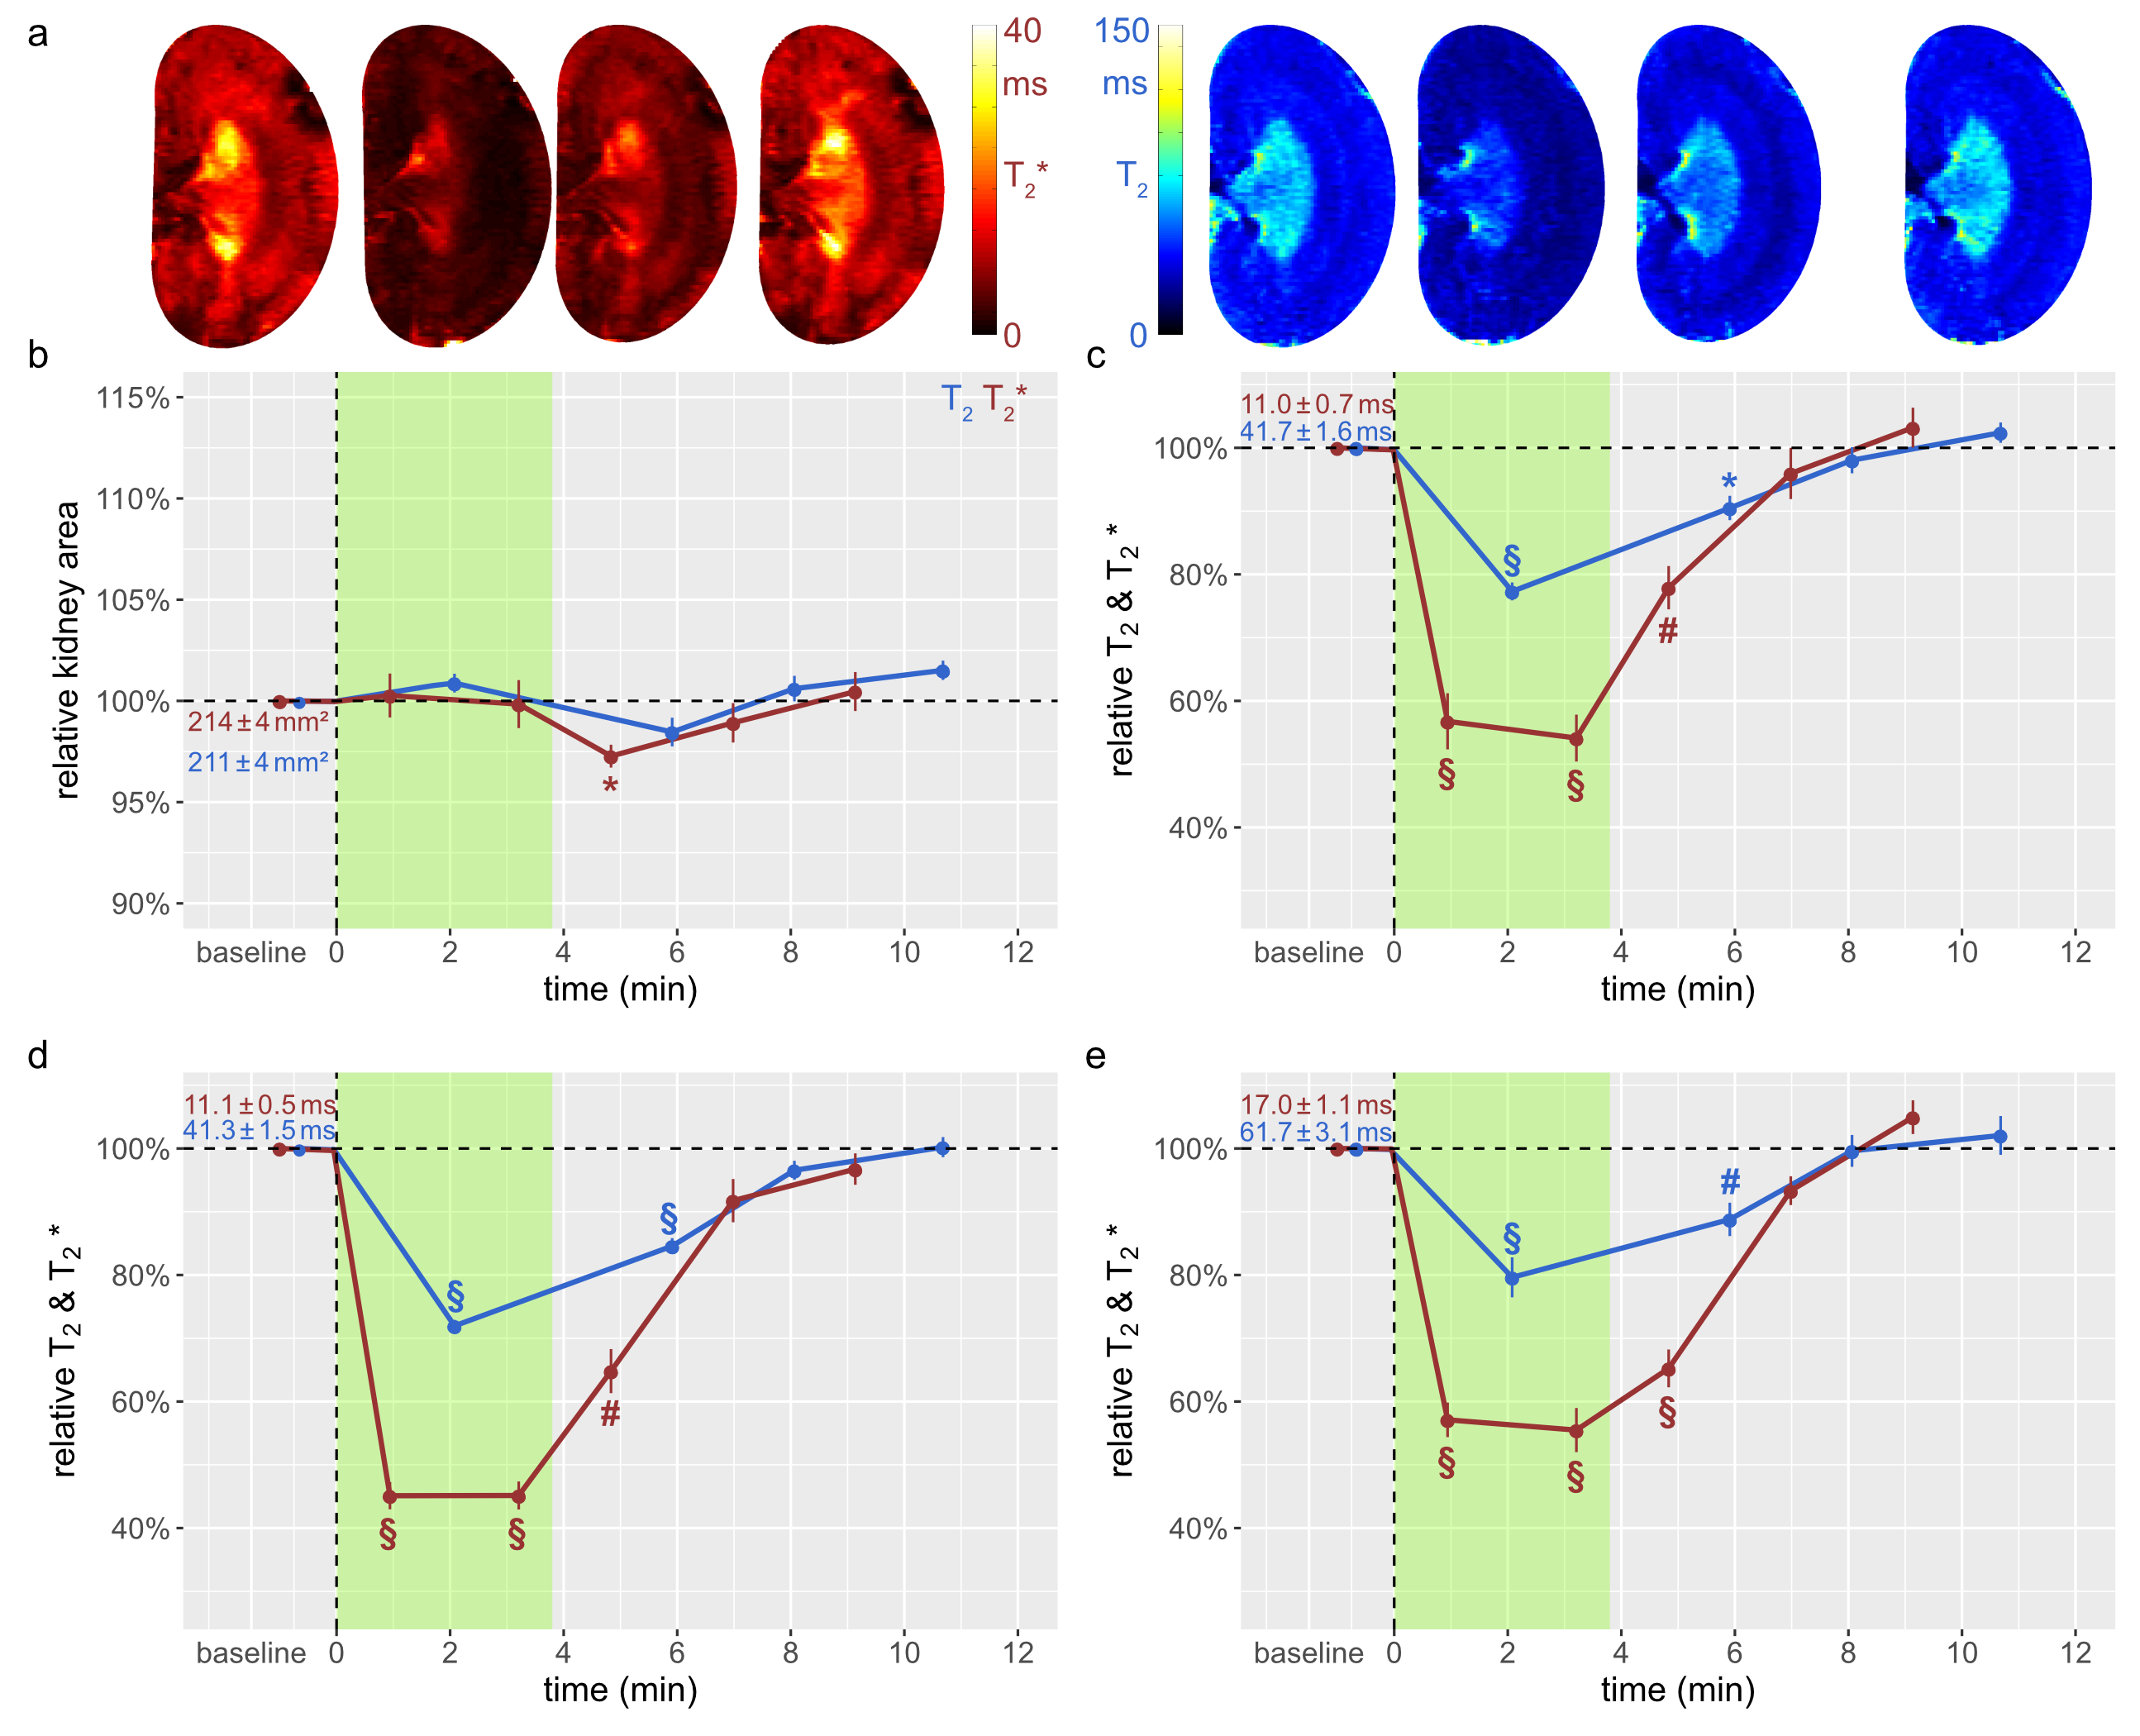
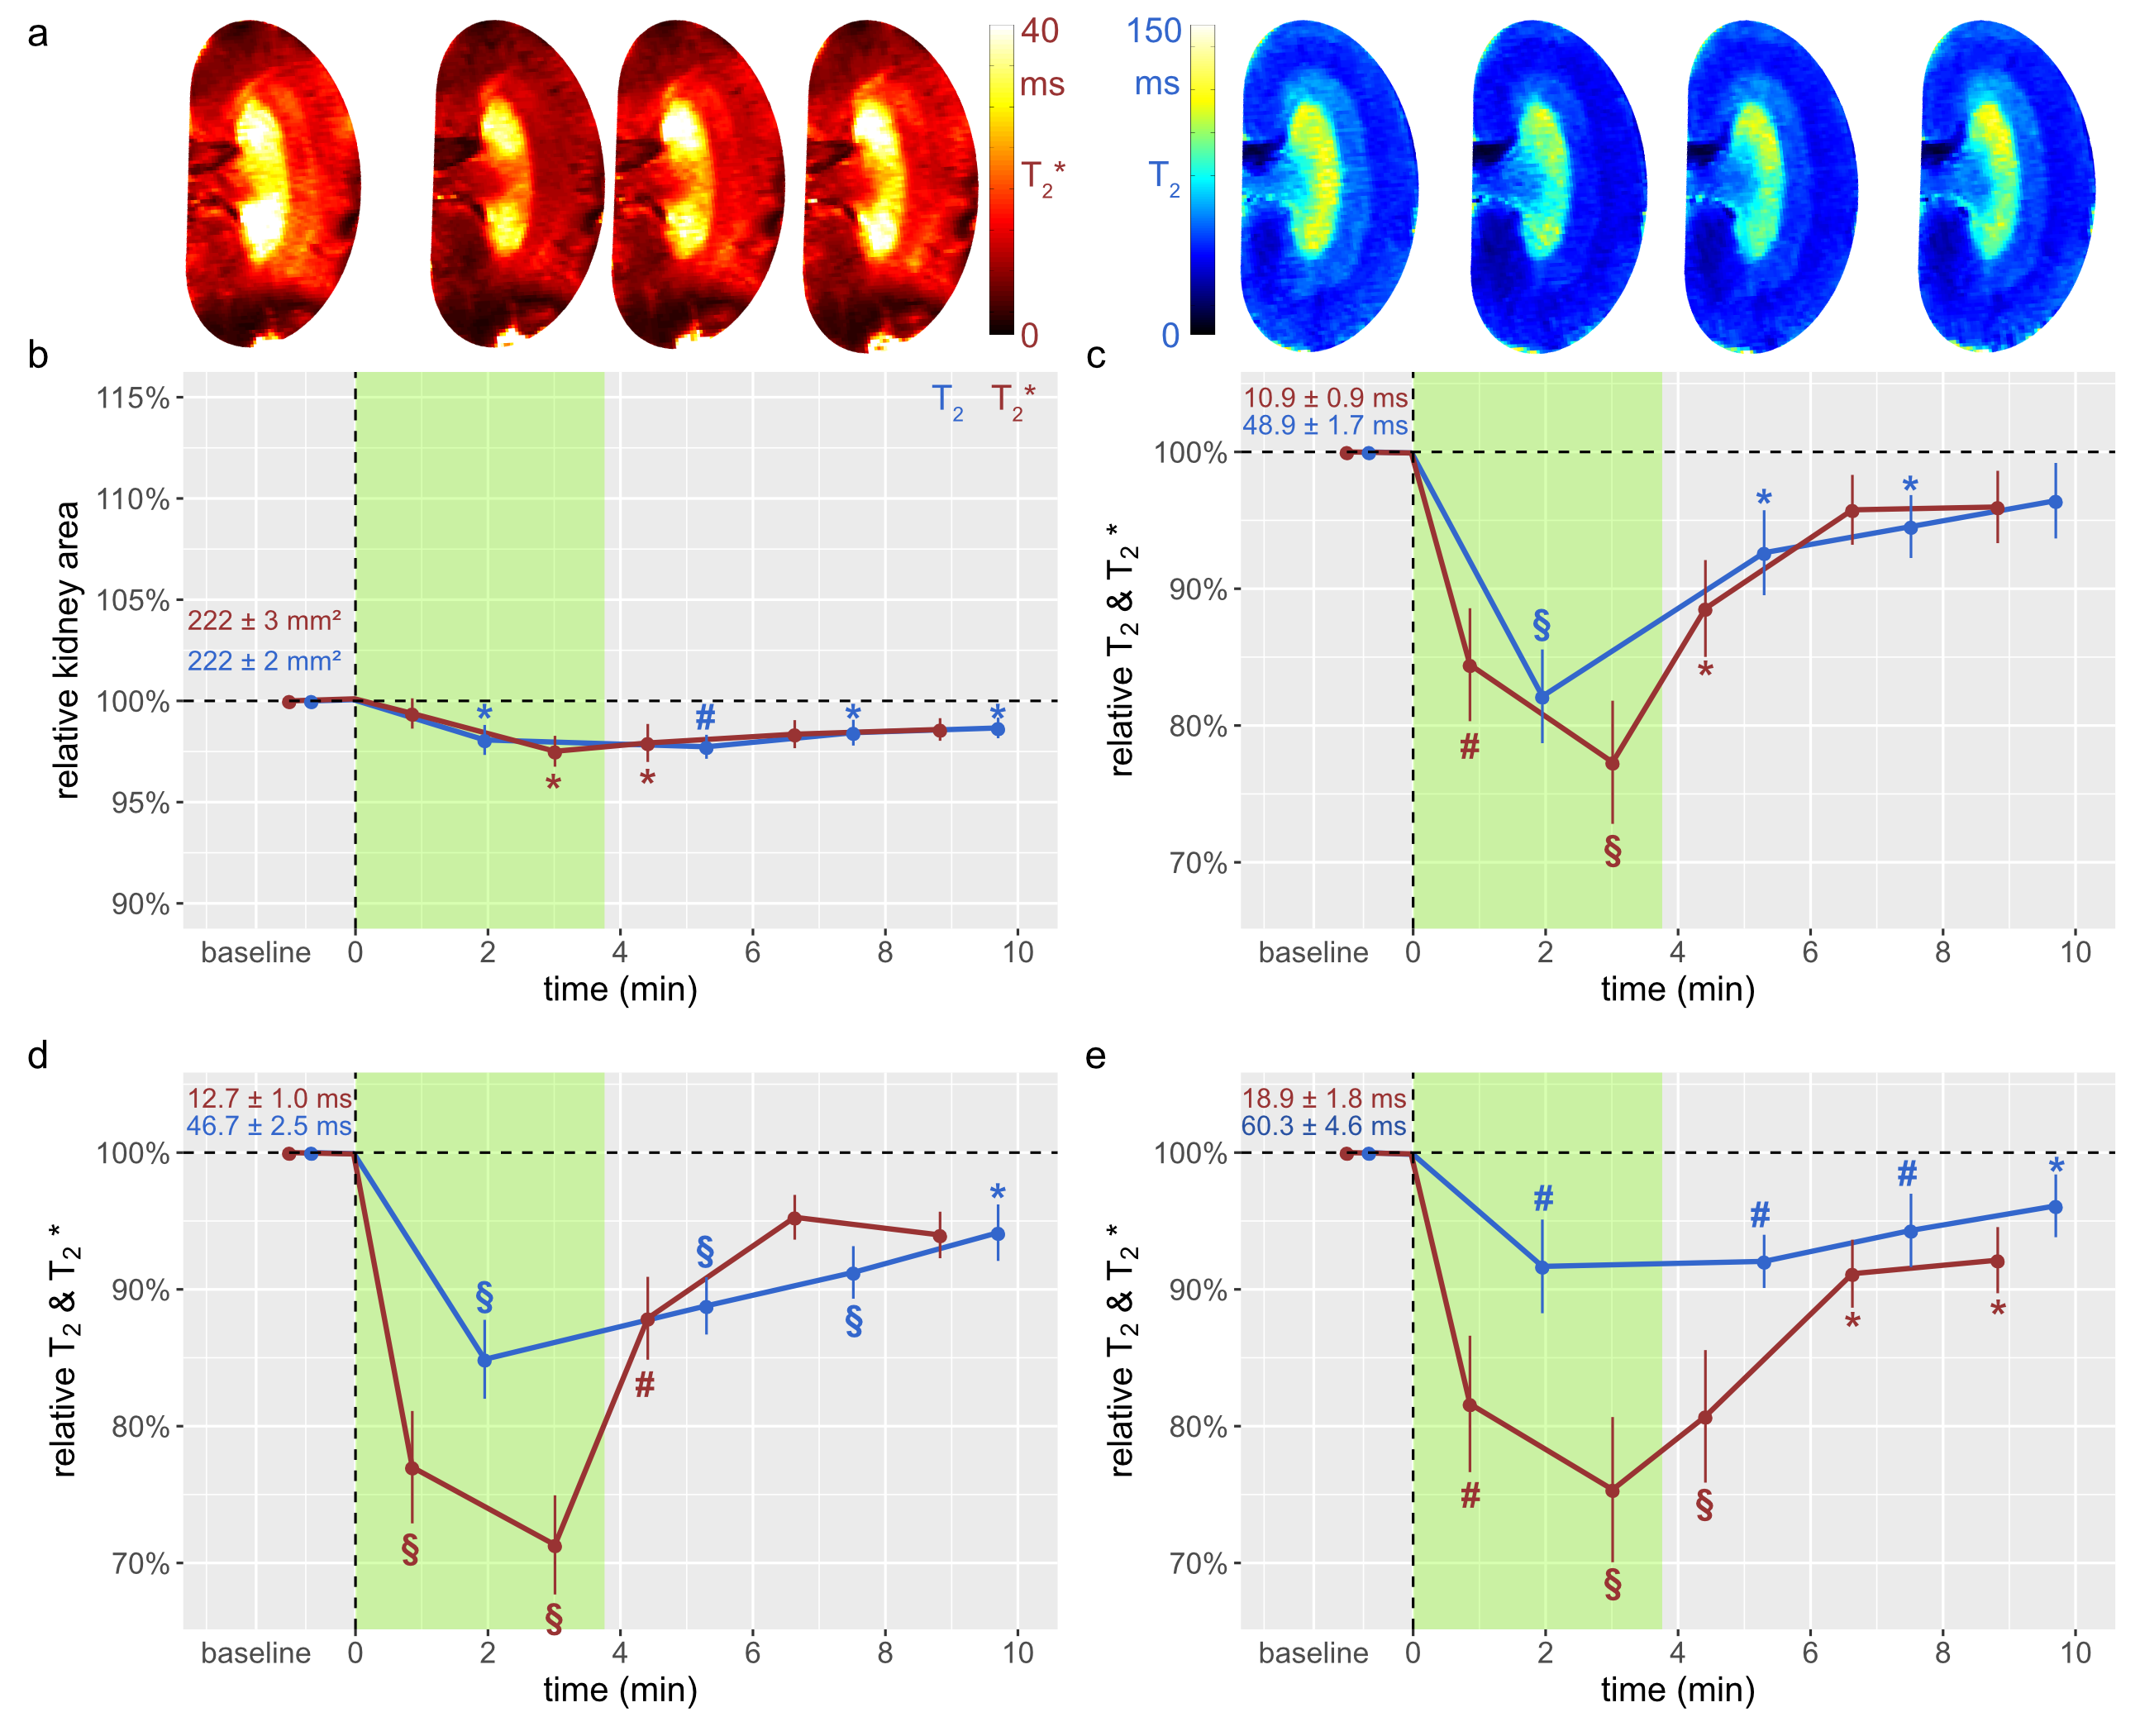
Male Wistar rats (n=37, aged 12-13w) underwent surgical insertion of vascular catheters and probes for measurement of hemodynamics and oxygenation,7,8 and MR-safe remotely-controlled inflatable occluders were applied around the suprarenal aorta and the left renal vein.9 Thereafter, rats were transferred into a 9.4 Tesla small animal MR system (Bruker Biospec 94/20, Bruker Biospin) with a linear RF volume resonator and a 4-channel surface RF coil array. For T2* mapping, a multi-gradient echo technique was used: TR=50ms, nechoes=10, first TE=2.1ms, tinter-echo ΔTE=2.1ms, FA=16°, naverages=4, tacquisition=23s. For T2 mapping a multi spin-echo technique was used: TR=500ms, nechoes=13, first TE=6.4ms, tinter-echo DTE=6.4ms, naverages=1, tacquisition=58s. A mid-coronal oblique image slice was acquired: in-plane resolution=226x445µm2, FOV=38.2x50.3mm2, matrix size=169x113 (zero-filled to 169x215), slice thickness=1.4mm. Rats equipped with vascular occluders underwent a series of T2, T2* mapping MR scans prior to the occlusions (baseline), during occlusion, and following release of occlusions. Other subgroups of rats underwent baseline MR scans, and follow-up scans after induction of hypoxia or injection of the X-ray contrast medium iodixanol. Parametric maps of absolute T2* and T2 were calculated by mono-exponential fitting to the signal intensities of the T2*- and T2-weighted images acquired at different echo times.10 Median T2* and T2 values for regions-of-interest (ROI) within the renal cortex (CO), outer medulla (OM), and inner medulla (IM) were calculated from the parameter maps. For determination of KS, segmentation of the coronal, mid-slice cross-sectional area of the kidney was done using an automatic bean-shaped model.10Results
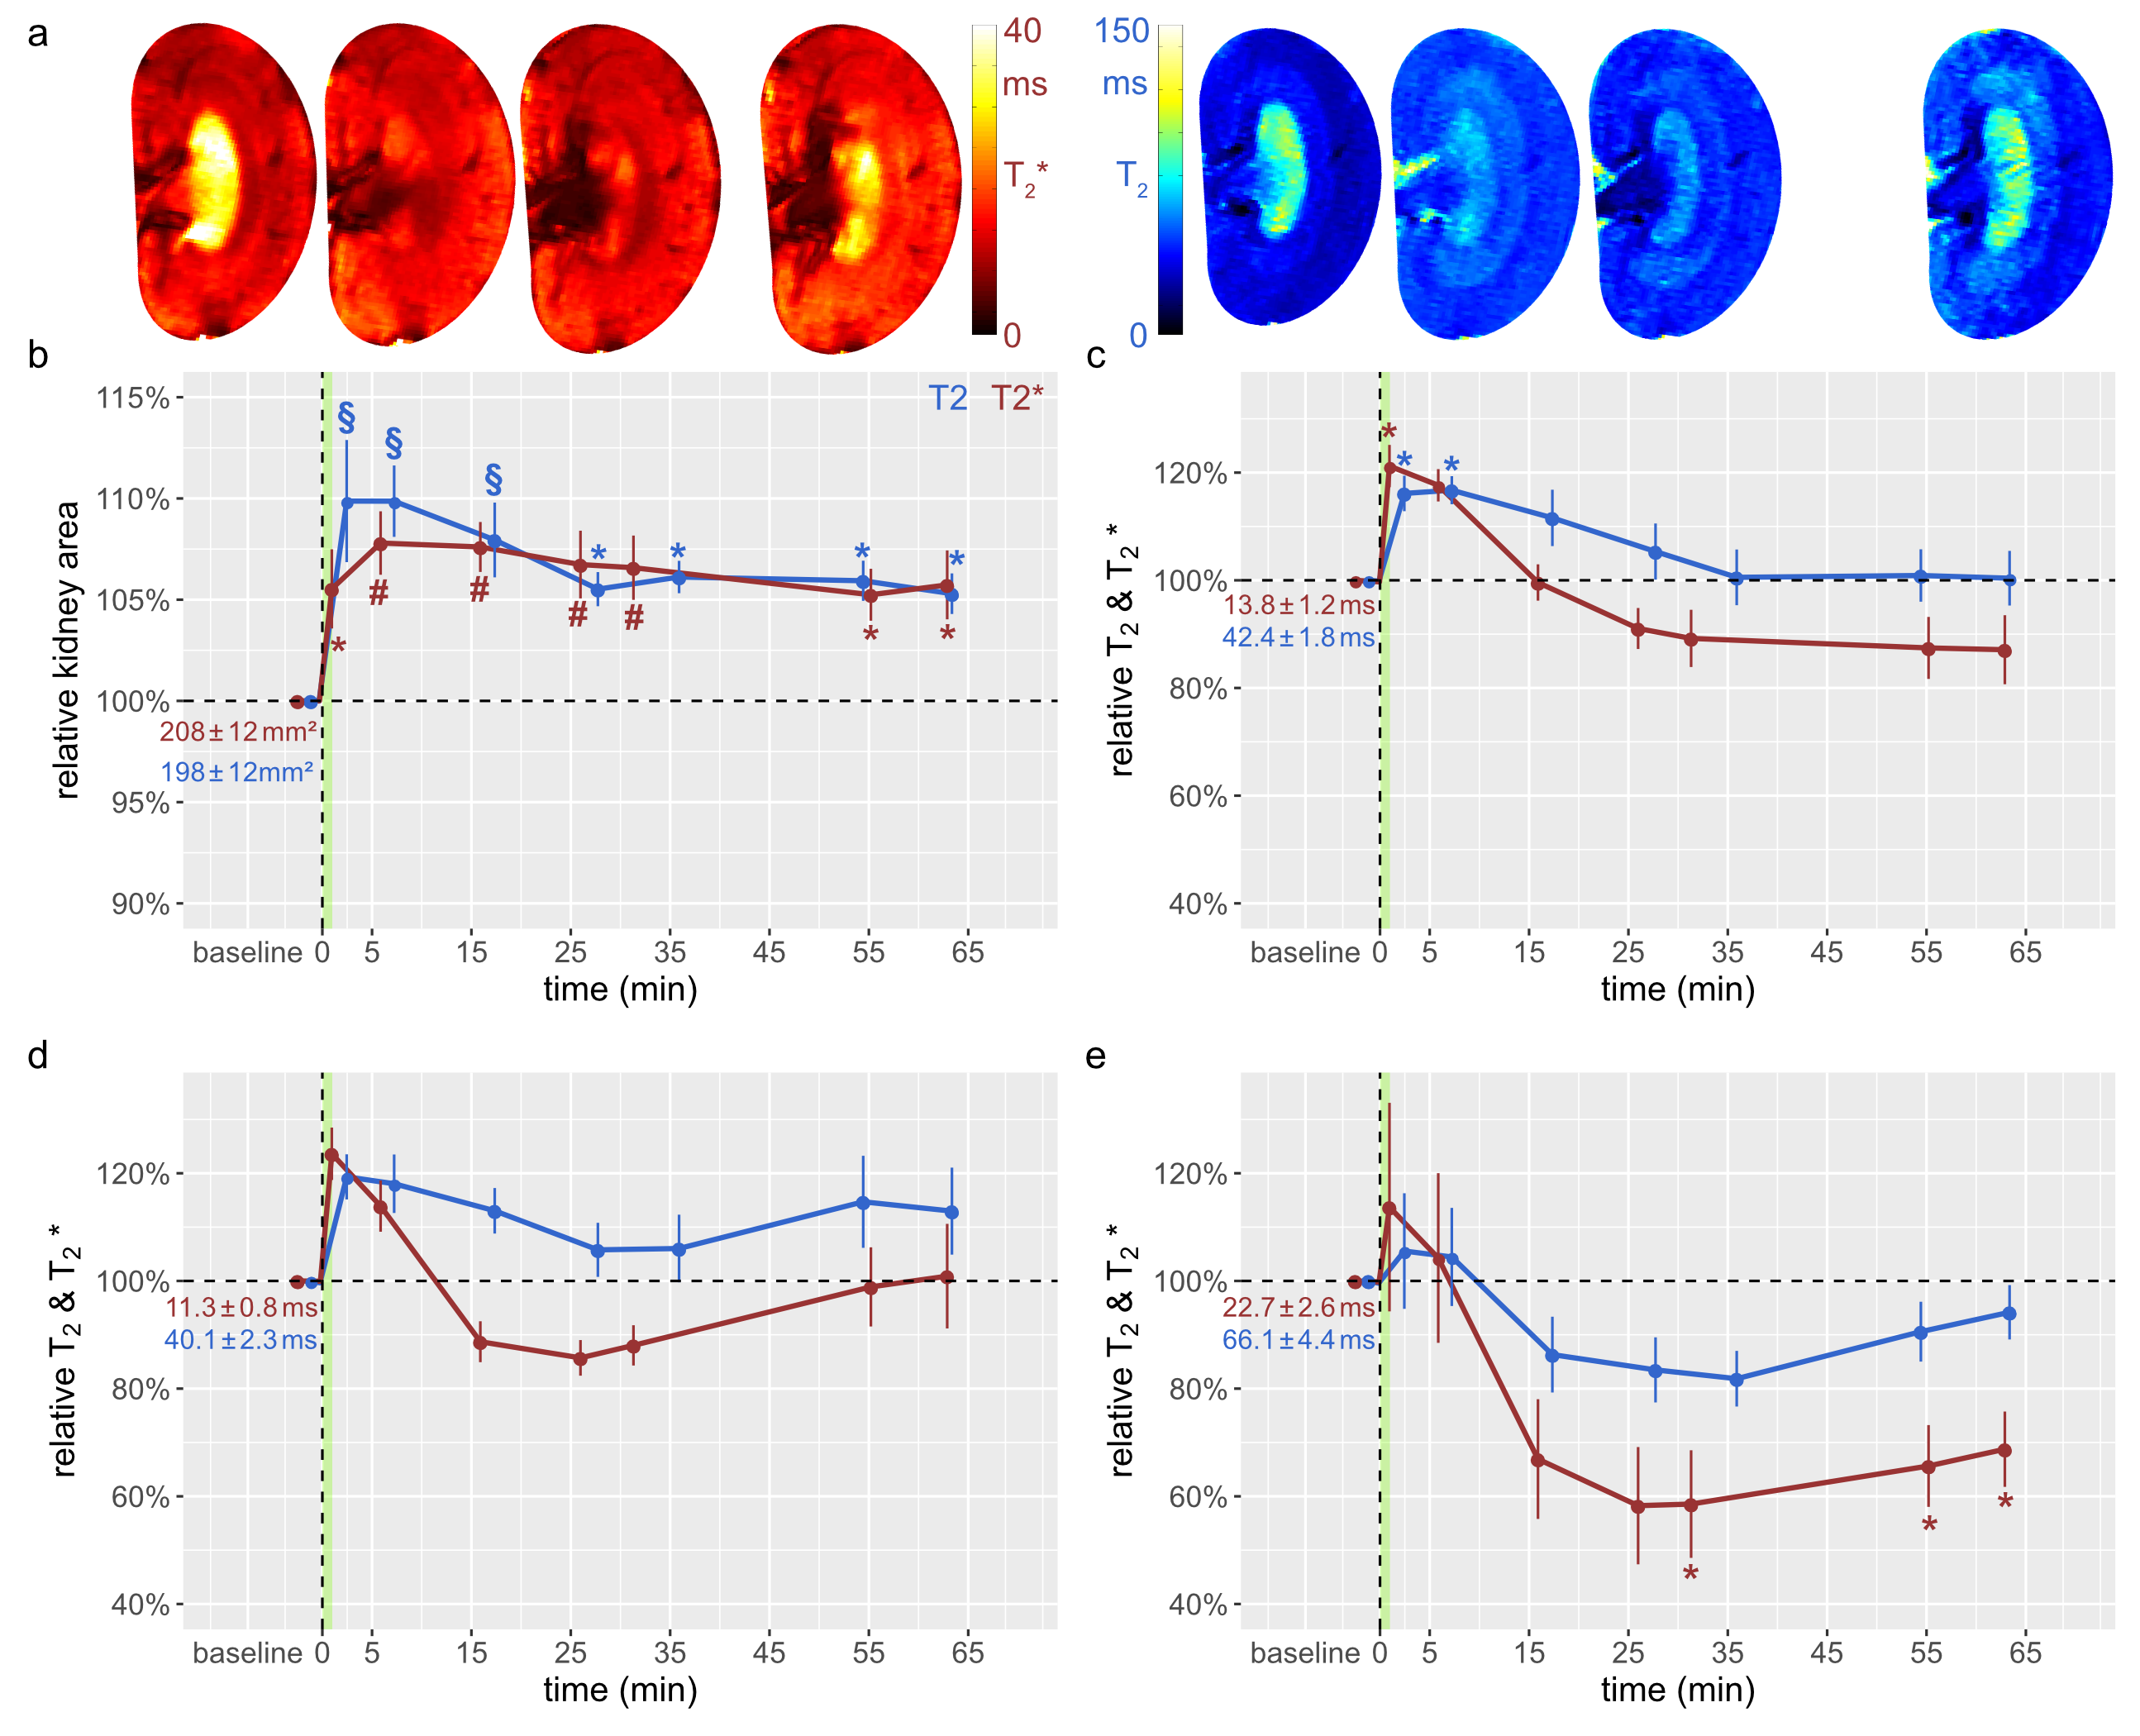
The suprarenal aorta was occluded (OA) for 3.8±0.3min, followed by recovery for 7min. Upon occlusion of the suprarenal aorta (OA), KS decreased significantly, and upon occlusion release returned to baseline (Fig.1). OA resulted in significant decreases in T2 in the CO, OM, and IM. Similar results were obtained for T2*, though changes during OA were more pronounced than for T2. Upon occlusion of the renal vein (OV), KS increased significantly, and returned to baseline upon release (Fig.2). OV led to T2 and T2* decreases in all layers, which exceeded the changes observed for OA. Restoration of T2 and T2* toward baseline upon release of OV occurred more slowly than following OA. Simultaneous occlusion of both the suprarenal aorta and the renal vein (SOAV) did not affect KS, but did result in decreased T2 and T2* in all layers (Fig.2) Changes in T2* were more pronounced than T2 changes, though less dramatic than those observed with OV alone. Induction of hypoxemia (HYP) significantly reduced KS and decreased T2 and T2*in all layers (Fig.4). Administration of iodixanol induced a sustained increase in KS, that persisted throughout the observation period of ~1h (Fig.5). Both T2 and T2* showed an initial increase after administration, followed by a subsequent decrease back to baseline, or even below baseline values for the duration of the observation.Conclusions
Renal hypoxia is associated with AKI and transition to chronic kidney disease. Here we applied interventions that simulate clinical scenarios (OA, OV, SOAV, which can occur during surgery; HYP and administration of iodixanol), and which acutely impact renal oxygenation, directly in vivo while the animals were in the MRI scanner. We show that changes in T2*, T2 were associated with parallel changes in KS. Thus, correct interpretation of T2*, T2 as surrogate markers for renal tissue oxygenation must take into account changes in KS. If T2*, T2 decrease and KS remains unchanged, tissue oxygenation is reduced. If T2*, T2 decrease and KS also decreases, the reduction in tissue oxygenation is more severe than if KS is unchanged; if T2*, T2 decrease and KS increases, the reduction in tissue oxygenation is less severe. This study demonstrates that monitoring of kidney size facilitates correct interpretation of renal oxygenation derived from MRI in acute pathophysiological scenarios. As renal size can be directly obtained from spatial mapping of the MRI markers of renal oxygenation (T2 and T2*), monitoring of kidney size should always accompany MRI oximetry. This non-invasive and in vivo approach of probing renal oxygenation can greatly support studies into the mechanisms of renal pathophysiology, and holds the promise of swift translation to human studies and into clinically meaningful diagnosis and management of renal disease.Acknowledgements
This work was supported by the German Research Foundation, CRC 1365 “Renoprotection” (Gefördertdurch die Deutsche Forschungsgemeinschaft [DFG], SFB 1365 “Renoprotection”).References
1. Molitoris BA. Urinary Biomarkers: Alone Are They Enough? JAmSocNephrol. 2015;26(7):1485-1488.
2. van Duijl TT, Soonawala D, de Fijter JW, Ruhaak LR, Cobbaert CM. Rational selection of a biomarker panel targeting unmet clinical needs in kidney injury. Clin Proteomics. 2021;18(1):10.
3. Niendorf T, Pohlmann A, Arakelyan K, et al. How bold is blood oxygenation-dependent (BOLD) magnetic resonance imaging of the kidney? Opportunities, challenges and future directions. Acta Physiol (Oxf). 2015;213(1):19-38.
4. Magistroni R, Corsi C, Martí T, Torra R. A Review of the Imaging Techniques for Measuring Kidney and Cyst Volume in Establishing Autosomal Dominant Polycystic Kidney Disease Progression. Am J Nephrol. 2018;48(1):67-78.
5. Pohlmann A, Arakelyan K, Hentschel J, et al. Detailing the relation between renal T2* and renal tissue pO2 using an integrated approach of parametric magnetic resonance imaging and invasive physiological measurements. Invest Radiol. 2014;49(8):547-560.
6. Pohlmann A, Cantow K, Huelnhagen T, et al. Experimental MRI Monitoring of Renal Blood Volume Fraction Variations En Route to Renal Magnetic Resonance Oximetry. Tomography. 2017;3:188-200.
7. Niendorf T, Seeliger E, Cantow K, Flemming B, Waiczies S, Pohlmann A. Probing renal blood volume with magnetic resonance imaging. Acta Physiol (Oxf). 2020;228(4):e13435.
8. Cantow K, Ladwig-Wiegard M, Flemming B, Pohlmann A, Niendorf T, Seeliger E. Monitoring Renal Hemodynamics and Oxygenation by Invasive Probes: Experimental Protocol. Methods Mol Biol. 2021;2216:327-347.
9. Cantow K, Ladwig-Wiegard M, Flemming B, Fekete A, Hosszu A, Seeliger E. Reversible (Patho)Physiologically Relevant Test Interventions: Rationale and Examples. Methods Mol Biol. 2021;2216:57-73.
10. Gladytz T, Millward JM, Cantow K, et al. Reliable Kidney Size Determination by Magnetic Resonance Imaging in Pathophysiological Settings. Acta Physiol (Oxf). 2021:e13701.
Figures