0474
Dose-dependent effects of S-ketamine on frontal neurometabolism: a 7T functional MRS study1Department of Radiology and Nuclear Medicine, Amsterdam University Medical Centres, University of Amsterdam, Amsterdam, Netherlands, 2Department of Anaesthesiology, Amsterdam University Medical Centers, University of Amsterdam, Amsterdam, Netherlands
Synopsis
The therapeutic antidepressant effect of S-ketamine has been linked to changes in glutamatergic neurotransmission. Here, we investigated the value of dynamic functional MRS compared to static MRS in detecting dose-dependent effects of subanesthetic S-ketamine on glutamate in the anterior cingulate cortex. Although significant dose-dependent subjective dissociative effects of S-ketamine were observed, we did not find significantly different glutamate changes between placebo, low-dose S-ketamine and high-dose S-ketamine, using either a “static” or “dynamic” analysis approach. Nevertheless, exploratory analyses suggest that glutamate might be modulated at specific time-points after S-ketamine administration, illustrating the potential additional information obtained from a dynamic approach.
Introduction
Ketamine is a rapid-acting antidepressant1 that has been approved as pharmacological treatment for patients with treatment-resistant depression. The neural mechanisms underlying the therapeutic response to ketamine have been linked to changes in glutamatergic neurotransmission, particularly in the anterior cingulate cortex (ACC). Using proton magnetic resonance spectroscopy (1H-MRS), changes in glutamate (Glu), glutamine (Gln) and its composite measure Glx have been reported in the ACC following ketamine administration2,3. However, most previous pharmacological 1H-MRS studies employ a “static” approach in analysis, where a single measurement before and after medication is compared to assess changes in neurometabolism. As neurometabolite levels may fluctuate at a second-to-minute timescale4,5,6, additional insights could be obtained by investigating dynamic Glu changes following drug administration. Functional 1H-MRS (fMRS) may serve as a powerful tool to examine these dynamic changes7. To investigate this, we conducted a double-dose placebo-controlled study in which we measured changes in ACC Glu levels following sub-anaesthetic S-ketamine. We hypothesised to observe a dose-dependent increase in ACC Glu, with more sensitive detection employing a dynamic approach compared to a static approach.Methods
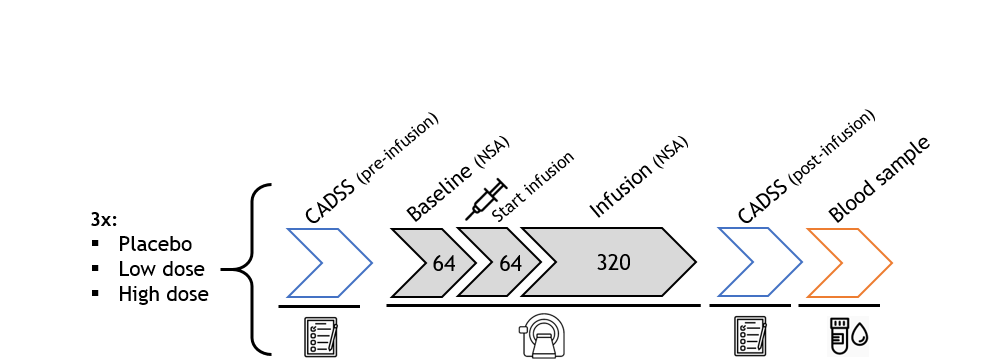
In this preliminary analysis, we included data from thirteen participants (5 females, age: mean±SD=22.08±2.93y, prospective N=30). In a double-dose, counterbalanced, placebo-controlled randomised trial healthy participants received placebo (NaCl), a low subanesthetic dose of S-ketamine (0.11mg/kg+0.1mg/kg/h), or a high subanesthetic dose of S-ketamine (0.22mg/kg+0.2mg/kg/h) intravenously during three experimental sessions (Figure 1).FMRS data were acquired on a 7T MR system (Philips, Best, the Netherlands) with a dual-channel transmit coil and a 32-channel receive coil using a sLASER sequence8 (TR/TE=3500/36ms; bandwidth=3kHz; np=1024; ACC voxel size=30x20x15mm; VAPOR water-suppression), as part of an interleaved sequence (fMRS+fMRI, dynamic scan time=5.1s). At baseline, 64 averages (5.4min) were acquired, followed by medication administration. During continuous infusion of medication, 320 more averages were acquired (27.2min). Before and after scanning, dissociation was measured using the Clinician-Administered Dissociative States Scale (CADSS). A blood sample was obtained after termination of S-ketamine administration and S-ketamine blood plasma concentrations were determined.
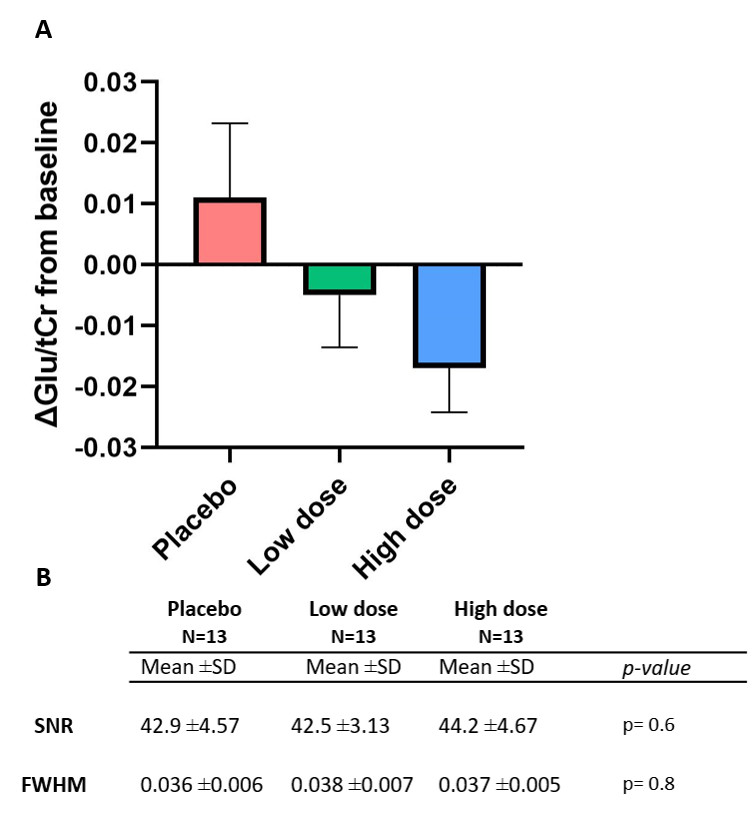
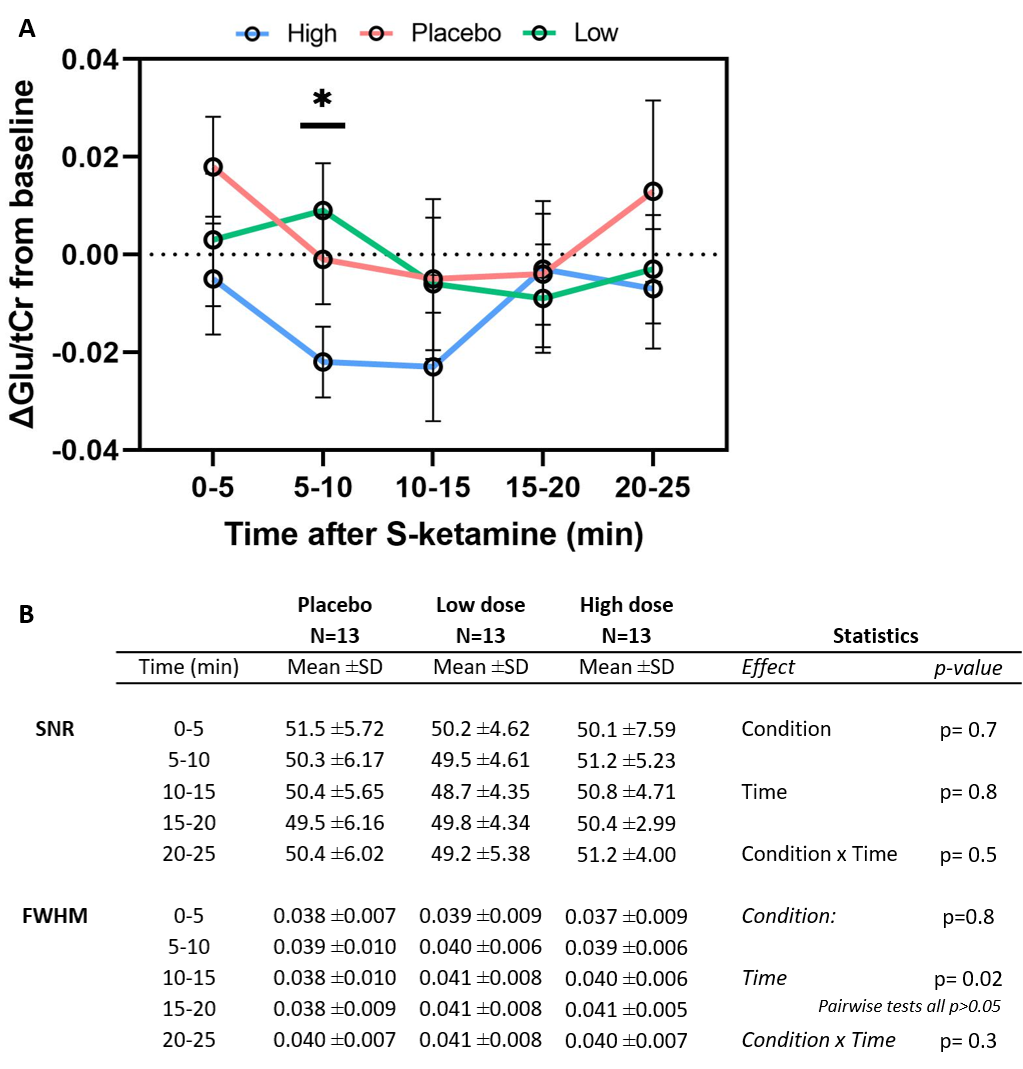
Metabolite spectra were coil-combined, corrected for eddy-currents using unsuppressed water spectra, and spectral registration was performed9. Subsequently, spectra were summed in post-medication blocks of 320 averages (static) or 64 averages (dynamic; Figure 2). Summed spectra per condition were quantified with LCModel10, utilising a basis-set of 19 simulated metabolites and a measured macromolecular baseline. Metabolite concentrations were corrected for partial voluming using tissue volume fractions11 (obtained from T1-weighted anatomical scans) and expressed as ratios to total creatine (tCr). Cramér–Rao lower bounds were used to exclude poor quality spectra (CRLB≥15), and SNR and FWHM were obtained as additional measures of spectral quality.
Change from baseline was calculated by subtraction for both static and dynamic analysis approaches, and fed into repeated measures ANOVA to statistically test dose effects per condition (static) and to assess dose-by-time interaction effects (dynamic) on ΔGlu/tCr.
Results
No spectra were excluded based on CRLB. SNR and FWHM did not differ significantly between conditions in both static and dynamic analyses (p>0.05; Figure 3B+4B). No differences between conditions were observed in baseline Glu/tCr (F(2,36)=0.28,p=0.76). Using the static approach, we found no significant differences in ACC Glu/tCr levels between conditions (F(2,24)=0.57,p=0.58, Figure 3A). Also when using the dynamic approach, no effect of medication (F(2,24)=0.70,p=0.51), time (F(4,48)=1.83,p=0.14) or medication-by-time interaction (F(8,96)=0.82,p=0.59) was found (Figure 4A). However, exploratory pairwise analyses revealed that levels of Glu/tCr differed significantly at 10-15min between low and high dose (p=0.045) and between placebo and high dose (p=0.017).S-ketamine was detected in blood plasma for both low (p=0.002) and high (p=0.002) doses , but the difference between low and high dose did not reach statistical significance (Wilcoxon-signed-rank-test,p=0.28). CADSS difference scores differed significantly between conditions (F(2,3)=13.2,p<0.001), with post-hoc tests revealing differences between the placebo and low (p=0.002), placebo and high (p=0.002) conditions, and between low and high conditions (p=0.007).
Conclusion & Discussion
Contrary to our expectations and prior literature on “static” changes, our preliminary analyses demonstrate no dose-dependent effect of S-ketamine on ACC glutamate for either static or dynamic approach. Nonetheless, exploratory analyses suggest that glutamate might be modulated at specific timepoints after S-ketamine administration, illustrating the potential additional information obtained from a dynamic approach. Surprisingly, a relative decrease in ACC glutamate was observed for a high dose of S-ketamine, which is not in line with our expectations. We observed a dose-dependent effect of S-ketamine on dissociation, which is in line with previous literature12. Ketamine blood plasma levels, however, were too variable to show a dose-dependency in this small sample. Future analyses in a larger sample (N=30) will offer the required statistical power to validate these preliminary analyses.Future analyses will additionally investigate the use of dynamic fitting approaches, as well as differences in glutamine and Glu/Gln-ratio, which may provide a more comprehensive assessment of glutamatergic neurotransmission due to Glu/Gln-cycling.
Acknowledgements
We would like to thank all the participants for their contribution to the project and all students who have aided us in the data collection and analysis.
This study is supported by the Dutch Research Council (NWO Veni: 016.196.153).
References
[1] Berman RM, Cappiello A, Anand A, Oren DA, Heninger GR, Charney DS, Krystal JH. Antidepressant effects of ketamine in depressed patients. Biol Psychiatry. 2000 Feb 15;47(4):351-4. doi: 10.1016/s0006-3223(99)00230-9. PMID: 10686270.
[2] Rowland LM. Subanesthetic ketamine: how it alters physiology and behavior in humans. Aviat Space Environ Med. 2005 Jul;76(7 Suppl):C52-8.
[3] Stone J, Kotoula V, Dietrich C, De Simoni S, Krystal JH, Mehta MA. Perceptual distortions and delusional thinking following ketamine administration are related to increased pharmacological MRI signal changes in the parietal lobe. J Psychopharmacol. 2015 Sep;29(9):1025-8. doi: 10.1177/0269881115592337.
[4] Bednařík P, Tkáč I, Giove F, DiNuzzo M, Deelchand DK, Emir UE, Eberly LE, Mangia S. Neurochemical and BOLD responses during neuronal activation measured in the human visual cortex at 7 Tesla. J Cereb Blood Flow Metab. 2015 Mar 31;35(4):601-10. doi: 10.1038/jcbfm.2014.233.
[5] Ip IB, Emir UE, Parker AJ, Campbell J, Bridge H. Comparison of Neurochemical and BOLD Signal Contrast Response Functions in the Human Visual Cortex. J Neurosci. 2019 Oct 2;39(40):7968-7975. doi: 10.1523/JNEUROSCI.3021-18.2019.
[6] Apšvalka D, Gadie A, Clemence M, Mullins PG. Event-related dynamics of glutamate and BOLD effects measured using functional magnetic resonance spectroscopy (fMRS) at 3T in a repetition suppression paradigm. Neuroimage. 2015 Sep;118:292-300. doi: 10.1016/j.neuroimage.2015.06.015.
[7] Stanley JA, Raz N. Functional Magnetic Resonance Spectroscopy: The "New" MRS for Cognitive Neuroscience and Psychiatry Research. Front Psychiatry. 2018 Mar 12;9:76. doi: 10.3389/fpsyt.2018.00076.
[8] Arteaga de Castro CS, Boer VO, Andreychenko A, Wijnen JP, van der Heide UA, Luijten PR, Klomp DW. Improved efficiency on editing MRS of lactate and γ-aminobutyric acid by inclusion of frequency offset corrected inversion pulses at high fields. NMR Biomed. 2013 Oct;26(10):1213-9. doi: 10.1002/nbm.2937.
[9] Near J, Edden R, Evans CJ, Paquin R, Harris A, Jezzard P. Frequency and phase drift correction of magnetic resonance spectroscopy data by spectral registration in the time domain. Magn Reson Med. 2015 Jan;73(1):44-50. doi: 10.1002/mrm.25094.
[10] Provencher SW. Estimation of metabolite concentrations from localized in vivo proton NMR spectra. Magn Reson Med. 1993 Dec;30(6):672-9. doi: 10.1002/mrm.1910300604.
[11] Gasparovic C, Neeb H, Feis DL, Damaraju E, Chen H, Doty MJ, South DM, Mullins PG, Bockholt HJ, Shah NJ. Quantitative spectroscopic imaging with in situ measurements of tissue water T1, T2, and density. Magn Reson Med. 2009 Sep;62(3):583-90. doi: 10.1002/mrm.22060. PMID: 19526491.
[12] Abdallah CG, De Feyter HM, Averill LA, Jiang L, Averill CL, Chowdhury GMI, Purohit P, de Graaf RA, Esterlis I, Juchem C, Pittman BP, Krystal JH, Rothman DL, Sanacora G, Mason GF. The effects of ketamine on prefrontal glutamate neurotransmission in healthy and depressed subjects. Neuropsychopharmacology. 2018 Sep;43(10):2154-2160. doi: 10.1038/s41386-018-0136-3.
Figures