0473
Tract- and Gray Matter- Based Spatial Statistics Show Microstructural Alterations in Autism Spectrum Disorder
Marissa DiPiero1,2, Hassan Cordash2,3, Molly B. Prigge4, Jace B. King4, Carolyn K. King4, Nicholas Lange5, Erin D. Bigler6,7,8,9, Brandon A. Zielinski4,6,10, Jeffrey Anderson4, Janet E. Lainhart2,11, Andrew Alexander2,11,12, and Douglas C. Dean III2,12,13
1Neuroscience Training Program, University of Wisconsin-Madison, Madison, WI, United States, 2Waisman Center, Madison, WI, United States, 3School of Computer, Data & Information Sciences, University of Wisconsin-Madison, Madison, WI, United States, 4Radiology, University of Utah, Salt Lake City, UT, United States, 5Psychiatry, Harvard School of Medicine, Boston, MA, United States, 6Neurology, University of Utah, Salt Lake City, UT, United States, 7Psychiatry, University of Utah, Salt Lake City, UT, United States, 8Psychology and Neuroscience Center, Brigham Young University, Provo, UT, United States, 9Neurology, University of California-Davis, Davis, CA, United States, 10Pediatrics, University of Utah, Salt Lake City, UT, United States, 11Psychiatry, University of Wisconsin-Madison, Madison, WI, United States, 12Medical Physics, University of Wisconsin-Madison, Madison, WI, United States, 13Pediatrics, University of Wisconsin-Madison, Madison, WI, United States
1Neuroscience Training Program, University of Wisconsin-Madison, Madison, WI, United States, 2Waisman Center, Madison, WI, United States, 3School of Computer, Data & Information Sciences, University of Wisconsin-Madison, Madison, WI, United States, 4Radiology, University of Utah, Salt Lake City, UT, United States, 5Psychiatry, Harvard School of Medicine, Boston, MA, United States, 6Neurology, University of Utah, Salt Lake City, UT, United States, 7Psychiatry, University of Utah, Salt Lake City, UT, United States, 8Psychology and Neuroscience Center, Brigham Young University, Provo, UT, United States, 9Neurology, University of California-Davis, Davis, CA, United States, 10Pediatrics, University of Utah, Salt Lake City, UT, United States, 11Psychiatry, University of Wisconsin-Madison, Madison, WI, United States, 12Medical Physics, University of Wisconsin-Madison, Madison, WI, United States, 13Pediatrics, University of Wisconsin-Madison, Madison, WI, United States
Synopsis
Advanced diffusion MRI techniques, such as Neurite Orientation Dispersion and Density Imaging (NODDI), may be used to improve characterization of gray matter (GM) and white matter (WM) microstructure of the brain. In this work, we used Gray Matter Based Spatial Statistics and Tract Based Spatial Statistics to investigate cortical GM and WM microstructural differences in individuals with autism spectrum disorder (ASD). Group differences and age by group interaction models were assessed. We demonstrate wide-spread alterations in GM and WM microstructure in ASD. Findings provide unique evidence of altered neurodevelopmental processes affecting microstructural development in ASD that persist into adulthood.
Introduction
Autism spectrum disorder (ASD) is a heterogeneous neurodevelopmental disorder characterized by impairments in social interaction and communication, and repetitive and stereotyped behaviors1. Identification and characterization of neuroanatomical and microstructural differences of ASD are imperative to advance our understanding of the neural supports underlying clinical characteristics of ASD and ultimately aid in development of targeted interventions. Previous studies have described reduced gray matter (GM) volume in brain regions supporting social cognition in individuals with ASD2,3, while diffusion MRI studies have reported widespread white matter (WM) microstructural alterations that may underlie observed cognitive and behavioral deficits in ASD4–7. As such, alterations in both cortical organization and brain connectivity are theorized to support the core symptoms of ASD8,9. Recent methodological advancements have made it possible to utilize diffusion MRI methods, such as the Neurite Orientation Dispersion and Density Imaging (NODDI)10 model to examine the cortical GM microstructure. In the current study, we implemented Tract Based Spatial Statistics (TBSS)11 and Gray-Matter Based Spatial Statistics (GBSS)12,13 to examine and characterize whole brain white and gray matter microstructure and assess differences in individuals with and without ASD.Methods
Multi-shell diffusion weighted imaging (DWI) data were obtained from 80 typically developing control (TDC) males and 78 males with ASD between the ages of 12 and 46 years old. The DWI protocol was acquired with b-values of 350, 1000, 2000, and 3000 s/mm2 at 187 non-collinear diffusion encoding directions on a 3.0 Tesla Siemens Prisma. DWI images were corrected for eddy-current distortions and head motion14 and fit to the DTI and NODDI models, yielding parameter maps of fractional anisotropy FA, mean, radial, and axial diffusivities (MD, RD, AD), intracellular and isotropic volume fractions (νIC/FICVF, νISO), and orientation dispersion index (ODI). Using FSL tract-based spatial statistic (TBSS) tools11 for WM and gray matter based spatial statistic (GBSS) tools12 for GM, each subject’s DTI and NODDI metrics were projected onto the WM (Fig. 1A) and GM (Fig. 1B) skeletons. Linear and logarithmic age models were examined and the Bayesian information criterion was used to determine the more appropriate model in GM and WM for each DWI measure. Statistical analyses used general linear models to investigate ASD vs. TDC group differences, while age-by-group interactions were also assessed to investigate age-related group differences. Non-parametric permutation testing was carried out using Permutation Analysis of Linear Models (PALM)15,16 and threshold free cluster enhancement17 were used to identify significant regions at p < 0.05, FWER-corrected within modality and contrast. To help identify significant brain regions, statistical maps for were coregistered to the Harvard-Oxford18 and Talairach19 atlases for GM and WM, respectively.Results
Group comparisons revealed significant differences in GM and WM regions between ASD and TDC groups. Significant group differences of WM microstructure were observed across all DWI measures (Fig. 2 & Fig. 3), whereas significant group differences of GM microstructure were only found on ODI and FA (Fig. 4). Significant WM microstructural alterations of ASD identified with TBSS span the major WM tracts across bilateral frontal, temporal, parietal, and occipital lobes, as well as white matter of the brainstem. Further, hemispheric differences were noted in both GM and WM regions between groups. GBSS analysis revealed cortical GM alterations in frontal, temporal, and occipital brain areas. Interestingly, the ASD group demonstrated lower neurite density in WM tracts, and higher neurite dispersion in both GM and WM regions. No significant age-by-group interactions were noted for any DWI measure in GM or WM.Discussion
Our findings highlight significant group differences of global WM and cortical GM microstructure in adolescent-to-adult individuals with and without ASD. We report widespread microstructural alterations across major WM tracts of the brain and within cortical GM microstructure, noting areas of interhemispheric differences between groups. The presence of hemispheric differences observed between groups in GM and WM may provide additional evidence of altered structural brain asymmetry often reported in ASD20. Furthermore, the presence of significant group differences across GM and WM regions without a significant age-by-group interaction may be indicative of alterations in the developmental processes occurring prior to 12 years of age, such as the development of cortical microstructure and establishment of WM pathways, and may provide additional support for the reported aberrant trajectory of brain development in ASD denoted by early and rapid maturation, followed by attenuated development in childhood and adolescence21–23. Further, the specific WM and GM regions in which microstructural differences were detected support many cognitive, sensory, social, and emotional, processes. Deficits of such abilities are often observed in ASD. Findings provide evidence of altered WM and GM microstructure across the whole brain in individuals with ASD.Conclusion
GM and WM microstructure play an important role in overall brain function and connectivity. Using advanced diffusion MRI acquisition, GBSS, and TBSS, our findings provide new insights into group differences of the GM and WM microstructure in individuals with ASD. Increased evidence of where and when these microstructural differences arise can contribute to our current understanding of brain-behavior relationships in ASD and may ultimately aid in the development of individualized interventions and therapeutics.Acknowledgements
We sincerely thank our research participants and their families who participated in this research as well as the dedicated research staff who made this work possible. This work was supported by the National Institute of Mental Health, National Institutes of Health, through grant R01MH080826 (Dr. Lainhart and Dr. Anderson).References
1. American Psychiatric Association Edition. Diagnostic and statistical manual of mental disorders: DSM-5.(American Psychiatric Association, 2013).2. Greimel, E. et al. Changes in grey matter development in autism spectrum disorder. Brain Struct. Funct. 218, 929–942 (2013).
3. Sato, W. et al. Reduced Gray Matter Volume in the Social Brain Network in Adults with Autism Spectrum Disorder. Front. Hum. Neurosci. 11, 395 (2017).
4. Dean, D. C. et al. Investigating the Microstructural Correlation of White Matter in Autism Spectrum Disorder. Brain Connect. 6, 415–433 (2016).
5. Vogan, V. M. et al. Widespread White Matter Differences in Children and Adolescents with Autism Spectrum Disorder. J. Autism Dev. Disord. 46, 2138–2147 (2016).
6. Fitzgerald, J. Widespread Disrupted White Matter Microstructure in Autism Spectrum Disorders. J Autism Dev Disord 11 (2019).
7. Thompson, A. et al. Age-related differences in white matter diffusion measures in autism spectrum condition. Mol. Autism 11, 36 (2020).
8. Andica, C. et al. Neurite orientation dispersion and density imaging reveals white matter microstructural alterations in adults with autism. Mol. Autism 12, 48 (2021).
9. Andrews, D. S. et al. A diffusion-weighted imaging tract-based spatial statistics study of autism spectrum disorder in preschool-aged children. J. Neurodev. Disord. 11, 32 (2019).
10. Zhang, H., Schneider, T., Wheeler-Kingshott, C. A. & Alexander, D. C. NODDI: Practical in vivo neurite orientation dispersion and density imaging of the human brain. NeuroImage 61, 1000–1016 (2012).
11. Smith, S. M. et al. Tract-based spatial statistics: Voxelwise analysis of multi-subject diffusion data. NeuroImage31, 1487–1505 (2006).
12. Nazeri, A. et al. Functional Consequences of Neurite Orientation Dispersion and Density in Humans across the Adult Lifespan. J. Neurosci. 35, 1753–1762 (2015).
13. Nazeri, A. et al. Gray Matter Neuritic Microstructure Deficits in Schizophrenia and Bipolar Disorder. Biol. Psychiatry 82, 726–736 (2017).
14. Andersson, J. L. R. & Sotiropoulos, S. N. An integrated approach to correction for off-resonance effects and subject movement in diffusion MR imaging. 16 (2016).
15. Winkler, A. M., Ridgway, G. R., Webster, M. A., Smith, S. M. & Nichols, T. E. Permutation inference for the general linear model. NeuroImage 92, 381–397 (2014).
16. Winkler, A. M. et al. Non-parametric combination and related permutation tests for neuroimaging: NPC and Related Permutation Tests for Neuroimaging. Hum. Brain Mapp. 37, 1486–1511 (2016).
17. Smith, S. & Nichols, T. Threshold-free cluster enhancement: Addressing problems of smoothing, threshold dependence and localisation in cluster inference. NeuroImage 44, 83–98 (2009).
18. Makris, N. et al. Decreased volume of left and total anterior insular lobule in schizophrenia. Schizophr. Res. 83, 155–171 (2006).
19. Lancaster, J. L. et al. Automated Talairach Atlas labels for functional brain mapping. Hum. Brain Mapp. 10, 120–131 (2000).
20. Postema, M. C. et al. Altered structural brain asymmetry in autism spectrum disorder in a study of 54 datasets. Nat. Commun. 10, 4958 (2019).
21. Hazlett, H. C. et al. Early Brain Overgrowth in Autism Associated With an Increase in Cortical Surface Area Before Age 2 Years. ARCH GEN PSYCHIATRY 68, 10 (2011).
22. Courchesne, E. Abnormal early brain development in autism. Mol. Psychiatry 7, S21–S23 (2002).
23. Edgar, J. C. et al. Abnormal maturation of the resting‐state peak alpha frequency in children with autism spectrum disorder. Hum. Brain Mapp. 40, 3288–3298 (2019).
Figures
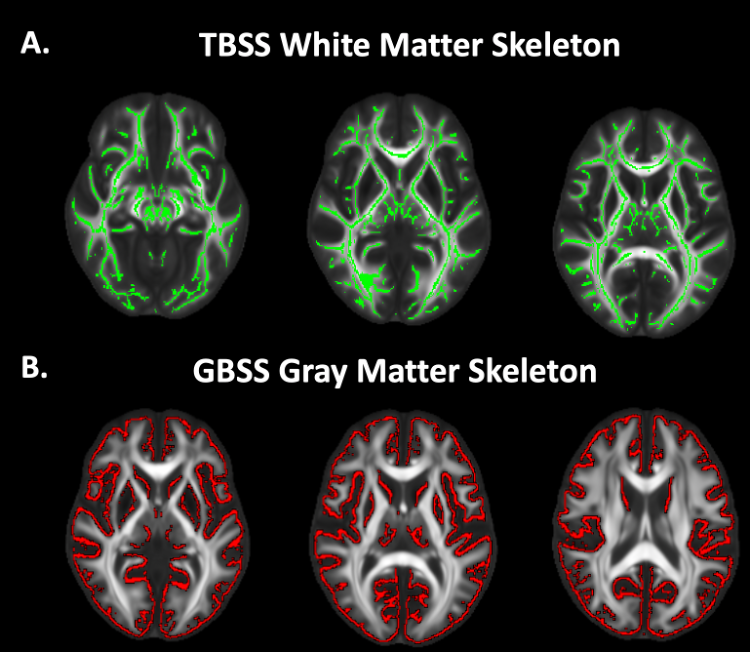
Figure 1. TBSS and GBSS Skeletons projected on study-specific template. A. FA maps were averaged across subjects and thinned to create a mean FA TBSS skeleton (green). Each subject's DWI metrics were then projected onto this skeleton. B. GM fraction maps were first averaged across subjects and the mean GM image was skeletonized to yield the GBSS skeleton (red). All DWI metrics were projected onto the skeleton from the local GM fraction maxima.

Figure 2: TBSS: DTI Group Differences. Significant voxels displayed on the neuroanatomical maps; color bar indicates level of significance (B, D, F, H). A. Scatter plot representing mean FA values of significant voxels. C. Scatter plot representing MD values of significant voxels. E. Scatter plot representing mean RD values of significant voxels. G. Scatter plot representing mean AD values of significant voxels.
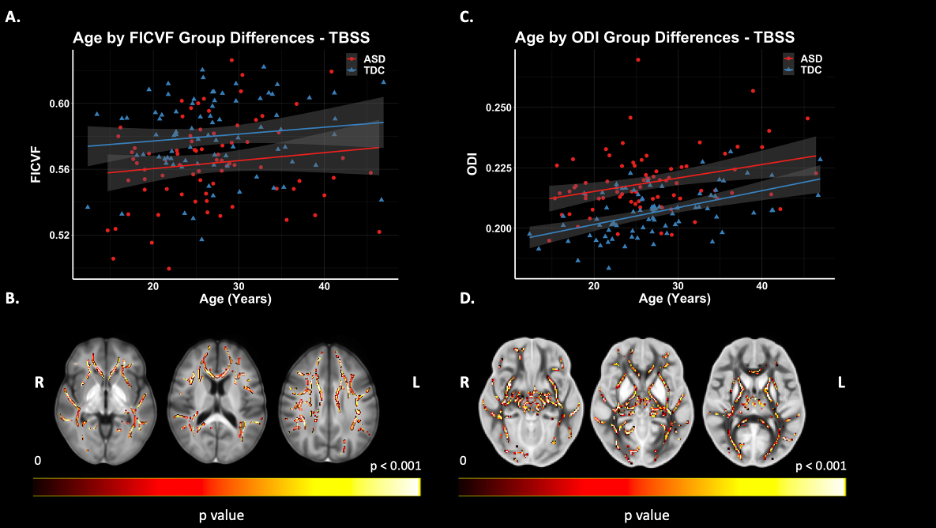
Figure 3. TBSS: NODDI Group Differences. Significant voxels displayed on the neuroanatomical maps; color bar indicates level of significance (B & D). A. Scatter plot representing mean values FICVF of significant voxels. B. Scatter plot representing mean values ODI of significant voxels.
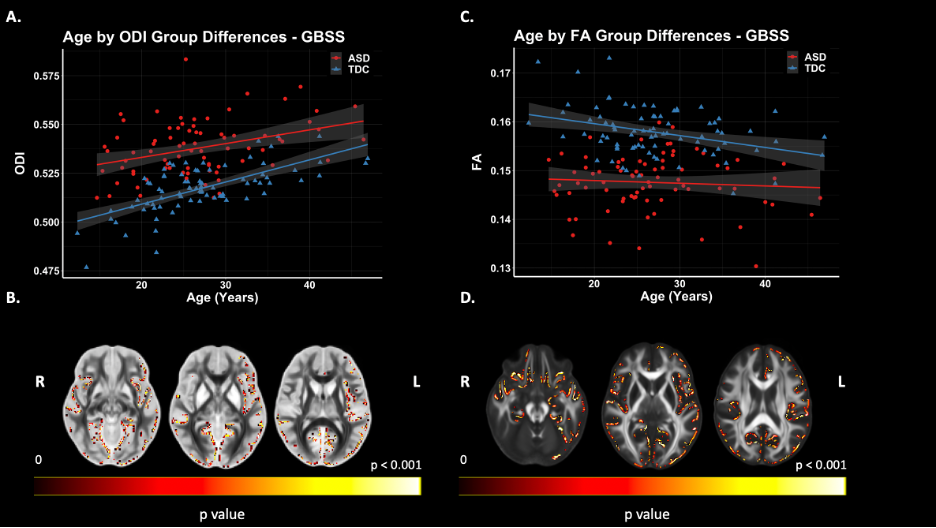
Figure 4. GBSS Group Differences. Significant voxels displayed on the neuroanatomical maps; color bar indicates level of significance (B & D). A. Scatter plot representing mean values ODI of significant voxels. B. Scatter plot representing mean values FA of significant voxels.
DOI: https://doi.org/10.58530/2022/0473