0471
Hypothalamic subnuclei segmentation and diffusion tractography in Major Depressive Disorder at 7T1Biomedical Engineering and Imaging Institute, Icahn School of Medicine at Mount Sinai, New York, NY, United States, 2Icahn School of Medicine, Graduate School of Biomedical Sciences, New York, NY, United States, 3Diagnostic, Molecular and Interventional Radiology, Icahn School of Medicine at Mount Sinai, New York, NY, United States, 4Psychiatry, Icahn School of Medicine at Mount Sinai, New York, NY, United States
Synopsis
We performed a novel 7T analysis of volumetric, microstructural and tractographic measures in the hypothalamus in MDD and matched controls. We uncovered significant differences in FA from left anterior superior and left tubular inferior, and discovered correlations between these regions and clinical measures of depression and anxiety. These findings warrant further investigations of microstructural integrity within the hypothalamus in patients with MDD and provide a basis for exploration of microstructural integrity within other neuropsychiatric disorders characterized by dysregulated mood and anxiety.
Introduction
The hypothalamus, situated along the inferior margins of the third ventricle, is composed of small subnuclei which contribute to the regulation of numerous autonomic functions, as well as mood and stress response. As such, it has been an ongoing area of interest in understanding the pathophysiology of Major Depressive Disorder (MDD). The paraventricular nucleus (PVN) may particularly play a significant role in the behavioral manifestations in MDD as an upstream regulator of the Hypothalamus-Pituitary-Adrenal (HPA) Axis, a major regulator of the stress response. Due to its size, proximity to sinuses, inhomogeneity, and signal dropout, visualization and manual segmentation of the whole hypothalamus and individual subnuclei has been difficult to achieve. Leveraging of increased signal-to-noise ratio and improved soft-tissue contrast afforded by ultra-high field (UHF) MRI may provide the increased sensitivity needed to identify subtle structural differences in the hypothalamus in MDD compared to controls. The combination of UHF MRI and deep neural network-based segmentation (using FreeSurfer7.2) offers the ability to segment hypothalamic subnuclei with higher accuracy and precision than manual tracing. Hypothalamic segmentations can be used for high-resolution diffusion tractographic analysis that also investigates tissue properties and microstructural integrity. We use UHF MRI, hypothalamic segmentation, and MRtrix to compute volumetric, microstructural, and tractograpic metrics from hypothalamic subnuclei in a large sample of patients with MDD and matched controls, to explore relationships with clinical measures of MDD.Methods
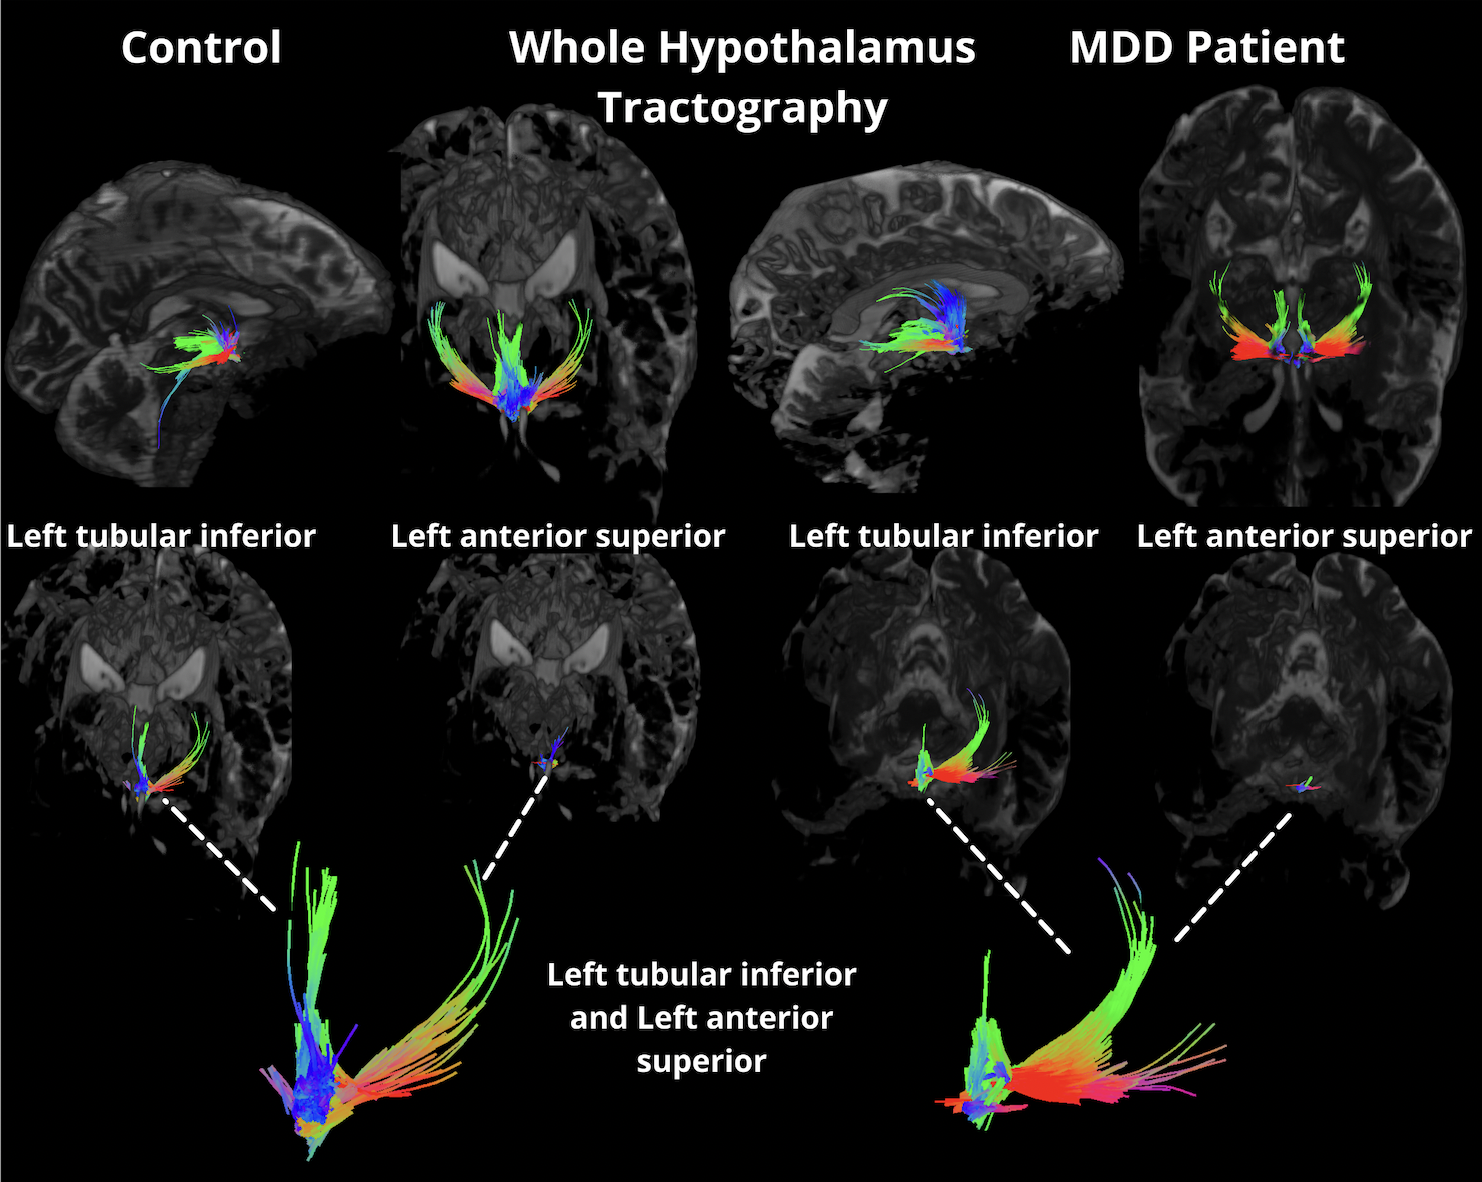
Forty unmedicated patients (18 females and 22 males, mean age = 37.8y) with a primary diagnosis of MDD and free from medication, and without diagnosis of other obsessive compulsive disorder, bipolar disorder, substance abuse disorder, or neurological disease, were age- and sex-matched with healthy controls (18 females and 26 males, mean age of 36.9y) without current or lifetime history of neurological or psychiatric disorder. Each subject underwent a 7T MRI scan which included a T1-weighted MP2RAGE sequence (TR = 6000ms, TE = 3.62ms, FOV = 240mm × 320mm, resolution = 0.7mm isotropic) and a high-angular-resolved diffusion-weighted imaging MRI dMRI sequence (b = 1500 s/mm2, TR = 7200ms, TE = 67.6ms, FOV = 210x210mm, resolution = 1.05mm isotropic, 64 directions, and 5 b0 acquisitions). The DMRI series in both anterior-to-posterior and posterior-to-anterior directions were collated into a single volume which was denoised and corrected for eddy current distortions, motion, and B1 inhomogeneity using MRtrix3. FreeSurfer7.2 was used with the MP2RAGE image to segment the hypothalamus, including the following subnuclei: anterior inferior, anterior superior, posterior, inferior tubular, and superior tubular (Figure 1). All images were appropriately coregistered into diffusion space using SPM12. MRtrix3 was used to generate tractography from the hypothalamus to whole brain using SIFT2 and tcksample with 1000 seeds per voxel (Figure 2). Statistical analysis was performed using MatLab 2021b (The Mathworks, Inc, Natick, MA) and R. Fractional Anisotropy (FA), tract count (streamline count), and volume for each subnucleus were tested for outliers, and normality was determined using Shapiro Wilks Testing. Student’s t-test and independent Wilcoxon Sign Rank were used for normally and non-normally distributed data, respectively, to determine differences between groups. Multiple linear regression was used to assess between-group differences while controlling for age and sex. Volumes from each subnuclei, left, right, and whole hypothalamus were correlated with dimensional measures of anhedonic depression and anxious arousal using the Mood and Anxiety Symptoms Questionnaire (MASQ).Results
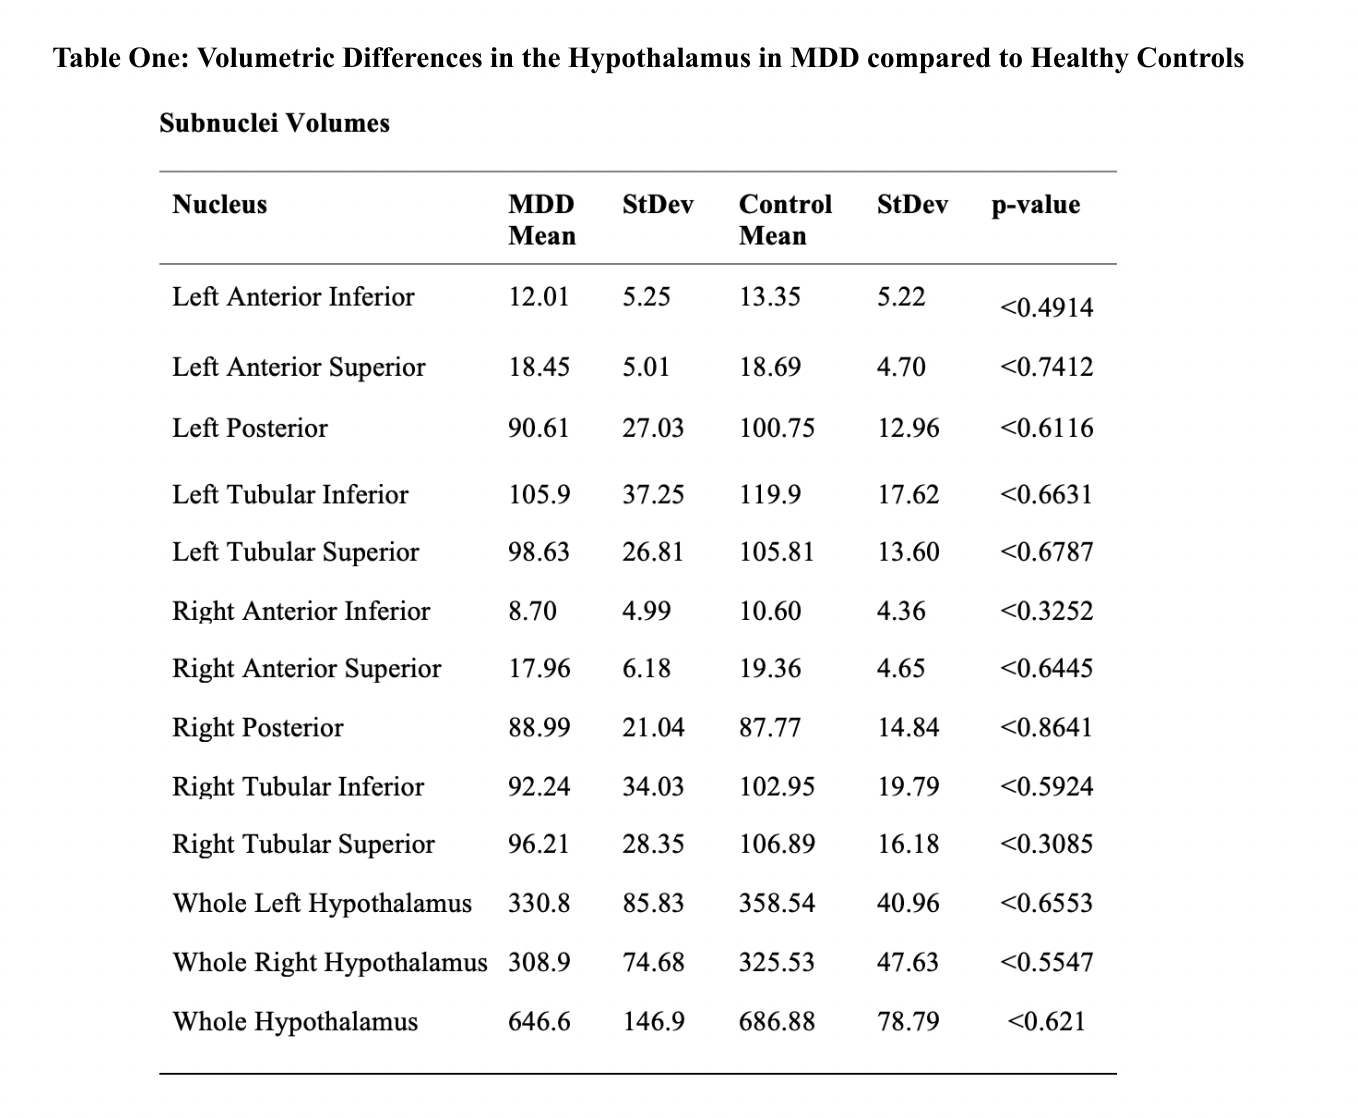
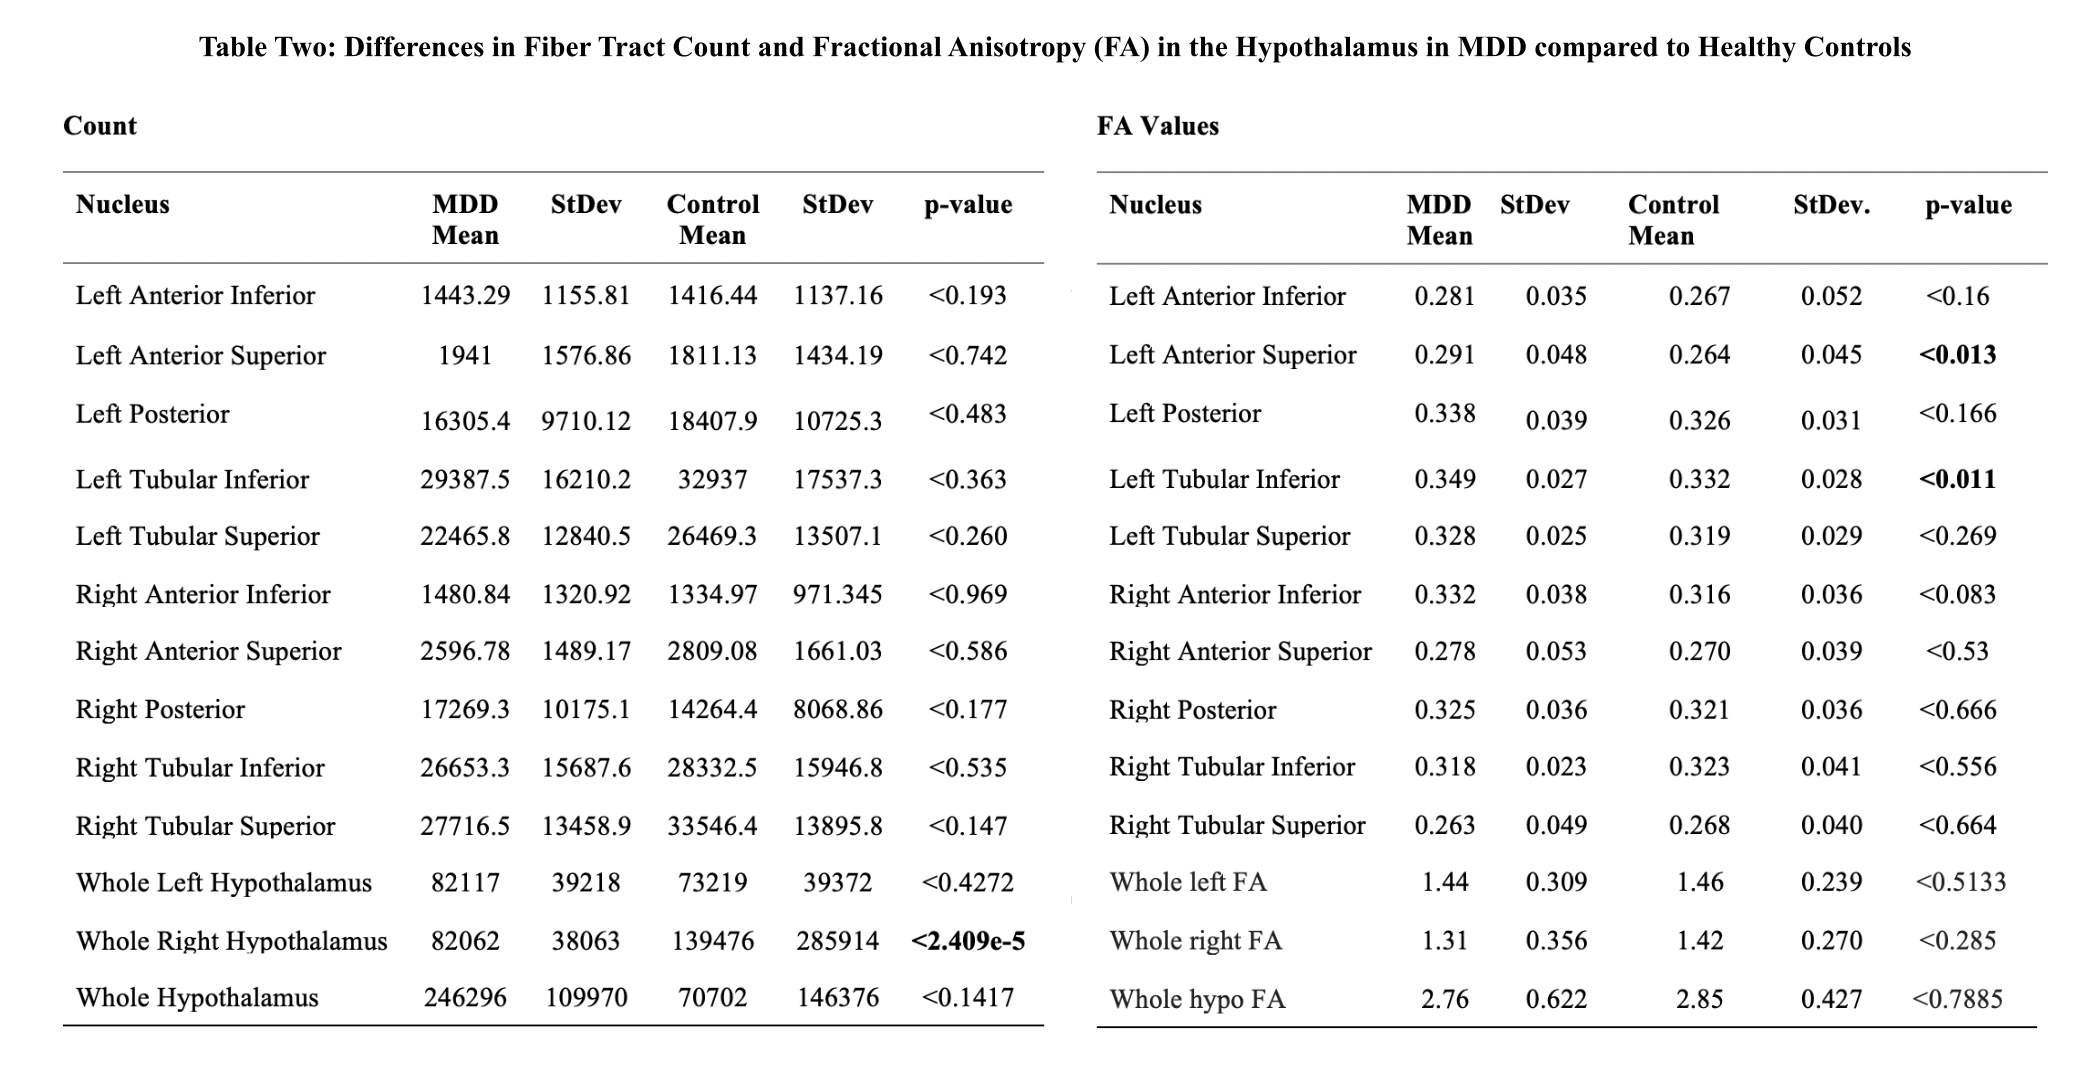
When assessing differences in volumes, there were no significant differences between control and MDD groups (Table 1). FA values from left anterior superior (p<0.013) and left tubular inferior nucleus (p<0.011) were higher in MDD compared to controls. Tract count for right hypothalamus was lower in MDD compared to controls (Table 2 and Figure 2). Within the MDD group there was a significant positive correlation between MASQ anhedonic depression score and volumes of left anterior inferior (CI= 0.398, p>0.024), left anterior superior(CI= 0.37, p>0.039), and whole right hypothalamus (CI= 0.362, p>0.039). We found a negative correlation between MASQ anxious arousal score and volume of whole right hypothalamus (CI= -0.366, p>0.036) in MDD patients.Discussion
Here we performed the first 7T analysis of volumetric, microstructural, and tractographic measures in the hypothalamus in MDD and matched controls. We found significant differences in the FA in left anterior superior and left tubular inferior nucleus indicative of microstructural differences between groups. These specific subnuclei correspond with regions containing the PVN and supraoptic nucleus, two regions linked to regulation of mood, stress responses, and heavily cited as regions of interest in MDD. There were also correlations between these regions and clinical measures of depression and anxiety. This warrants further investigation of microstructural integrity within the hypothalamus in patients with MDD and other neuropsychiatric disorders characterized by dysregulated mood and anxiety.Conclusion
We have shown that 7T MRI can be used to segment small structures within the brain and detect differences within an elusive psychiatric group. We found significant microstructural differences in regions associated with subtle behavioral manifestations of MDD.Acknowledgements
Laurel Morris and Priti Balchandani jointly contributed to this work and are co-last authors.
The authors would like to acknowledge funding from NIH R01 MH109544.
References
1.Otte, C., Gold, S. M., Penninx, B. W., Pariante, C. M., Etkin, A., Fava, M., ... & Schatzberg, A. F. (2016). Major depressive disorder. Nature reviews Disease primers, 2(1), 1-20.
2. Herman, J. P., McKlveen, J. M., Ghosal, S., Kopp, B., Wulsin, A., Makinson, R., ... & Myers, B. (2016). Regulation of the hypothalamic-pituitary-adrenocortical stress response. Comprehensive Physiology, 6(2), 603.Automated segmentation of the hypothalamus and associated subunits in brain MRI.
3.Billot, B., Bocchetta, M., Todd, E., Dalca, A.V., Rohrer, J.D., Iglesias, J.E. Neuroimage (in press).
4.Jenkinson, M., Beckmann, C. F., Behrens, T. E., Woolrich, M. W., & Smith, S. M. (2012).
5.Fsl. Neuroimage, 62(2), 782-790.Penny, W. D., Friston, K. J., Ashburner, J. T., Kiebel, S. J., & Nichols, T. E. (Eds.). (2011).
6.Statistical parametric mapping: the analysis of functional brain images. Elsevier.Tournier, J. D., Smith, R., Raffelt, D., Tabbara, R., Dhollander, T., Pietsch, M., ... & Connelly, A. (2019).
7.MRtrix3: A fast, flexible and open software framework for medical image processing and visualisation. Neuroimage, 202, 116137.
Figures
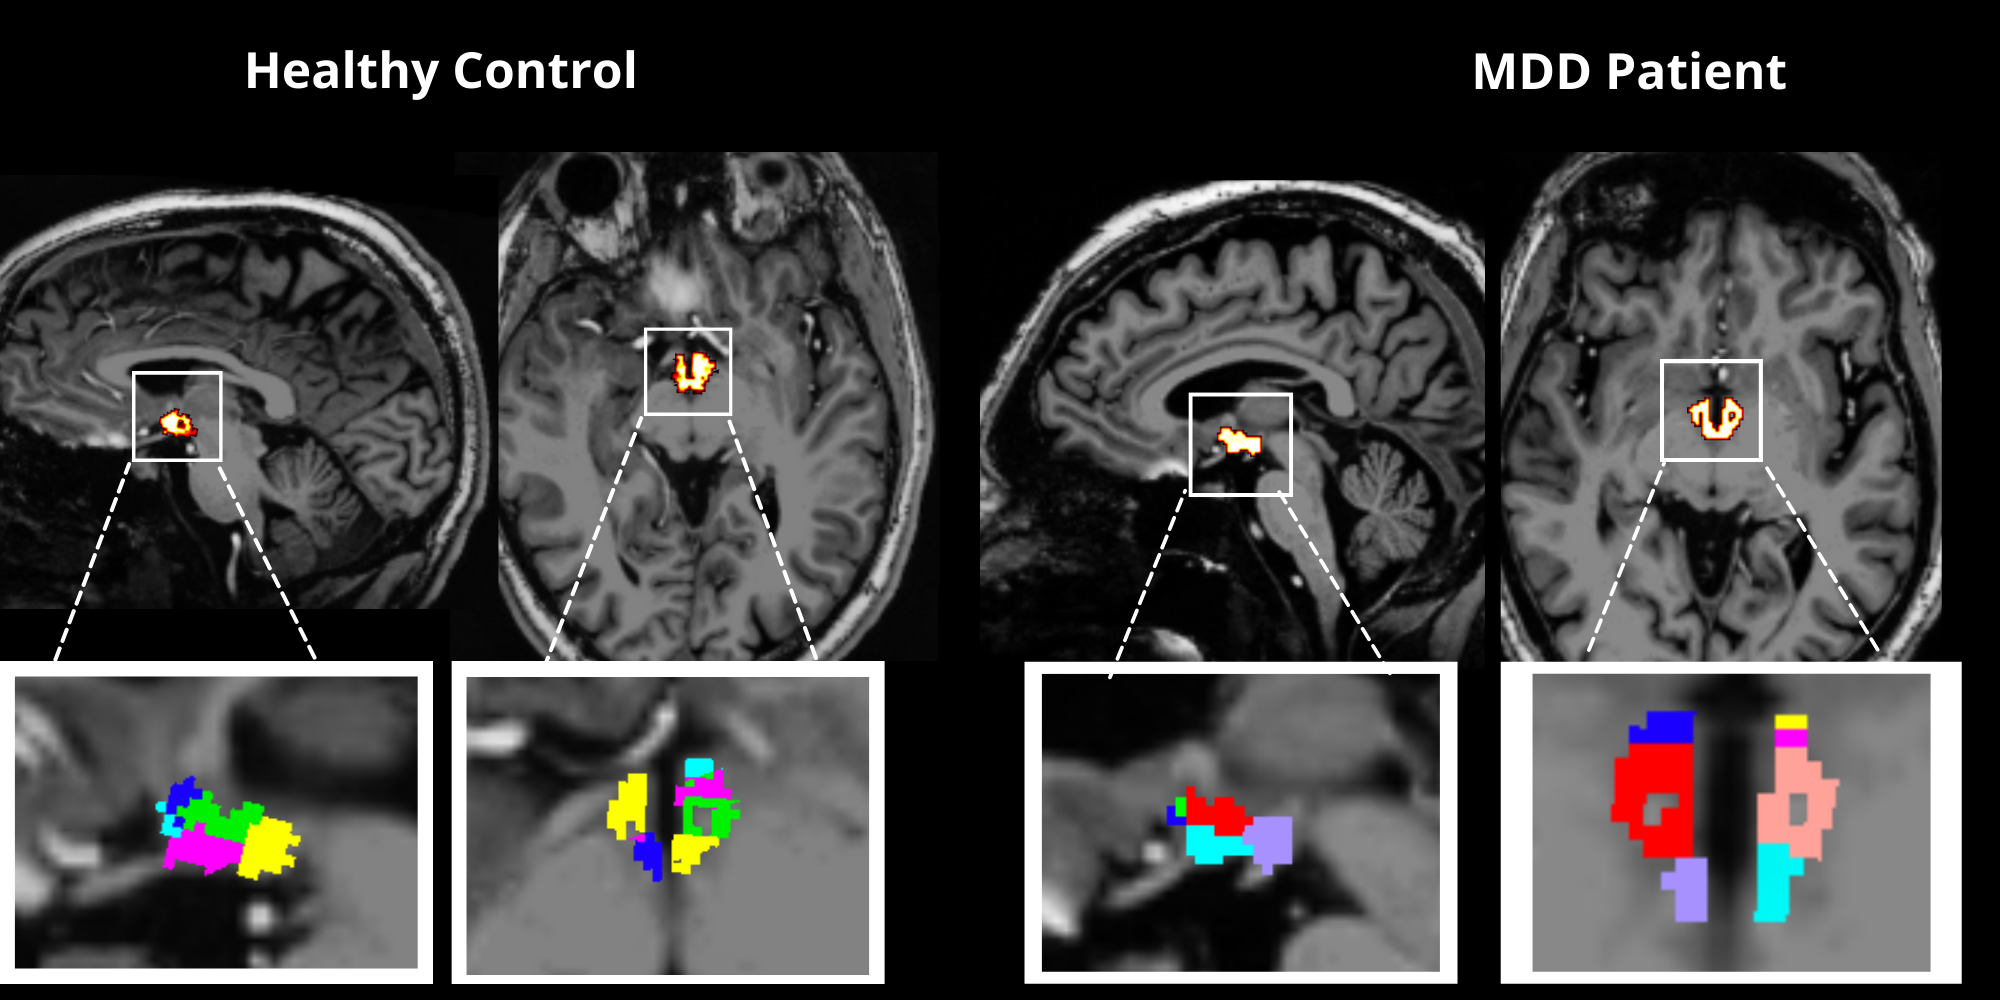
Figure One. Segmentation of the whole hypothalamus was generated using FreeSurfer7.2 with the MP2RAGE image. Here we show the segmentation of the whole hypothalamus in the sagittal and axial view in both controls and MDD. Through this tool, we segmented individual subnuclei including the anterior inferior, anterior superior, posterior, inferior tubular, and superior tubular, as shown above.