0469
Gray and white matter structural examination for diagnosis of MDD and StD in adolescents and young adults: a preliminary radiomics analysis1Department of Radiology, The Third Affiliated Hospital of Kunming Medical University, Kunming, Yunnan Province, China, 2Department of Psychiatry, The Second Affiliated Hospital of Kunming Medical University, Kunming, Yunnan Province, China, 3Clinical Science, Philips Healthcare, Chengdu, China, Chengdu, China
Synopsis
We obtained sMRI data from unmedicated adolescents and young adults with MDD, StD and well-matched healthy control subjects, and identified radiomics features from gray and white matter, and establish classification models. The accuracies and AUC were 86.75%, 0.93 for distinguishing MDD from HC, 70.51%, 0.69 for discriminating StD from HC, and 59.15%, 0.66 for differentiating MDD from StD, respectively. These findings provide preliminary evidence that radiomics features of brain structure are valid for discriminating MDD and StD from HCs. The MRI-based radiomics approach, with further improvement and validation, is a potential facilitating method to clinical diagnosis of mental illness.
Background
Previous evidence of conventional MRI studies suggested the presence of neuroanatomical abnormalities in depression. However, the brain structural relationship between major depressive disorder (MDD) and subthreshold depression (StD) remains unclear. Radiomics is an emerging image analysis framework that provides more details than conventional methods. In present study, we aimed to identify structural radiomics features of gray matter (GM) and white matter (WM), and to develop and validate the classification model for MDD and StD diagnosis using radiomics analysis.Materials and Methods
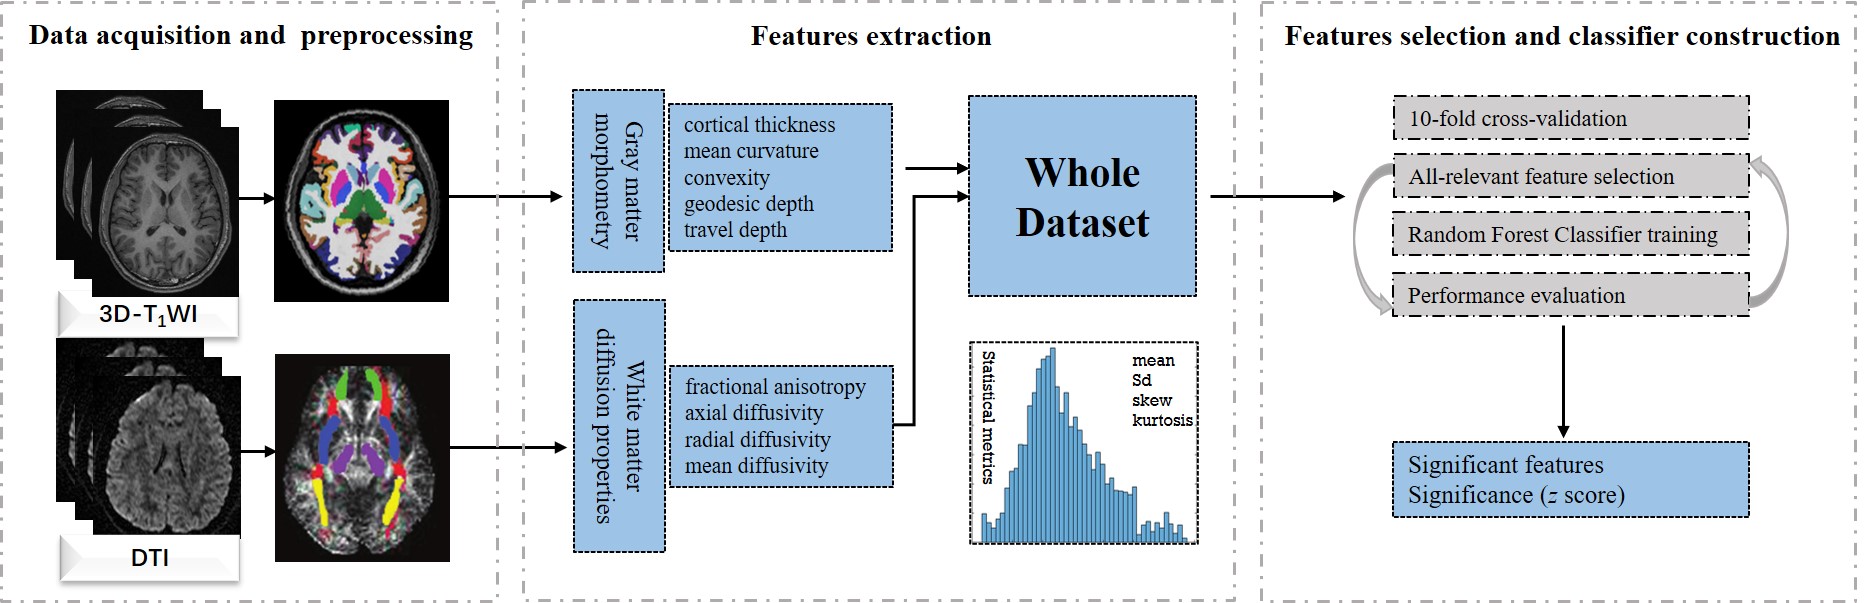
A consecutive cohort of 142 adolescents and young adults, including 43 cases with MDD, 49 cases with StD and 50 healthy controls (HC), were recruited and underwent the three-dimensional T1 weighted imaging (3D-T1WI) and diffusion tensor imaging (DTI). We extracted radiomics features representing the shape and diffusion properties of GM and WM from all participants. Then, an all-relevant feature selection process embedded in a 10-fold cross-validation framework was used to identify features with significant power for discrimination. Random forest classifiers (RFC) were established and evaluated successively using identified features.Results
The results showed that a total of 3030 features were extracted after preprocessing, including 2262 shape-related features from each T1-weighted image representing GM morphometry and 768 features from each DTI representing the diffusion properties of WM. 25 features were selected ultimately, including ten features for MDD versus HC, eight features for StD versus HC, and seven features for MDD versus StD. The accuracies and area under curve (AUC) the RFC achieved were 86.75%, 0.93 for distinguishing MDD from HC with significant radiomics features located in the left medial orbitofrontal cortex, right superior and middle temporal regions, right anterior cingulate, left cuneus and hippocampus, 70.51%, 0.69 for discriminating StD from HC within left cuneus, medial orbitofrontal cortex, cerebellar vermis, hippocampus, anterior cingulate and amygdala, right superior and middle temporal regions, and 59.15%, 0.66 for differentiating MDD from StD within left medial orbitofrontal cortex, middle temporal and cuneus, right superior frontal, superior temporal regions and hippocampus, anterior cingulate, respectively.Discussion
Based on radiomics analysis, the major finding of this study indicated that the radiomic-based classifiers could provide moderate diagnostic value by using cerebral sMRI features in discriminating MDD or StD from healthy controls, especially in distinguishing MDD from healthy controls with excellent classification accuracy. The majority of gray matter morphometry alteration that contributed to the discrimination was located within left medial orbitofrontal lobe, right superior frontal gyrus, right superior and middle temporal regions, bilateral anterior cingulate and hippocampus, left cuneus, amygdala, and cerebellar vermis. Our results are consistent with the previous MRI findings based on traditional data analysis 1, 2, 3. In our study, the AUC and accuracy the classifier achieved were 0.93 and 86.75% respectively in classification of MDD and normal controls, which show the better classification performance than voxel-based morphometry 4, 5, 6, 3. This also suggested that structural changes of medial orbitofrontal cortex, temporal lobe, hippocampus, and anterior cingulate gyrus could be potential imaging features for quantitative diagnosis of MDD patients.Our results revealed all three brain regions including medial orbitofrontal cortex, superior temporal regions and anterior cingulate were identified to be significantly different among the HC versus StD and StD versus MDD. Previous neuroimaging studies have also showed that patients with MDD and StD had relatively smaller GM volume in the temporal gyrus and orbitofrontal cortex than healthy controls, and the decreasing degree of StD subjects was less than that in the patients with MDD 7, 8. These finding suggested that pathophysiological trajectory process in these gyri might be involved in the transformation of brain structures from HC to StD and to MDD which seems like a continuous spectrum of what is happening in the brain structure, and depressive disorders should be better treated as a spectrum disorder 8.
DTI characterizes the alterations in WM microstructural properties that cannot be measured using conventional anatomical MRI in vivo. Subtle, but widespread abnormalities of WM in MDD patients were found within the corpus callosum, corona radiata, cingulum, internal capsule, fronto-occipital fasciculus, and fornix. Furthermore, it seems that WM microstructural changes were more common in adult MDD patients with an age of onset over 21 years and more than one episode of MDD 9, 10. However, previous results have been inconsistent in the pattern of deficits, and the degree of disruption across studies 9, 11, 12. Unfortunately, no significant WM radiomics features were found in our study contributed to discriminating MDD and StD from controls. Therefore, we need to increase the sample size for further research.
Conclusion
In general, this study presented a radiomic approach using structural radiomics features derived from gray and white matter to discriminate MDD and StD individuals from healthy controls in adolescents and young adults. Our preliminary results show that the MRI-based radiomics analysis, with further improvement and validation, is a potential facilitating method to clinical diagnosis of mental illness.Acknowledgements
No acknowledgement found.References
1. Van Eijndhoven, P., Mulders, P., Kwekkeboom, L., et al. 2016. Bilateral ECT induces bilateral increases in regional cortical thickness. Transl. Psychiatry 6(8), e874.
2. Zorlu, N., Cropley, V. L., Zorlu, P. K., et al. 2017. Effects of cigarette smoking on cortical thickness in major depressive disorder. J. Psychiatr. Res. 84, 1–8.
3. Nguyen, K. P., Fatt, C. C., Treacher, A., et al. 2019. Predicting response to the antidepressant bupropion using pretreatment fMRI. Predict. Intell. Medi. 11843, 53–62.
4. Liao, Y., Huang, X., Wu, Q., et al. 2013. Is depression a disconnection syndrome? meta-analysis of diffusion tensor imaging studies in patients with MDD. J. Psychiatry Neurosci. 38(1), 49–56.
5. Foland-Ross, L. C., Sacchet, M. D., Prasad, G., et al. 2015. Cortical thickness predicts the first onset of major depression in adolescence. Int. J. Dev. Neurosci. 46, 125–131.
6. Sankar, A., Zhang, T., Gaonkar, B., et al. 2016. Diagnostic potential of structural neuroimaging for depression from a multi-ethnic community sample. BJPsych open 2(4), 247–254.
7. Schmaal, L., Hibar, D. P., Sämann, P. G., et al. 2017. Cortical abnormalities in adults and adolescents with major depression based on brain scans from 20 cohorts worldwide in the ENIGMA Major Depressive Disorder Working Group. Mol. Psychiatry 22(6), 900–909.
8. Zhang, T., Zhao, B., Shi, C., et al. 2020. Subthreshold depression may exist on a spectrum with major depressive disorder: evidence from gray matter volume and morphological brain network. J. Affect. Disord. 266, 243–251.
9. Westlye, L. T., Walhovd, K. B., Dale, A. M., et al. 2010. Life-span changes of the human brain white matter: diffusion tensor imaging (DTI) and volumetry. Cerebral cortex 20(9), 2055–2068.
10. Van Velzen, L. S., Kelly, S., Isaev, D., et al. 2020. White matter disturbances in major depressive disorder: a coordinated analysis across 20 international cohorts in the ENIGMA MDD working group. Mol. Psychiatry 25(7), 1511–1525.
11. Ota, M., Noda, T., Sato, N., et al. 2015. White matter abnormalities in major depressive disorder with melancholic and atypical features: a diffusion tensor imaging study. Psychiatry Clin. Neurosci. 69(6), 360–368.
12. Olvet, D. M., Delaparte, L., Yeh, F. C., et al. 2016. A comprehensive examination of white matter tracts and connectometry in major depressive disorder. Depress. Anxiety 33(1), 56–65.
13. Lee, Y. Y., Stockings, E. A., Harris, M. G., et al. 2019. The risk of developing major depression among individuals with subthreshold depression: a systematic review and meta-analysis of longitudinal cohort studies. Psychol. Med. 49(1), 92–102.
14. Gilbody, S., Lewis, H., Adamson, J., et al. 2017. Effect of collaborative care vs usual care on depressive symptoms in older adults with subthreshold depression: The CASPER randomized clinical trial. JAMA 317(7), 728–737.
Figures