0468
Detection of unilateral changes in thalamic volume and microstructure in focal epilepsy using 7T MRI1Aix-Marseille Université, CNRS, CRMBM, Marseille, France, 2APHM La Timone, CEMEREM, Marseille, France, 3Aix-Marseille Université, INSERM, INS, Marseille, France, 4Department of Epileptology, APHM La Timone, Marseille, France
Synopsis
This work evaluated differences in thalamic morphometry and T1 across drug-resistant temporal (TLE) and non-temporal lobe epilepsy (nTLE) patients using 7T MRI. Results show bilateral thalamic atrophy across all patients, with strongest effects observed in TLE patients and ipsilateral pulvinar and mediodorsal nuclei. Moreover, T1 appeared lower, especially in medial, lateral, and posterior nuclei. While T1 was lowest across nTLE patients, an ipsi- vs contralateral effect was uniquely present in TLE patients. Future, joint analyses with other available myelin- and iron sensitive metrics (e.g., tissue susceptibility and diffusivity), connectivity features and clinical features will increase sensitivity to differentiate among patients.
Introduction
The brain’s deep gray nuclei, and thalamus in particular, are known to be involved in seizure dynamics in focal epilepsy. This is corroborated by structural and functional neuroimaging studies1–5. Assessment of thalamic connectivity using resting-state functional MRI-based graph theoretical measures6, or intracerebral EEG recordings (stereotactic-EEG, SEEG)7 have shown thalamic implication to be predictive of surgical outcome in temporal lobe epilepsy (TLE). Finally, thalamus involvement has been demonstrated at the therapeutic level by serving as a target for deep brain stimulation8 when excisional surgery is contraindicated or fails. While SEEG is considered the gold standard to explore the epileptogenic value of the thalamus, it is limited by the number of sampling points and its invasive nature. Therefore, 7T MRI appears to be a promising alternative for non-invasive exploration of subcortical structures in vivo, at a superior resolution. Its high signal- and contrast-to-noise ratio allows access to the complex cytoarchitecture of the thalamus through quantification of intrinsic tissue properties such as its longitudinal relaxation rate (T1)9. Bernhardt et al10 demonstrated the promise of cortical T1 to localize the side of epilepsy. In the current work, we evaluated differences in thalamic morphometry and quantitative T1 across drug-resistant TLE and non-temporal lobe epilepsy (nTLE) patients to identify potential imaging biomarkers using 7T MRI.Methods
A total of 24 TLE (age 29±10 yrs, 10 males), 14 nTLE (age 32±12 yrs, 7 males) and 31 healthy controls (age 32±13 yrs, 11 males) were included. All patients underwent a comprehensive pre-surgical work-up including SEEG recording. The TLE group comprises patients with a temporal lobe epileptogenic zone (EZ) network (with possible extratemporal involvement) while the nTLE group includes patients with a prefrontal (with possible involvement of other regions), insular-opercular, central-premotor and posterior cortical EZ.Acquisition: For each subject, T1(w) and B1+ data were acquired using a whole-body 7T scanner (Siemens Healthineers, Erlangen, Germany), equipped with a 1Tx/32Rx phased-array head coil (Nova Medical, Wilmington, USA), and a high-resolution 3D MP2RAGE (TR/TE/TI1/TI2=5000/3.13/900/2750, FA1/FA2=6/5ᵒ, BW=239 Hz/Px, GRAPPA factor of 3 in PE with 32 reference lines and slice Partial Fourier 6/8 with 0.6 mm voxel spacing)11 and low-resolution, standard 2D turbo FLASH sequence, respectively.
Volumetry: After correction of the MP2RAGE data for B1+ inhomogeneities12, the resulting T1w volume was skull-stripped13 and used as input for FreeSurfer v7.214. In parallel, the thalamic nuclei were automatically segmented using THOMAS15. Volume and average T1 were extracted for the whole left and right thalami separately, as well their respective twelve nuclei.
Statistical analyses: First, volume and T1 data were corrected (and z-scored) for age, hemisphere and estimated total intracranial volume (eTIV, calculated by FreeSurfer, as measure for head size) effects based on the healthy controls data using the confounds Python package16. Then, group-wise and ipsi- vs. contralateral differences in thalamic (nuclei) volume and T1 were explored using the z-scored data, and univariate (whole thalamus) and multivariate (across nuclei) ANOVA in SPSS (v23).
Results
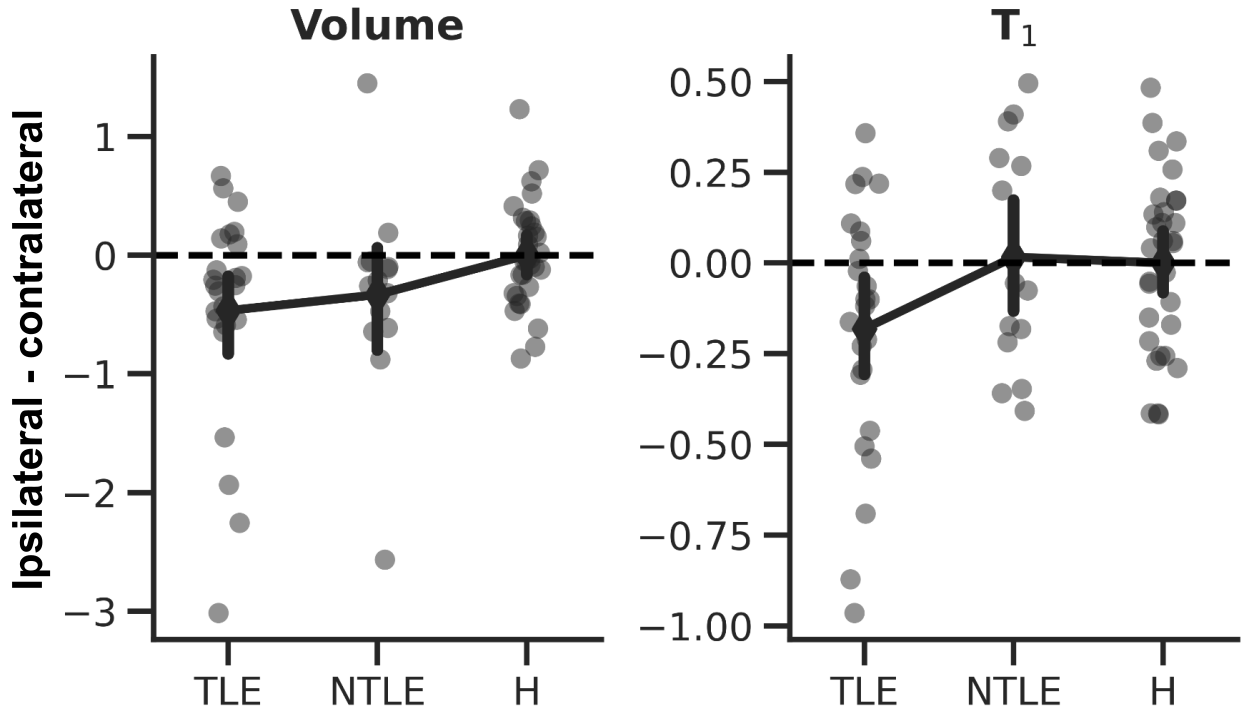
On average, thalamic (Fig 1A) volume was significant different across groups (ANOVA, F2,129=18.927, p<.001, Fig. 1B, left panel). Both TLE (p<.001) and nTLE (p<.005) groups were characterized by a reduced, thalamic volume bilaterally compared to the healthy controls (‘H’). A similar pattern was observed for T1 (F2,129=7.041, p<.005, Fig. 1B, right panel), but with lowest T1 observed for the nTLE group (p<.005 vs controls).Moreover, ipsilateral thalami of patients were characterized by a reduced volume compared to their unaffected, contralateral counterpart (F2,63=3.512, p<.05, Fig. 2, left panel). This effect was most pronounced across TLE patients (p<.05) and weaker for nTLE (p=.083). A trend was observed for T1 (F2,63=2.577, p=.084, Fig. 2, right panel) with a larger ipsi- vs. contralateral difference in T1 for the TLE group compared to healthy controls (p=.068) and nTLE patients (p=.066).
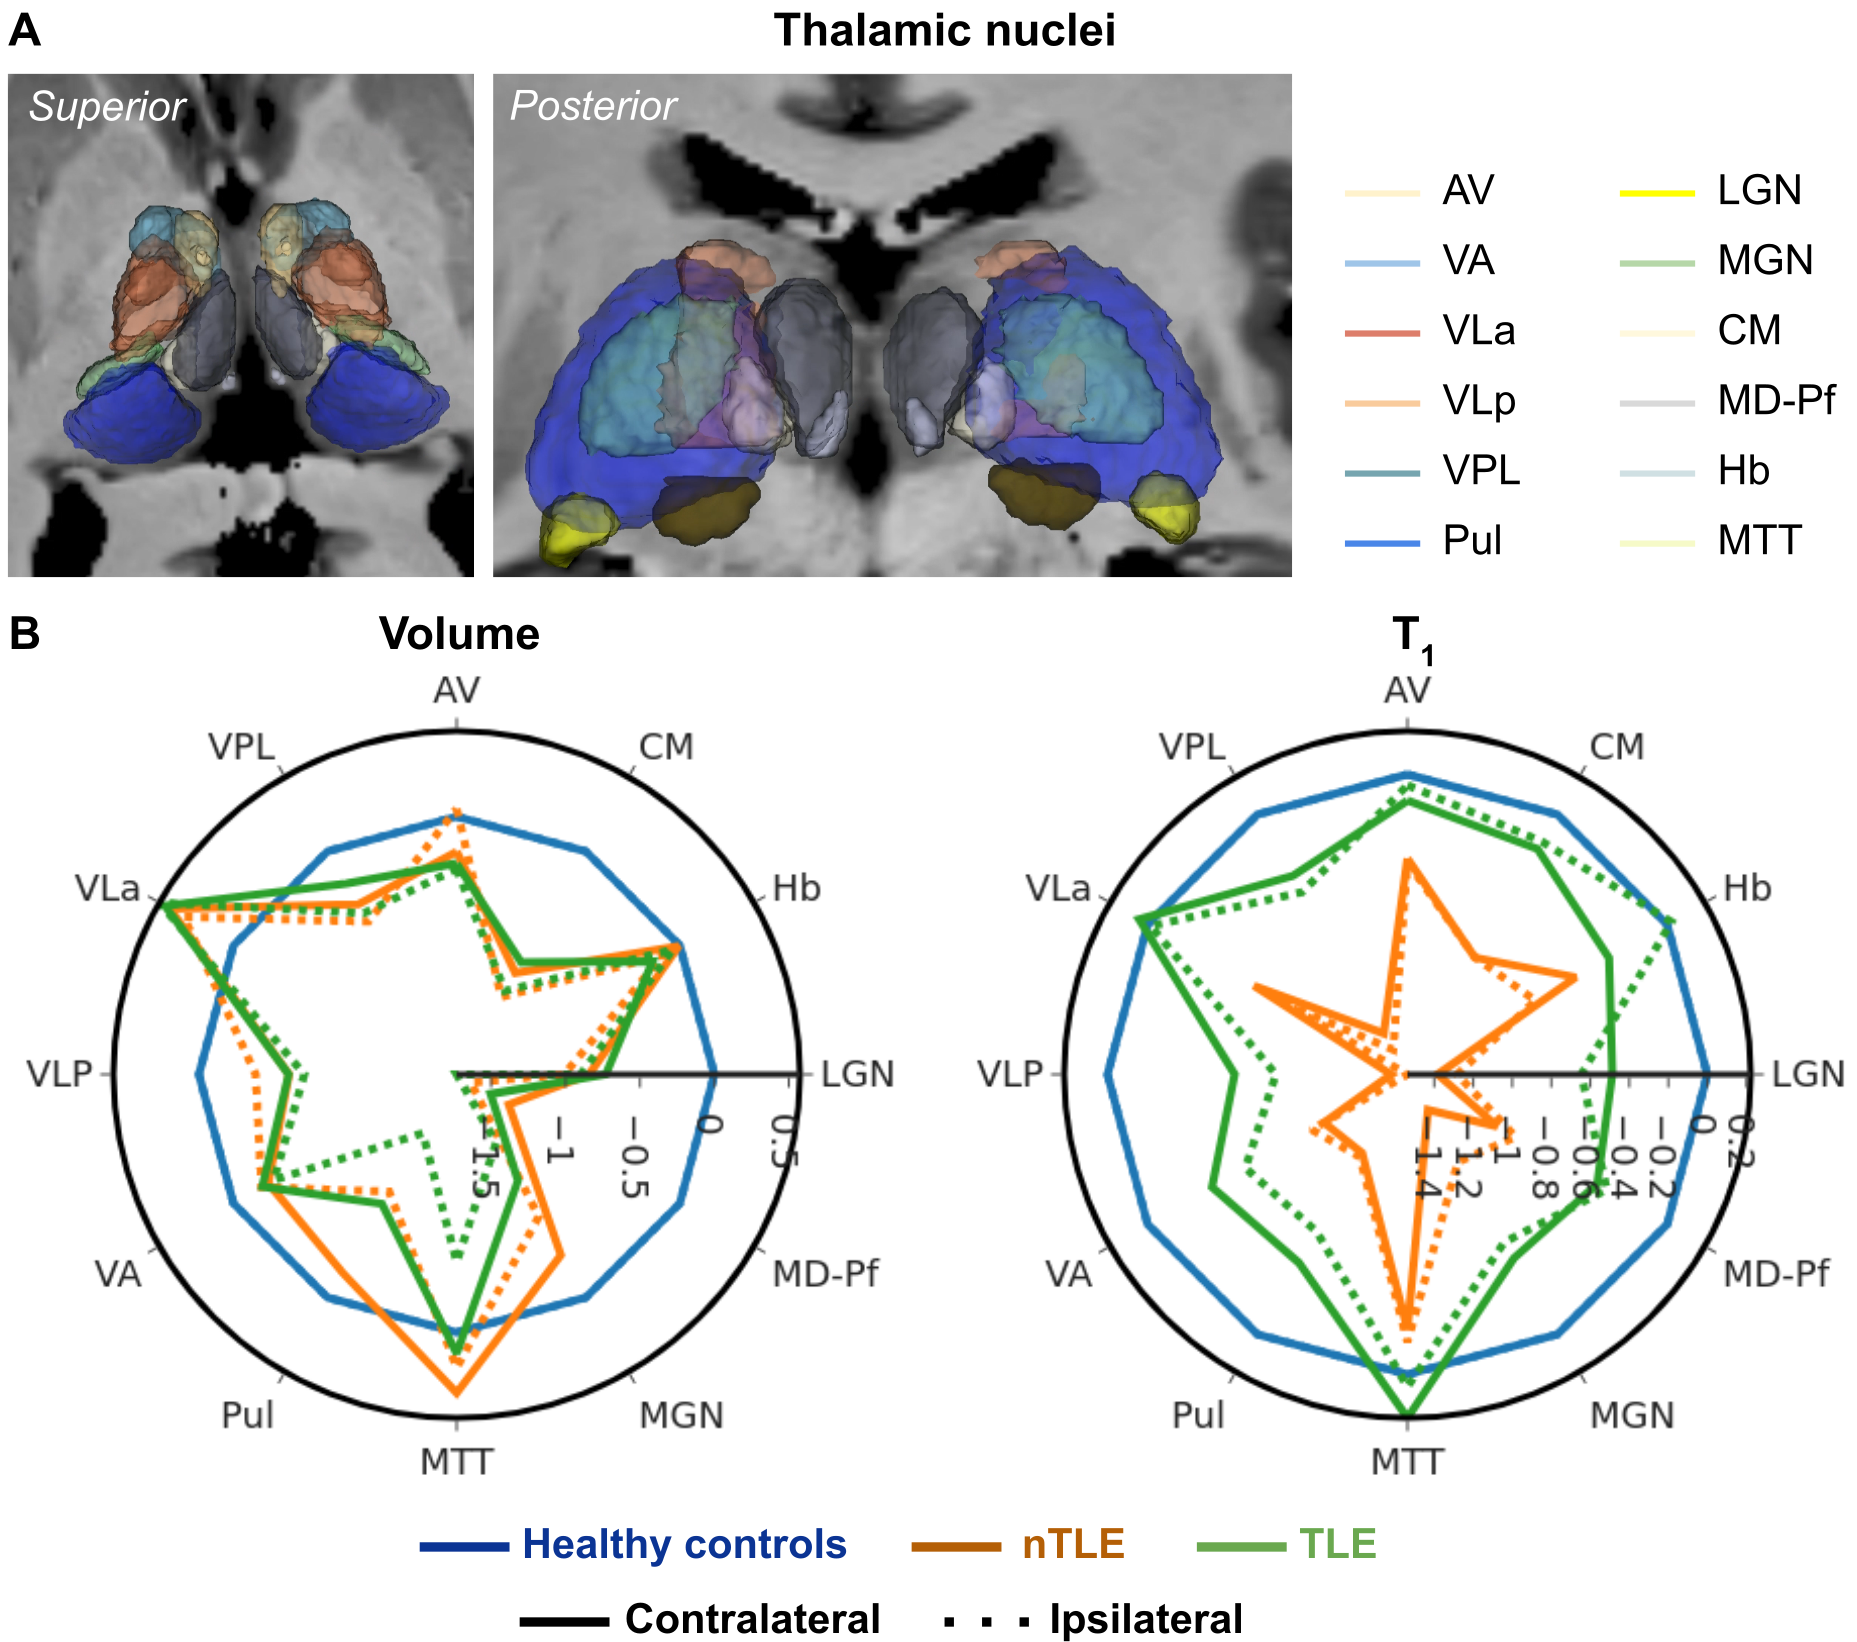
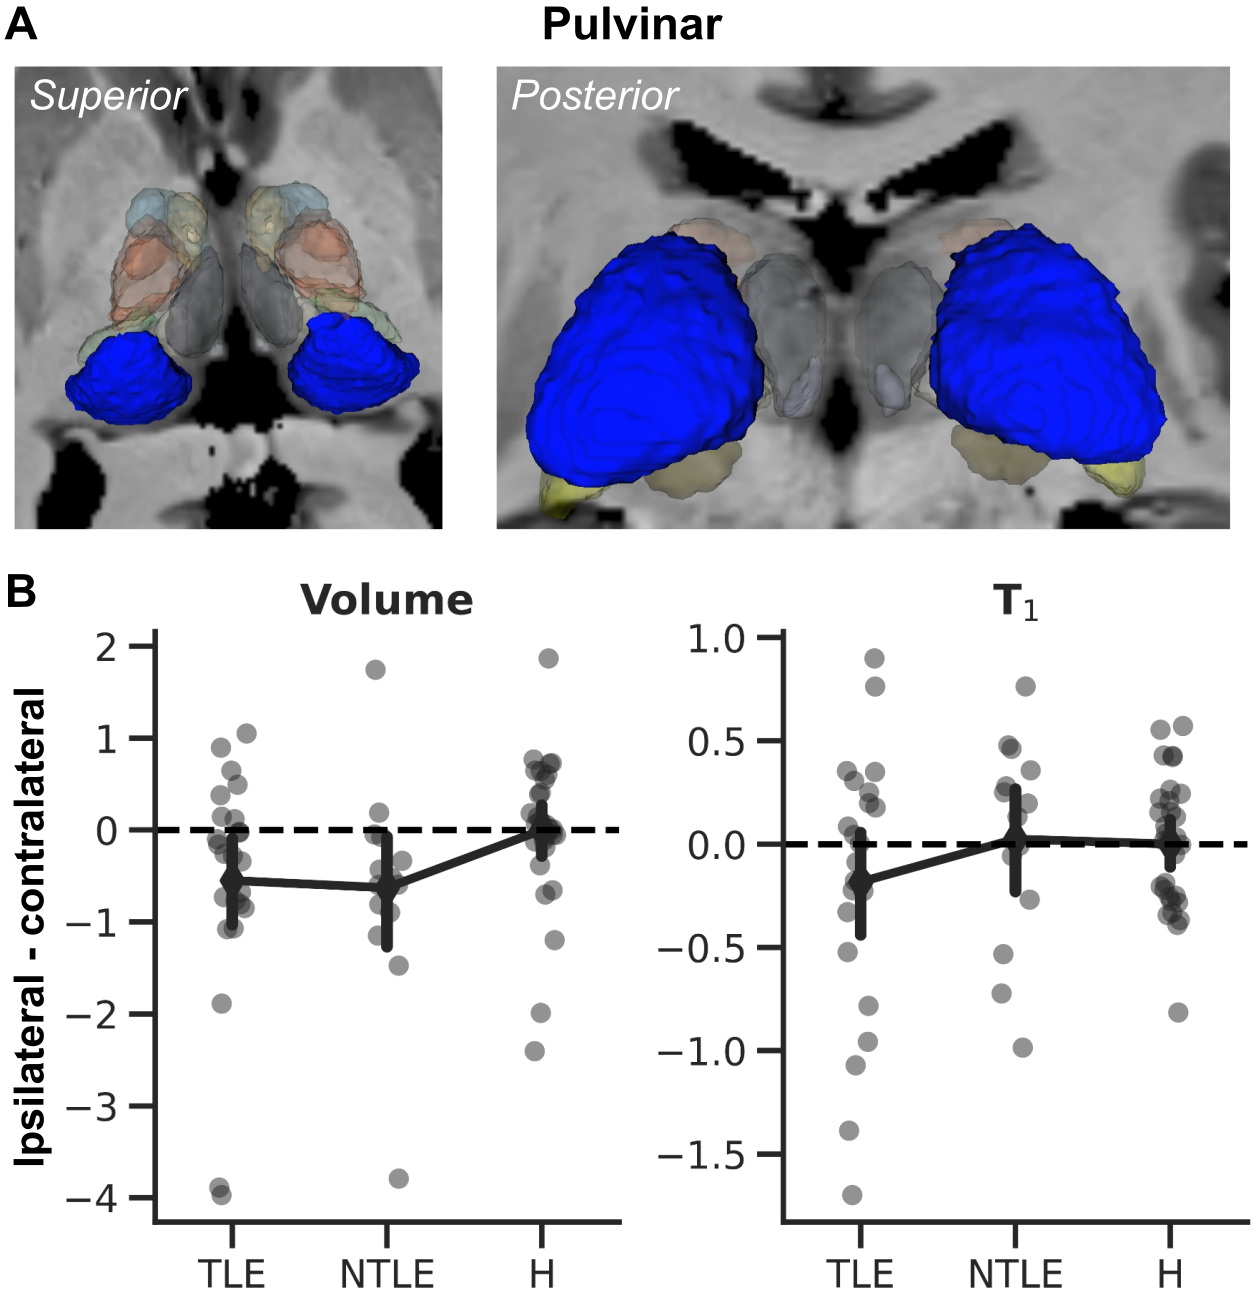
In line with the whole thalamic results, significant differences were observed across nuclei (Fig. 3A) for both volume (MANOVA, F24,236=3.739, p<.001, Fig. 3B, left panel) and T1 (F24,236=2.784, p<.001, right panel). In both cases, the pulvinar was characterized by an apparent group effect (volume: F2,129=7.454, p<.005; T1: F2,129=4.676, p<.05) with a reduced size for the TLE group, while T1 was lower for the nTLE patients. Finally, the pulvinar (Fig. 4A) ipsi- vs. contralateral volume (not T1) difference varies across groups (F2,63=4.127, p<.05, Fig. 4B, left panel). Both TLE and nTLE patient group appear to be impacted similarly (p<.05).
Discussion
Consistent with the literature1, we observed bilateral thalamic atrophy across all patients, but TLE in particular. This effect is strongest towards the ipsilateral posterior (e.g., pulvinar and LGN) and medial (e.g., MD-Pf) nuclei groups. T1 appeared lower across all patients, especially in medial, lateral, and posterior nuclei. While T1 was lowest for the nTLE group, an ipsi- vs contralateral effect was uniquely present in TLE patients. As a measure of tissue integrity, changes in T1 might precede volumetric changes. Here, the spatial specificity of the observed differences might be explained due to distinct structural and functional connectivity profiles across the thalamic nuclei5,17, impacted differently based on the EZ7. Ongoing correlational analyses with clinical features (e.g., age of onset and disease duration), and tissue susceptibility and connectivity, will allow us to characterize the impact of focal epilepsy on the thalamus more precisely.Acknowledgements
We would like to thank the patients and control participants who agreed to take part in this study.References
1 Whelan CD, Altmann A, Botía JA, et al. Structural brain abnormalities in the common epilepsies assessed in a worldwide ENIGMA study. Brain 2018;141:391–408. doi:10.1093/brain/awx341
2 Keller SS, Richardson MP, Schoene-Bake J-C, et al. Thalamotemporal alteration and postoperative seizures in temporal lobe epilepsy: MRI and Outcome in Epilepsy. Ann Neurol 2015;77:760–74. doi:10.1002/ana.24376
3 Dinkelacker V, Valabregue R, Thivard L, et al. Hippocampal-thalamic wiring in medial temporal lobe epilepsy: Enhanced connectivity per hippocampal voxel. Epilepsia 2015;56:1217–26. doi:10.1111/epi.13051
4 Park KM, Lee BI, Shin KJ, et al. Pivotal Role of Subcortical Structures as a Network Hub in Focal Epilepsy: Evidence from Graph Theoretical Analysis Based on Diffusion-Tensor Imaging. J Clin Neurol 2019;15:68. doi:10.3988/jcn.2019.15.1.68
5 Jo HJ, Kenny-Jung DL, Balzekas I, et al. Nuclei-specific thalamic connectivity predicts seizure frequency in drug-resistant medial temporal lobe epilepsy. NeuroImage: Clinical 2019;21:101671. doi:10.1016/j.nicl.2019.101671
6 He X, Doucet GE, Pustina D, et al. Presurgical thalamic “hubness” predicts surgical outcome in temporal lobe epilepsy. Neurology 2017;88:2285–93. doi:10.1212/WNL.0000000000004035
7 Pizzo F, Roehri N, Giusiano B, et al. The ictal signature of thalamus and basal ganglia in focal epilepsy: An SEEG study. Neurology 2020;:10.1212/WNL.0000000000011003. doi:10.1212/WNL.0000000000011003
8 Li MCH, Cook MJ. Deep brain stimulation for drug-resistant epilepsy. Epilepsia 2018;59:273–90. doi:10.1111/epi.13964
9 Stüber C, Morawski M, Schäfer A, et al. Myelin and iron concentration in the human brain: a quantitative study of MRI contrast. Neuroimage 2014;93 Pt 1:95–106. doi:10.1016/j.neuroimage.2014.02.026
10 Bernhardt BC, Fadaie F, Vos de Wael R, et al. Preferential susceptibility of limbic cortices to microstructural damage in temporal lobe epilepsy: A quantitative T1 mapping study. NeuroImage 2018;182:294–303. doi:10.1016/j.neuroimage.2017.06.002
11 Marques JP, Kober T, Krueger G, et al. MP2RAGE, a self bias-field corrected sequence for improved segmentation and. Neuroimage 2010;49:1271–81. doi:10.1016/j.neuroimage.2009.10.002
12 Massire A, Seiler C, Troalen T, et al. T1-Based Synthetic Magnetic Resonance Contrasts Improve Multiple Sclerosis and Focal Epilepsy Imaging at 7 T. Invest Radiol 2021;56:127–33. doi:10.1097/RLI.0000000000000718
13 Haast RAM, Lau JC, Ivanov D, et al. Effects of MP2RAGE B1+ sensitivity on inter-site T1 reproducibility and hippocampal morphometry at 7T. Neuroimage 2021;224:117373. doi:10.1016/j.neuroimage.2020.117373
14 Fischl B. FreeSurfer. Neuroimage 2012;62:774–81. doi:10.1016/j.neuroimage.2012.01.021
15 Su JH, Thomas FT, Kasoff WS, et al. Thalamus Optimized Multi Atlas Segmentation (THOMAS): fast, fully automated segmentation of thalamic nuclei from structural MRI. Neuroimage 2019;194:272–82. doi:10.1016/j.neuroimage.2019.03.021
16 Raamana PR. Conquering confounds and covariates in machine learning with the python library confounds. Zenodo 2020. doi:10.5281/ZENODO.3701527
17 Behrens TEJ, Johansen-Berg H, Woolrich MW, et al. Non-invasive mapping of connections between human thalamus and cortex using diffusion imaging. Nat Neurosci 2003;6:750–7. doi:10.1038/nn1075
Figures
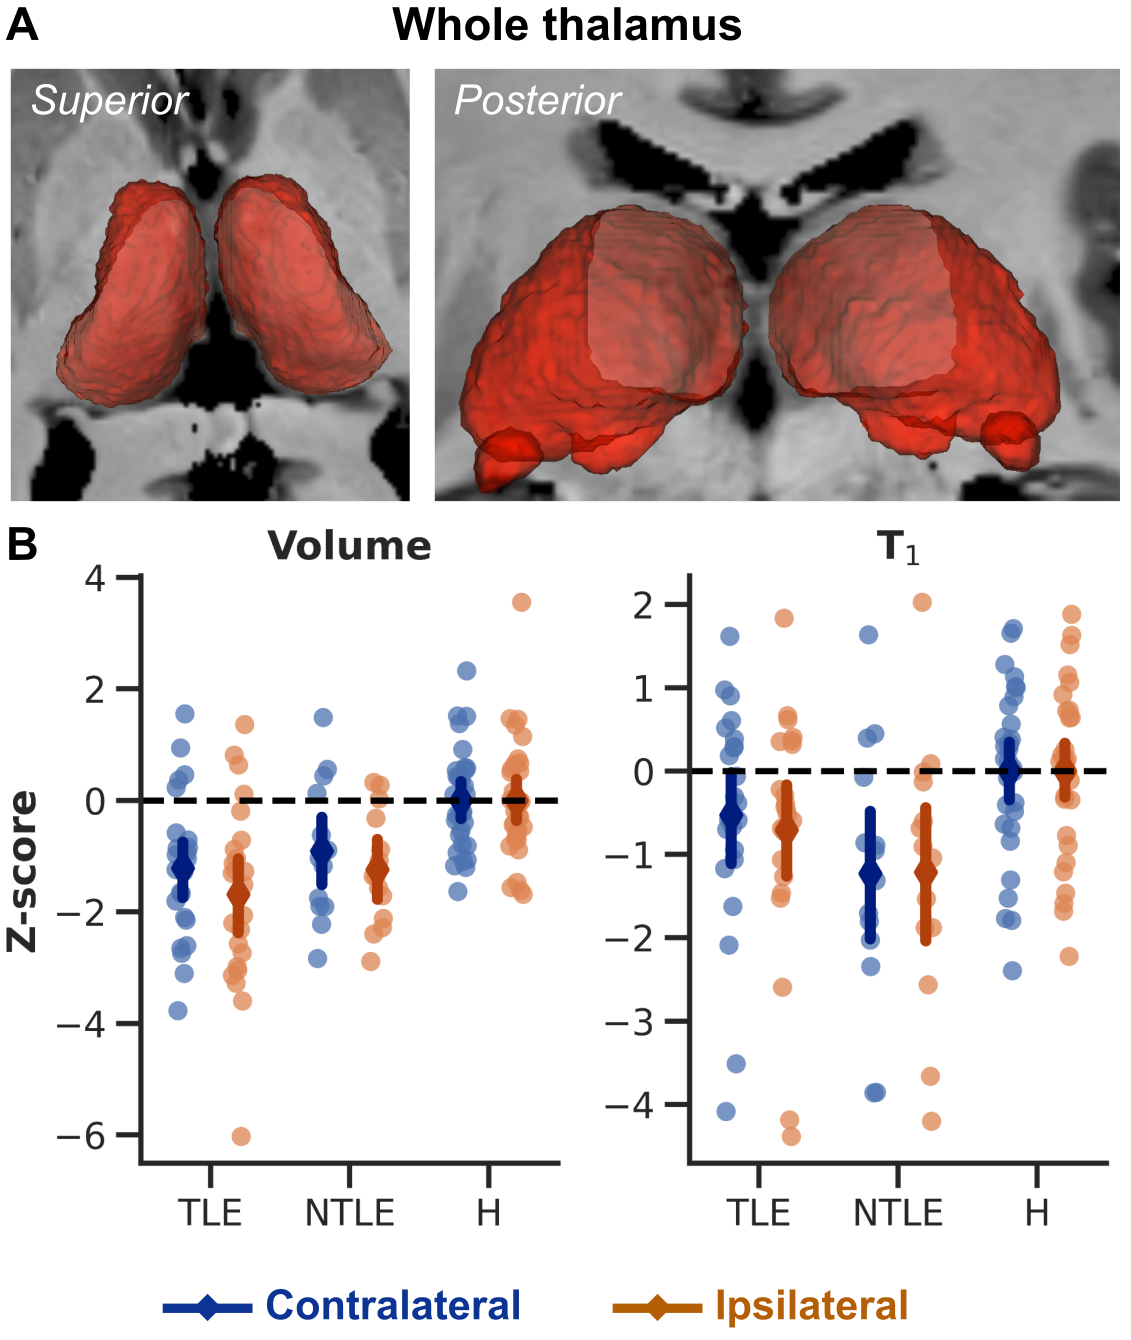
Fig. 1 – Whole thalamic volume and T1. (A) 3D representation of the left and right thalamus for an example subject. (B) Individual dots represent subject-specific z-scored thalamic volume (left panel) and T1 (right panel). Overlaid diamonds indicate group- (x-axes) and side (contralateral in blue, and ipsilateral in orange)-wise averages (±95% CI).