0467
Analysis of Hippocampal Subfield Diffusion Imaging for Lateralization in Mesial Temporal Sclerosis1Bioengineering, Stanford University, Stanford, CA, United States, 2Radiology, Stanford Medicine, Stanford, CA, United States, 3Neurology & Neurological Sciences, Stanford Medicine, Stanford, CA, United States, 4Radiology Department, Stanford University, Stanford, CA, United States, 5University Hospitals, 11100 Euclid Ave, OH, United States
Synopsis
We performed subfield characterization of Mesial Temporal Sclerosis (MTS) using diffusion metrics. Analysis of MRI from 57 temporal lobe epilepsy patients was based on categorization from medical records, initial clinical radiological reads, and diagnostic changes after subfield DTI analyses. We observed differences in mean diffusivity, axial diffusivity and orientation dispersion in the dentate gyrus of patients with MTS. Differences between MTS and control patients were more pronounced in left MTS. We demonstrate how these methods may aid in the MRI identification of MTS.
Introduction
Mesial temporal sclerosis (MTS) is a common identified cause of temporal lobe epilepsy (TLE). MRI is critical for diagnosis but there is interobserver variability, especially in subtle cases. Furthermore, there are different types of MTS and origin of hippocampal epileptiform activity may vary in individual patients. Unfortunately, subregion analyses are not typically included in standard epilepsy protocol imaging interpretation. Diffusion imaging may provide a more quantitative approach to identification of MTS. Prior DTI research of TLE has generally reported microstructural abnormalities based on analyses of the hippocampus as the whole1,2. However, there are limited studies detailing quantitative diffusion metrics within different hippocampal subfields1. Our aim is to determine whether advanced diffusion tensor imaging can discern microstructural abnormalities in the different hippocampal subfields that can increase sensitivity and specificity detecting of MTS.Methods
We analyzed data from 57 TLE patients who underwent a 3T MRI including DTI. Electronic medical records were used to classify according to 6 categories: definite left or right (L/R) MTS, probable L/R MTS, no MTS, or bilateral MTS. Additionally, the clinical radiology report was classified according to: definite L/R MTS, probable L/R MTS, or no MTS.The processing pipeline for the images is shown in Figure 1. Diffusion sequences were preprocessed with topup and eddy current correction3 and the DTI model was fitted to the corrected data to extract different diffusion parameter maps: fractional anisotropy (FA), mean diffusivity (MD), axial diffusivity (AD) and radial diffusivity (RD). Additionally, NODDI4 modeling was fitted to obtain maps of orientation dispersion (ODI) and isotropic fraction (fiso).
The Automatic Segmentation of Hippocampal Subfields (ASHS) tool5 was applied to T2 and T1 weighted images to segment hippocampal subfields dentate gyrus(DG), CA1, subiculum, entorhinal cortex, parahippocampal gyrus, according to a standard atlas6. Subfields were then eroded by one voxel in the 2D oblique coronal plane using c3d in order to reduce partial volume effects7. Finally, the diffusion maps were registered to the T2 images and average diffusion metrics in each subfield were obtained. We used the ratio between the metrics in both hemispheres to analyze:
- Differences of the final diagnostic category both with combined L/R MTS and split by lateralization
- Differences of the clinical radiological category
- Differences of the change of category between the radiological read and the final category, to explore if diffusion imaging allowed correction of an erroneous initial radiographic category.
Results and Discussion
Comparisons of final categorization of cohorts of definite/possible MTS vs. no-MTS (Fig. 2) demonstrated that the most discriminating region is DG, significant after multiple comparison correction8 in MD, ODI and AD. Our data also support prior findings of significance of ODI decrease across the entire hippocampus9. Diffusion metrics that provide the most discrimination power are ODI and AD (in DG). Volume was also discriminating, in particular for the whole hippocampus.Comparing left and right MTS, we observed significant differences again in the DG metrics (MD, ODI, AD, Volume) for left MTS, while we observed no significant findings with right MTS comparisons. DG-ODI showed a sensitivity of 76% and a specificity of 92.3% in discriminating between definite/possible left MTS and no MTS.
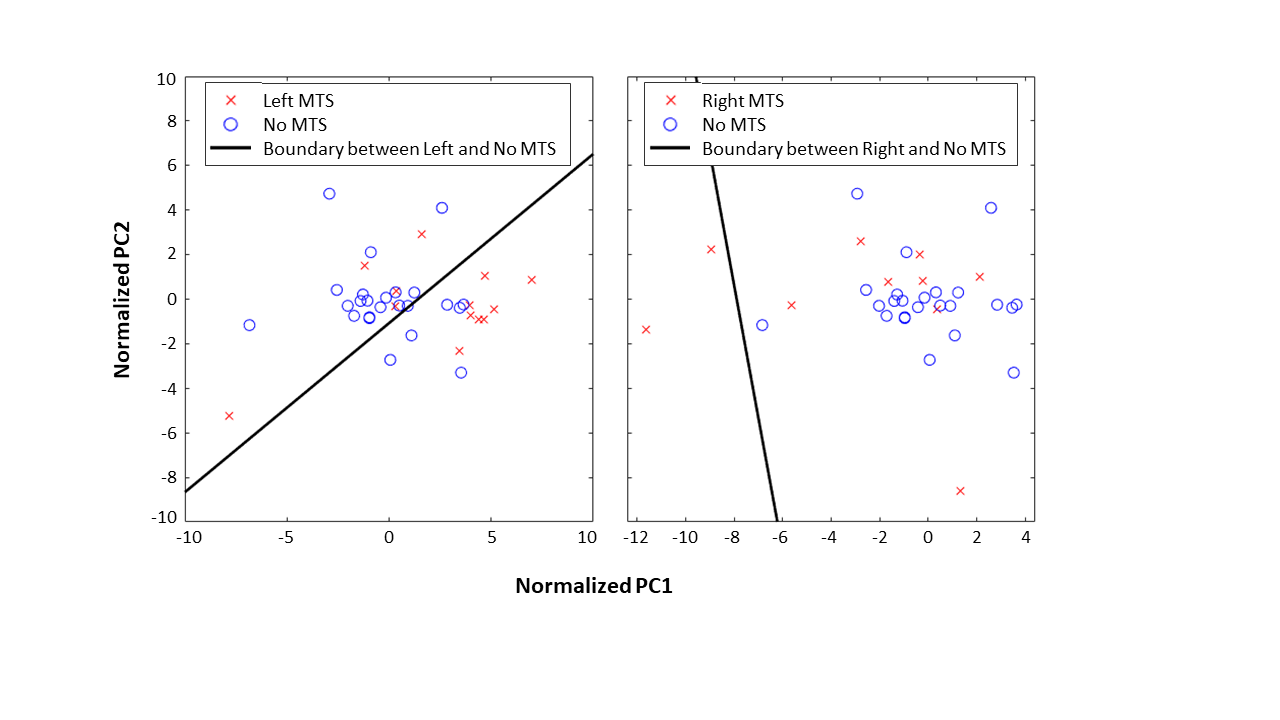
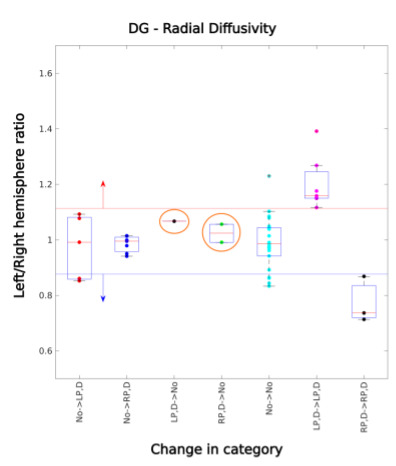
To investigate this difference in lateralization, we performed principal component analysis (PCA) considering the 6 ROIs x 7 diffusion metrics = 42 features for a single patient as one observation. Figure 3 illustrates that left MTS data points are effectively separated from no MTS, but right MTS points overlap with no MTS. Using radiographic categorization (Fig. 4), a similar pattern is observed, with CA1, DG, and whole hippocampus having the highest number of significantly different features (all except FA). It was found that DG metrics might be useful in confirming cases of MTS (Fig. 5). For cases in which the radiologic read was initially possible/definite MTS, using only DG RD resulted in 1/0 new true/false negatives on the left, and 2/0 on the right. Additionally, the DG-RD threshold corrected a false lateralization, in which one patient that was categorized as right MTS in the radiological reads, but was determined to be left MTS in the final category.
Conclusion
We demonstrate the utility of quantitative subfield volumetry and diffusion characterization of MRI in TLE patients. We found most significant differences in the analyses of left MTS. Attention to diffusion signal abnormalities in the dentate gyrus may aid in better detection and discrimination of MTS.Acknowledgements
We would like to acknowledge funding from the Epilepsy Foundation. We would like to thank Robert Fisher and Josef Parvizi for their assistance with this manuscript.References
T. M. Salmenpera, R. J. Simister, P. Bartlett, M. R. Symms, P. A. Boulby, S. L. Free, G. J. Barker and J. S. Duncan, "High-resolution diffusion tensor imaging of the hippocampus in temporal lobe epilepsy," Epilepsy research, vol. 71, p. 102–106, 2006.
D. W. Gross, "Diffusion tensor imaging in temporal lobe epilepsy," Epilepsia, vol. 52, p. 32–34, 2011.
J. L. R. Andersson and S. N. Sotiropoulos, "An integrated approach to correction for off-resonance effects and subject movement in diffusion MR imaging," Neuroimage, vol. 125, p. 1063–1078, 2016.
H. Zhang, T. Schneider, C. A. Wheeler-Kingshott and D. C. Alexander, "NODDI: practical in vivo neurite orientation dispersion and density imaging of the human brain," Neuroimage, vol. 61, p. 1000–1016, 2012.
L. Xie, L. E. M. Wisse, J. Pluta, R. de Flores, V. Piskin, J. V. Manjón, H. Wang, S. R. Das, S.-L. Ding, D. A. Wolk and others, "Automated segmentation of medial temporal lobe subregions on in vivo T1-weighted MRI in early stages of Alzheimer's disease," Human brain mapping, vol. 40, p. 3431–3451, 2019.
S. N. Parivash, M. Goubran, B. D. Mills, P. Rezaii, C. Thaler, D. Wolman, W. Bian, L. A. Mitchell, B. Boldt, D. Douglas and others, "Longitudinal changes in hippocampal subfield volume associated with collegiate football," Journal of neurotrauma, vol. 36, p. 2762–2773, 2019.
P. A. Yushkevich, J. Piven, H. C. Hazlett, R. G. Smith, S. Ho, J. C. Gee and G. Gerig, "User-guided 3D active contour segmentation of anatomical structures: significantly improved efficiency and reliability," Neuroimage, vol. 31, p. 1116–1128, 2006.
J. Li and L. Ji, "Adjusting multiple testing in multilocus analyses using the eigenvalues of a correlation matrix," Heredity, vol. 95, p. 221–227, 2005.
D. Sone, N. Sato, M. Ota, N. Maikusa, Y. Kimura and H. Matsuda, "Abnormal neurite density and orientation dispersion in unilateral temporal lobe epilepsy detected by advanced diffusion imaging," NeuroImage: Clinical, vol. 20, p. 772–782, 2018.
Figures