0465
MR Fingerprinting Features in Patients with MRI-negative Pharmacoresistant Focal Epilepsy1Epilepsy Center, Cleveland Clinic, Cleveland, OH, United States, 2Department of Neurology, West China Hospital of Sichuan University, Chengdu, China, 3Biomedical Engineering, Case Western Reserve University, Cleveland, OH, United States, 4Imaging Institute, Cleveland Clinic, Cleveland, OH, United States
Synopsis
MR fingerprinting (MRF) is an advanced quantitative MR technique that allows for efficient acquisition of multiparametric tissue maps. We applied high-resolution 3D MRF to examine T1 and T2 changes in 30 pharmacoresistant focal epilepsy patients with negative MRI, using a voxel-wise group-analysis approach. Forty age-and-gender-matched healthy controls were also included for comparison. Significant T1 increase was detected in the temporal pole, mesial temporal, and superior temporal regions, as well as the orbitofrontal cortex, ipsilateral to the side of the epilepsy. These MRF-detected subtle tissue property changes suggest potential structural damage in the ipsilateral limbic network in MRI-negative pharmacoresistant focal epilepsy.
Introduction
Magnetic resonance fingerprinting (MRF) is an advanced quantitative MR technique that allows for the efficient acquisition of multiparametric tissue maps.1 The quantitative nature of MRF makes it well suited for the comparison of whole-brain tissue property changes between patients and healthy controls. Here, we aimed to use a high-resolution 3D MRF protocol to examine T1 and T2 changes from a consecutive cohort of pharmacoresistant focal epilepsy patients with negative MRI, through a voxel-wise group-analysis method. We hypothesize that MRF can detect group-level tissue property abnormalities in the epileptic brain, in patients whose clinical MRI scans were negative by visual inspection. We also hypothesize that the MRF-detected abnormalities would correlate with the selected clinical characteristics of the patients.Methods
Patient recruitment: We included patients with pharmacoresistant focal epilepsy undergoing presurgical evaluation at the Cleveland Clinic Epilepsy Center, who had a negative 3T clinical MRI by official radiology report. Patients whose scans had severe imaging artifacts and poor quality of image segmentation/registration were excluded. Healthy controls (HCs) were also included for comparison.MRI data acquisition: 3D whole-brain MRF scans (1 mm3 isotropic voxels)2 were performed using a Siemens 3T Prisma scanner. T1w images were synthesized from the MRF T1 maps, which were perfectly aligned with the T1 and T2 maps for the next steps of processing.
MRI data processing: Following skull stripping, the synthesized T1w images were registered to the MNI standard space using SyN in Advanced Normalization Tools (ANTs)3; the transformation matrices were then applied to the T1 and T2 maps. The T1 and T2 maps for patients with right-sided epilepsy were flipped to the left side, so that for all the analyses, left indicated ipsilateral and right indicated contralateral. Whole-brain masks of GM and WM were segmented using the FMRIB's Automated Segmentation Tool (FAST) in FSL.4
Statistical analysis: Nonparametric permutation 2-sample t-test was performed to assess the significant differences in T1 and T2 between patients and HCs, and comparison correction was conducted by the Threshold-Free Cluster Enhancement (TFCE) method in FSL.5 Comparisons were performed with whole-brain GM and WM masks separately. The family-wise error (FWE) rate was used for multiple comparison correction, with a significant level defined as P < 0.05. Subgroup analyses were performed for temporal lobe epilepsy (TLE, n = 6) and extra-TLE (ETLE, n = 24). Spearman’s correlation was used to examine the relationship between significant MRF findings and clinical characteristics such as age, age at onset, epilepsy duration, and seizure frequency.
Results
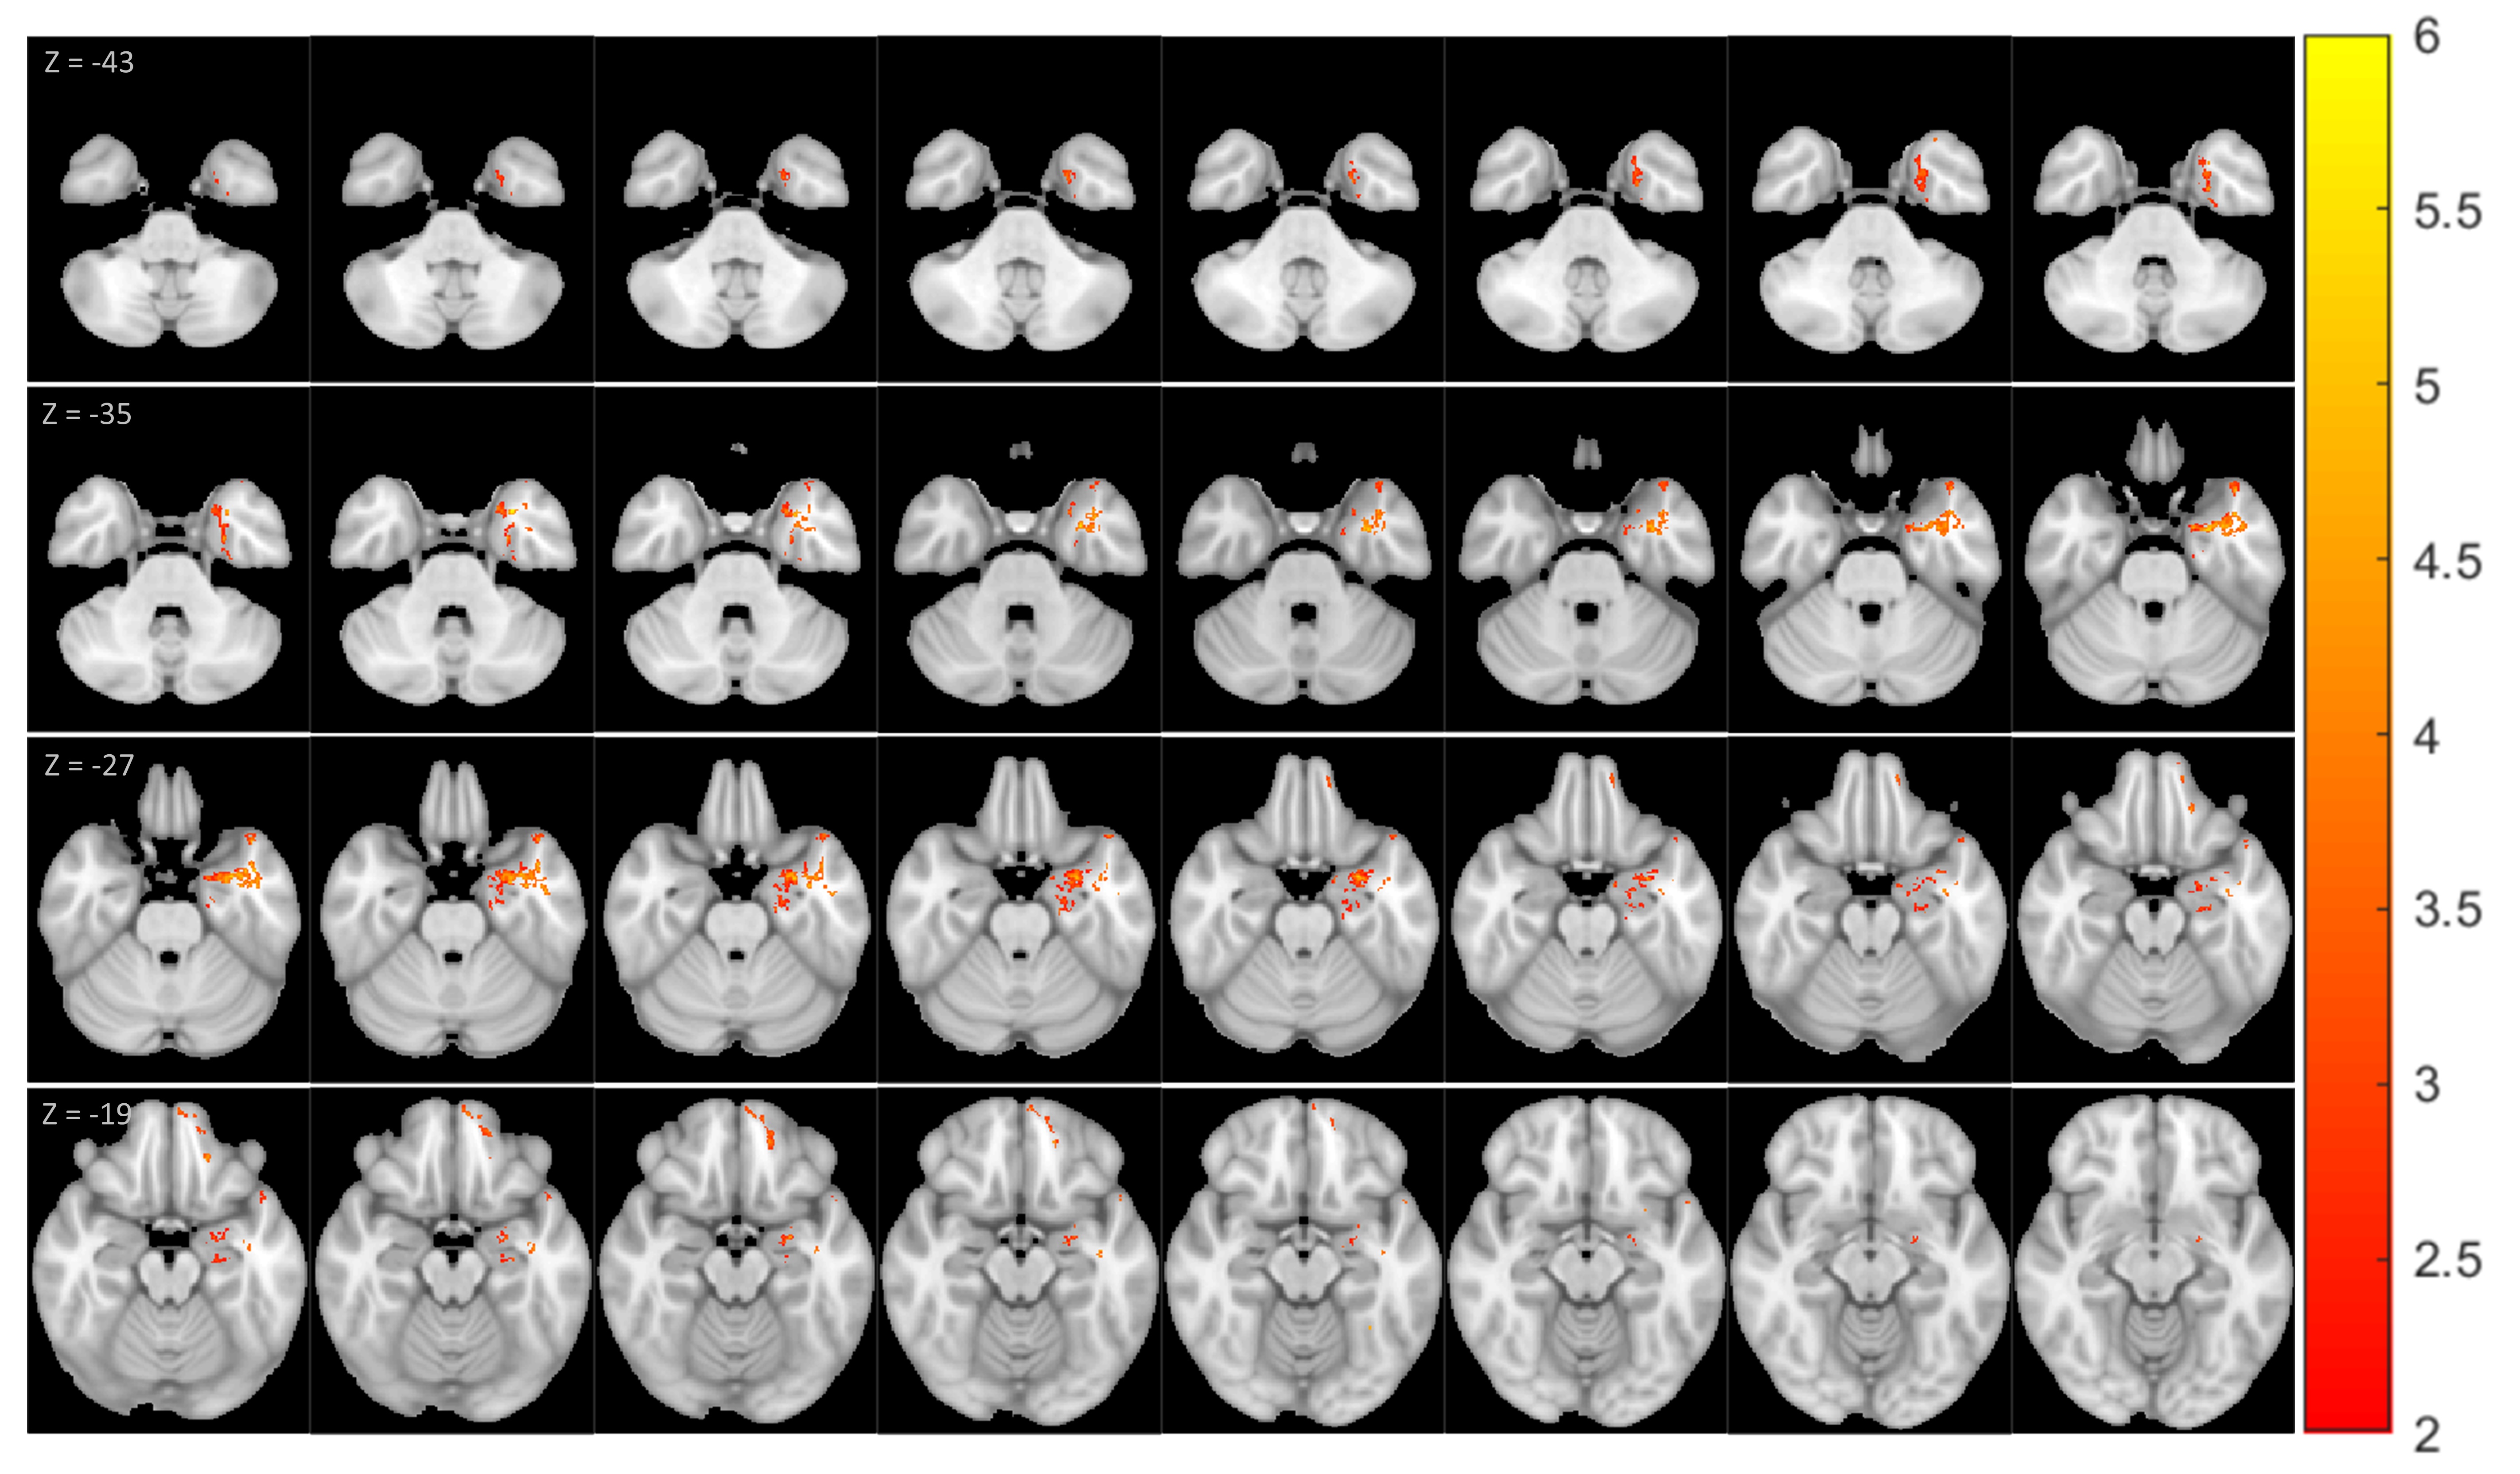
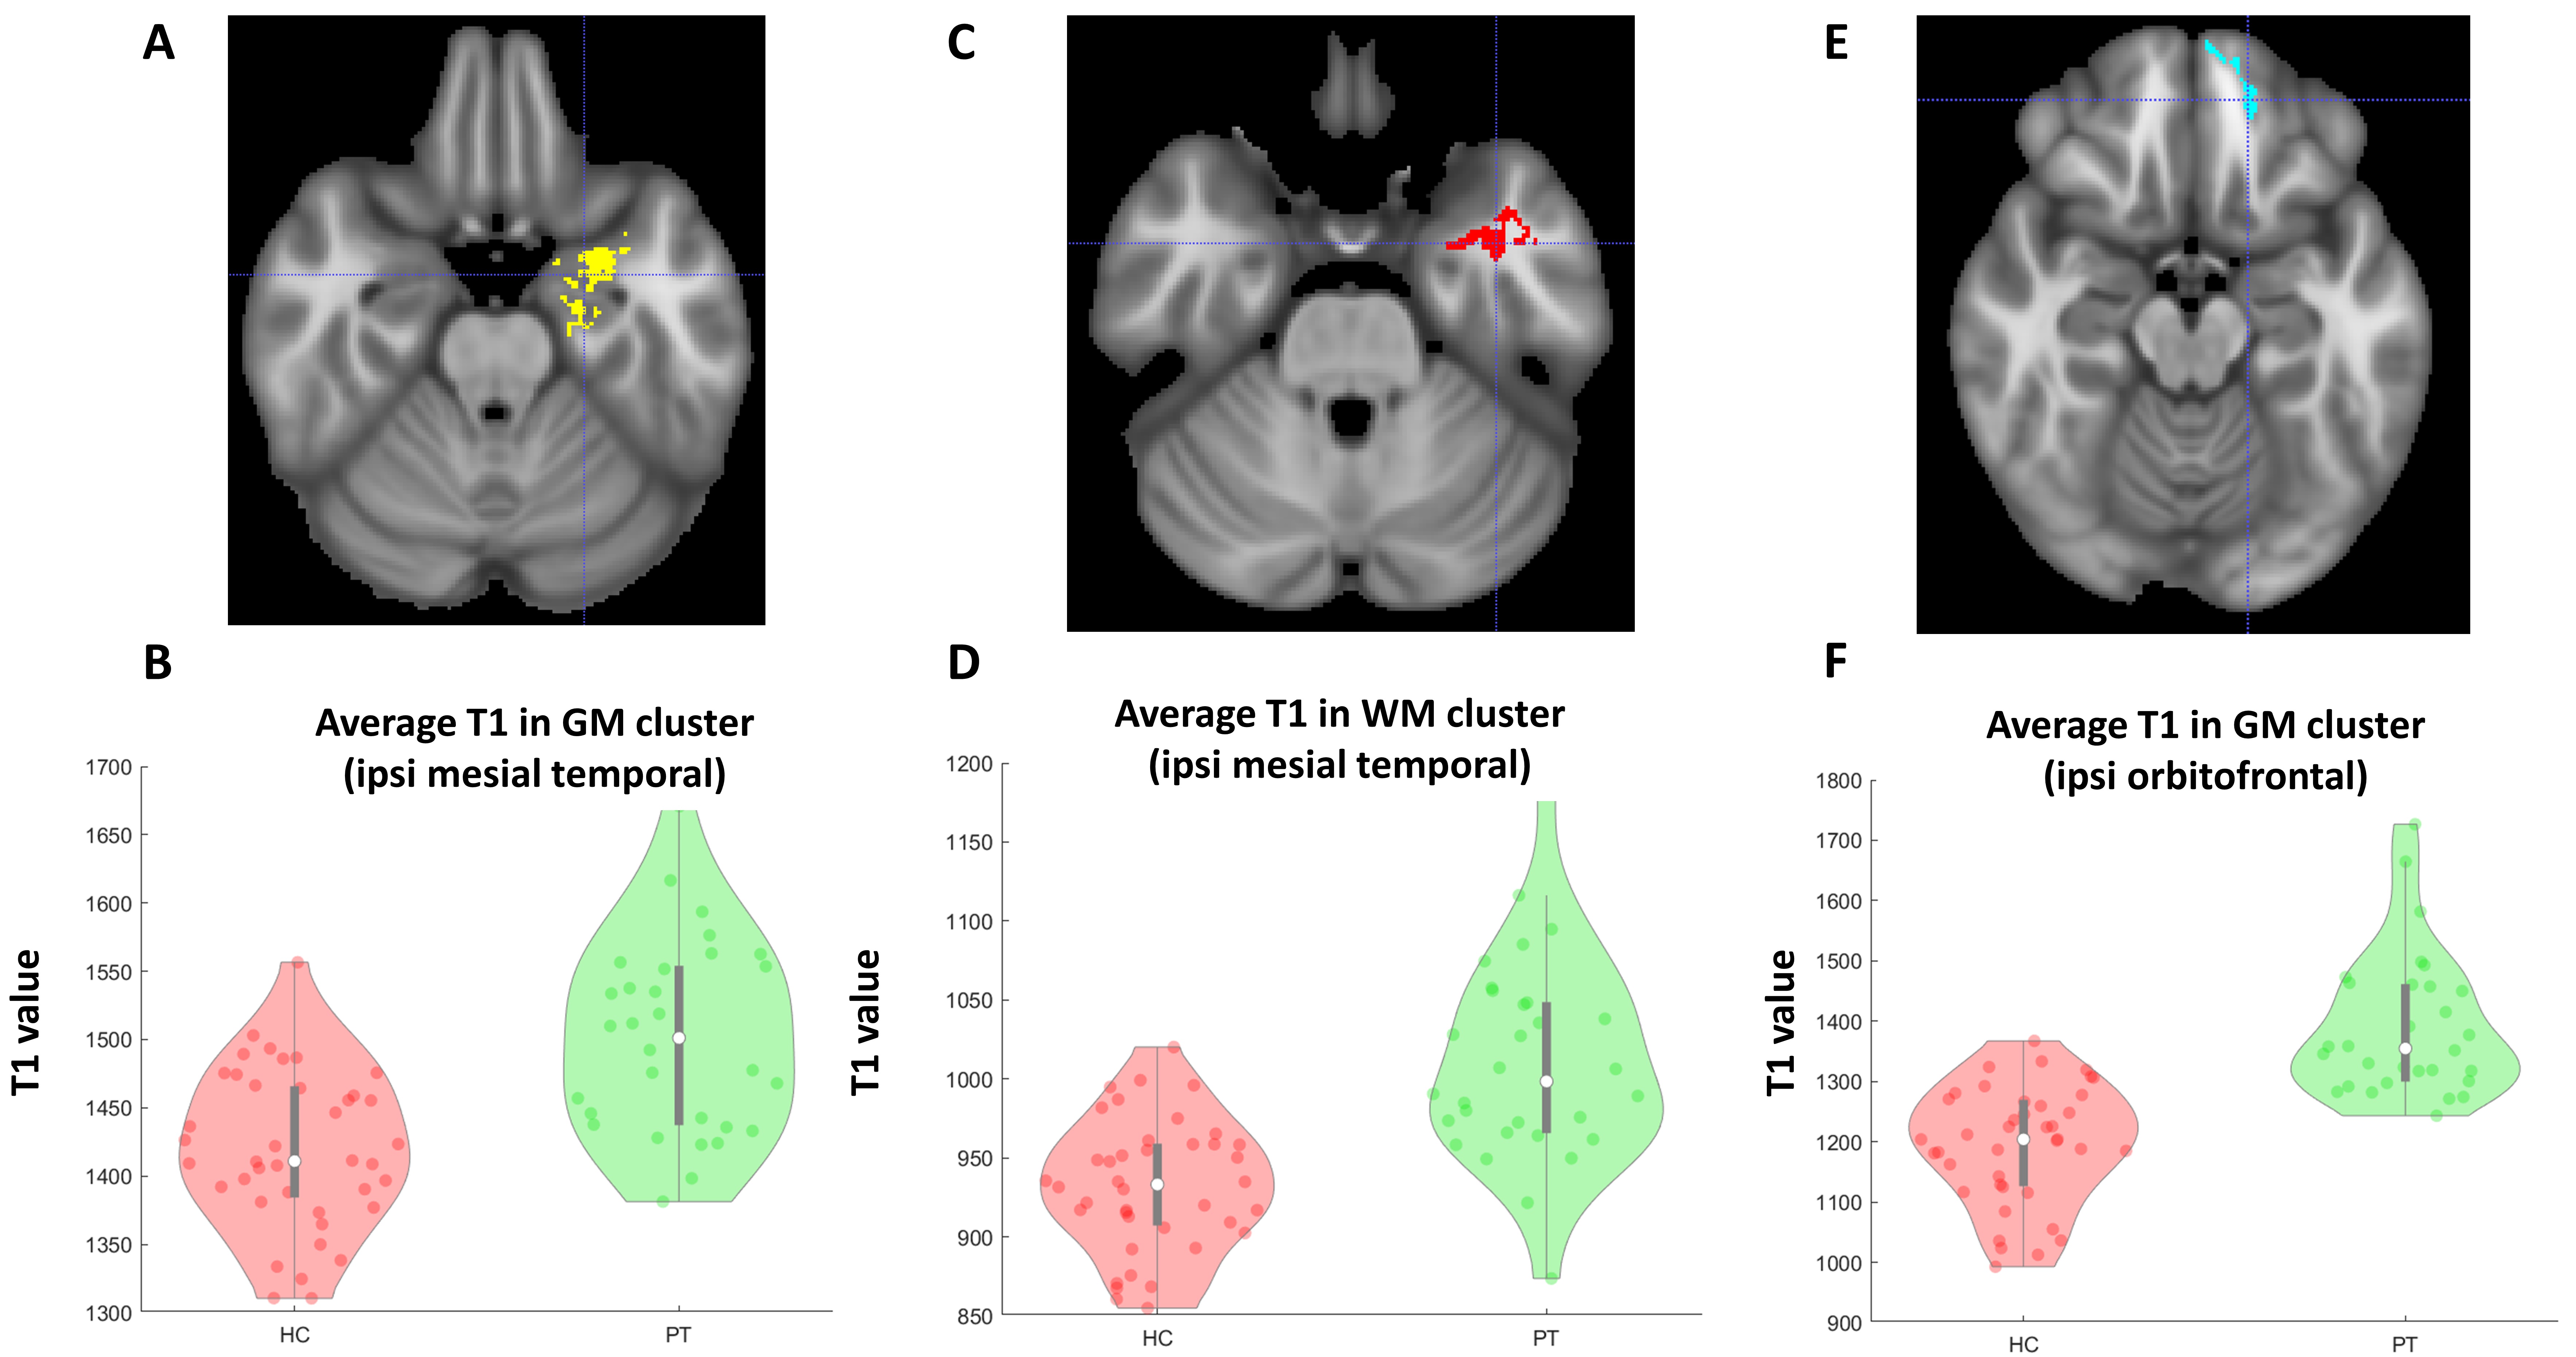
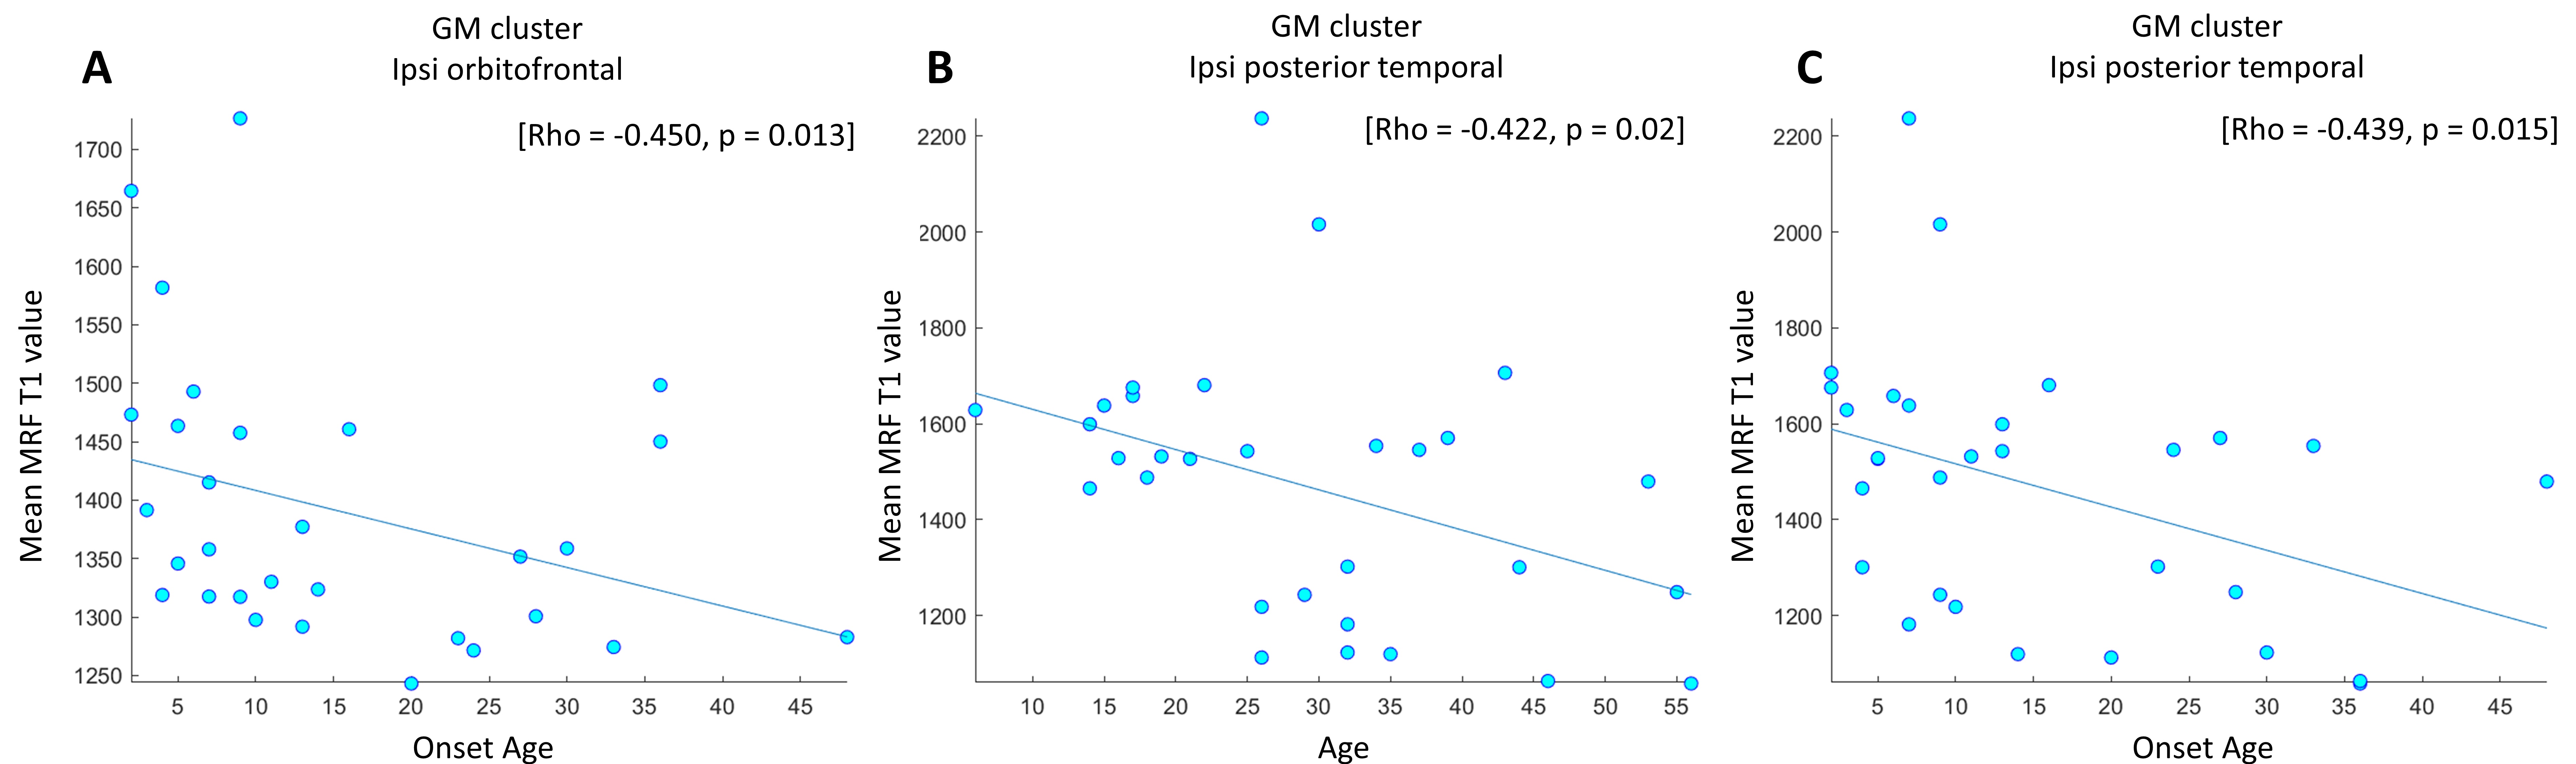
Thirty patients with pharmacoresistant focal epilepsy and negative 3T clinical MRI were included, with median age of 27.5 years (mean ± SD: 29.3 ± 13.07 years), 18 male /12 female. A total of 40 age-and-gender-matched HCs were also included for comparison. As shown in Figure 1, GM clusters that exhibited significant T1 increase in the patient group as compared to the HCs were located in the ipsilateral temporal pole, mesial temporal and superior temporal regions, as well as the ipsilateral orbitofrontal cortex. Meanwhile, significant T1 increase was seen in the WM cluster in the ipsilateral mesial temporal region. No significant findings of T1 decrease were shown in patient group than HCs. Figure 2A-2D shows the ipsilateral mesial temporal clusters (GM and WM), illustrating significantly elevated T1 values in the patient group (P < 0.001 for both clusters). Figure 2E-2F shows the significantly elevated T1 values in the ipsilateral orbitofrontal GM cluster (P < 0.001). T2 did not show significant clusters. Subgroup analysis on the ETLE group (N = 24) against HCs showed consistent patterns with the overall cohort, with a few additional scattered voxels showing significant T1 increase in the ipsilateral insula, basal/posterior lateral temporal regions. There was no significant difference between the TLE patients against the HCs, likely due to the small sample size. Higher T1 values in the orbitofrontal GM cluster were correlated with younger onset age (P = 0.01). Higher T1 values in the cluster located in the ipsilateral posterior temporal GM were correlated with younger age and onset age (P = 0.02 and P = 0.015 respectively, Figure 3).Conclusion
Using high-resolution 3D MRF, we revealed group-level T1 increase in MRI-negative patients, which mainly involved the ipsilateral anterior mesial temporal region and orbitofrontal cortex. These changes suggest potential structural damage in the ipsilateral limbic network in MRI-negative pharmacoresistant focal epilepsy. The ipsilateral predominance of tissue property changes may present an opportunity to lateralize epilepsy. Negative correlation between T1 values and onset age supports the notion that epilepsy is a progressive disorder.Acknowledgements
This study was supported by NIH R01 NS109439 and R21 EB026764.References
1. Ma D, Gulani V, Seiberlich N, et al. Magnetic resonance fingerprinting. Nature. 2013;495(7440):187-192.
2. Ma D, Jones SE, Deshmane A, et al. Development of high-resolution 3D MR fingerprinting for detection and characterization of epileptic lesions. J Magn Reson Imaging. 2019;49(5):1333-1346.
3. Avants B, Gee JC. Geodesic estimation for large deformation anatomical shape averaging and interpolation. Neuroimage. 2004;23(SUPPL. 1): Suppl 1:S139-150.
4. Zhang Y, Brady M, Smith S. Segmentation of brain MR images through a hidden Markov random field model and the expectation-maximization algorithm. IEEE Trans Med Imaging. 2001;20(1):45-57.
5. Smith SM, Nichols TE. Threshold-free cluster enhancement: Addressing problems of smoothing, threshold dependence and localisation in cluster inference. Neuroimage. 2009;44(1):83-98.
Figures