0463
Subject-specific features of excitation/inhibition profiles in neurodegenerative diseases1Brain Connectivity Center, IRCCS Mondino Foundation, Pavia, Italy, 2Brain and Behavioural Sciences, University of Pavia, Pavia, Italy, 3NMR Research Unit, Queen Square Multiple Sclerosis Centre, Department of Neuroinflammation, UCL Queen Square Institute of Neurology, UCL, London, United Kingdom
Synopsis
The Virtual Brain (TVB) is a novel modeling platform to simulate whole-brain dynamics starting from individual structural and functional connectivity. In this work, we performed TVB simulations in neurodegenerative diseases (i.e. Alzheimer’s disease, Frontotemporal Dementia, and Amyotrophic Lateral Sclerosis) providing a unique description of the excitatory/inhibitory balance at single-subject level. TVB-derived biophysical parameters were different among clinical phenotypes, presented an association with neuropsychological domains and improved discriminative power between clinical conditions. Overall, this work suggests a novel TVB-based approach for future personalized diagnosis and therapy in neurodegenerative diseases, providing a subject-specific description of excitation/inhibition profiles.
Introduction
Neurodegenerative diseases like Alzheimer’s disease (AD), Frontotemporal Dementia (FTD) and Amyotrophic Lateral Sclerosis (ALS) are reportedly characterized by a disrupted balance between neuronal excitation and inhibition (E/I)1,2,3 but the E/I experimental determination in single subjects is yet an unresolved issue using clinically feasible MRI acquisitions. Recently, The Virtual Brain (TVB4,5) has provided a modeling platform allowing to simulate whole-brain dynamics from structural (SC) and functional connectivity (FC), which can be used to extract information about the E/I balance in single subjects6. TVB has therefore a high potential to foster personalized and precision medicine. In this work, we exploited TVB capabilities to characterize neurodegenerative pathologies (i.e. AD, FTD, ALS), in terms of personalized E/I profiles that can be correlated with individual neuropsychological scores; we also assessed whether the subject-specific parameters derived from TVB simulations have potential for clinical translation.Methods
Subjects and acquisition: 15 healthy controls (HC) (8 females, 64±11 years), 15 AD patients (6 females, 70±7 years), 15 FTD patients (4 females, 69±7 years) and 15 ALS patients (7 females, 67±8 years) underwent MRI examination using a 3T Siemens Skyra scanner. The protocol included resting-state fMRI (rs-fMRI) (GRE-EPI, TR/TE=3010/20ms; voxel=2.5x2.5x2.5mm3,120 volumes), diffusion-weighted images (SE-EPI, TR/TE=10000/97ms, voxel=2x2x2mm3, 64 diffusion-weighted directions, b=1200s/mm2, 10 b0-images), and 3DT1-weighted volume (MPRAGE, TR/TE/TI=2.3/2.95/900ms, voxel=1.1x1.1x1.2mm3). All subjects underwent a neuropsychological examination based on a standardized battery of tests to assess cognitive domains: attention, memory, language, executive function and visuospatial skills.Preprocessing and tractography: Diffusion-weighted and fMRI images were preprocessed and Whole-brain Anatomically-Constrained Tractography7 was performed estimating fiber orientation distributions with multi-tissue constrained spherical deconvolution and using probabilistic tractography8.
Structural and functional connectivity matrices: SC and FC matrices were estimated from tractography and rs-fMRI time-series of each subject, respectively. An ad-hoc atlas was created combining 93 cerebral (AAL9) (including cortical/subcortical structures) and 31 cerebellar (SUIT10) labels. The parcellation of whole-brain tractography led to the experimental SC matrix containing the normalized number of streamlines as edges and atlas labels as nodes. The time-course of BOLD signals was extracted for each node and the experimental FC matrix was computed correlating time-courses between pairs of nodes with a Fisher-z transformed coefficient thresholded at 0.120611.
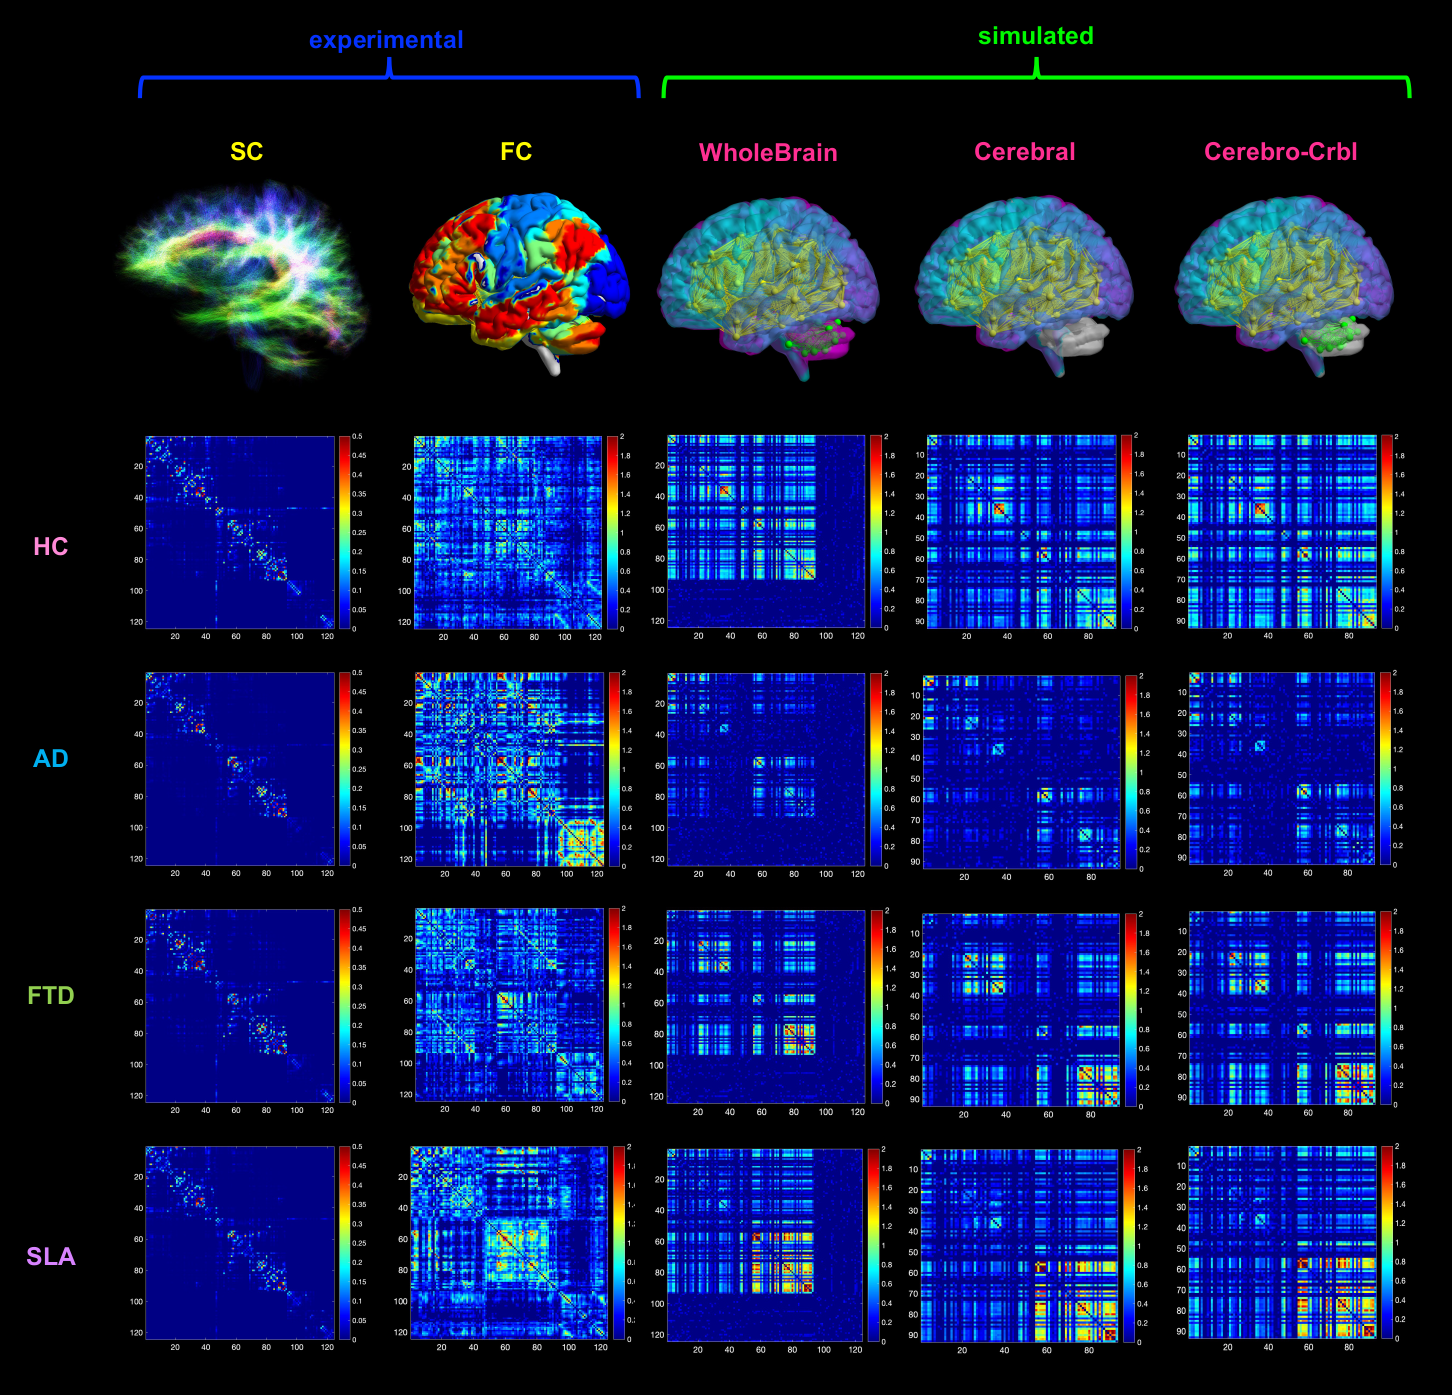
TVB simulation: Individual subject analysis was conducted as described in Figure 1. The Wong-Wang neural mass model12 was chosen to simulate whole-brain dynamics retaining information both on global brain dynamics and local E/I balance. An iterative optimization was performed for global coupling (G), which is a scaling factor denoting long-range coupling strength, and local parameters defining the strength of inhibitory synapses (Ji), the strength of excitatory synapses (JNMDA) and the strength of local excitatory recurrence (w+). These parameters were tuned until the best fit, i.e. the highest Pearson correlation coefficient (PCC), between experimental FC (expFC) and simulated FC (simFC) was achieved. To investigate the impact of the cerebellum on brain dynamics, simulations were performed in three networks: whole-brain (whole-brain SC), cortical subnetwork (only cerebral SC), embedded cerebro-cerebellar subnetwork (evaluating simFC for cerebral nodes considering the influence of cerebro-cerebellar connections) (Fig.2). For each of these three networks PCC between expFC and simFC was computed.
Statistics (SPSS v21): non-parametric tests were used to assess parameters differences among groups (HC, AD, FTD, ALS). A multiple regression analysis was performed to investigate the relationship between individual neuropsychological scores and optimal model parameters. A discriminant analysis was performed using groups as dependent variables and considering as independent variables: (i) model parameters, (ii) neuropsychological scores and (iii) a combination of both. K-mean cluster analysis was performed to reconstruct subjects-specific E/I profiles. General linear model (GLM) was performed to assess PCC differences between networks.
Results
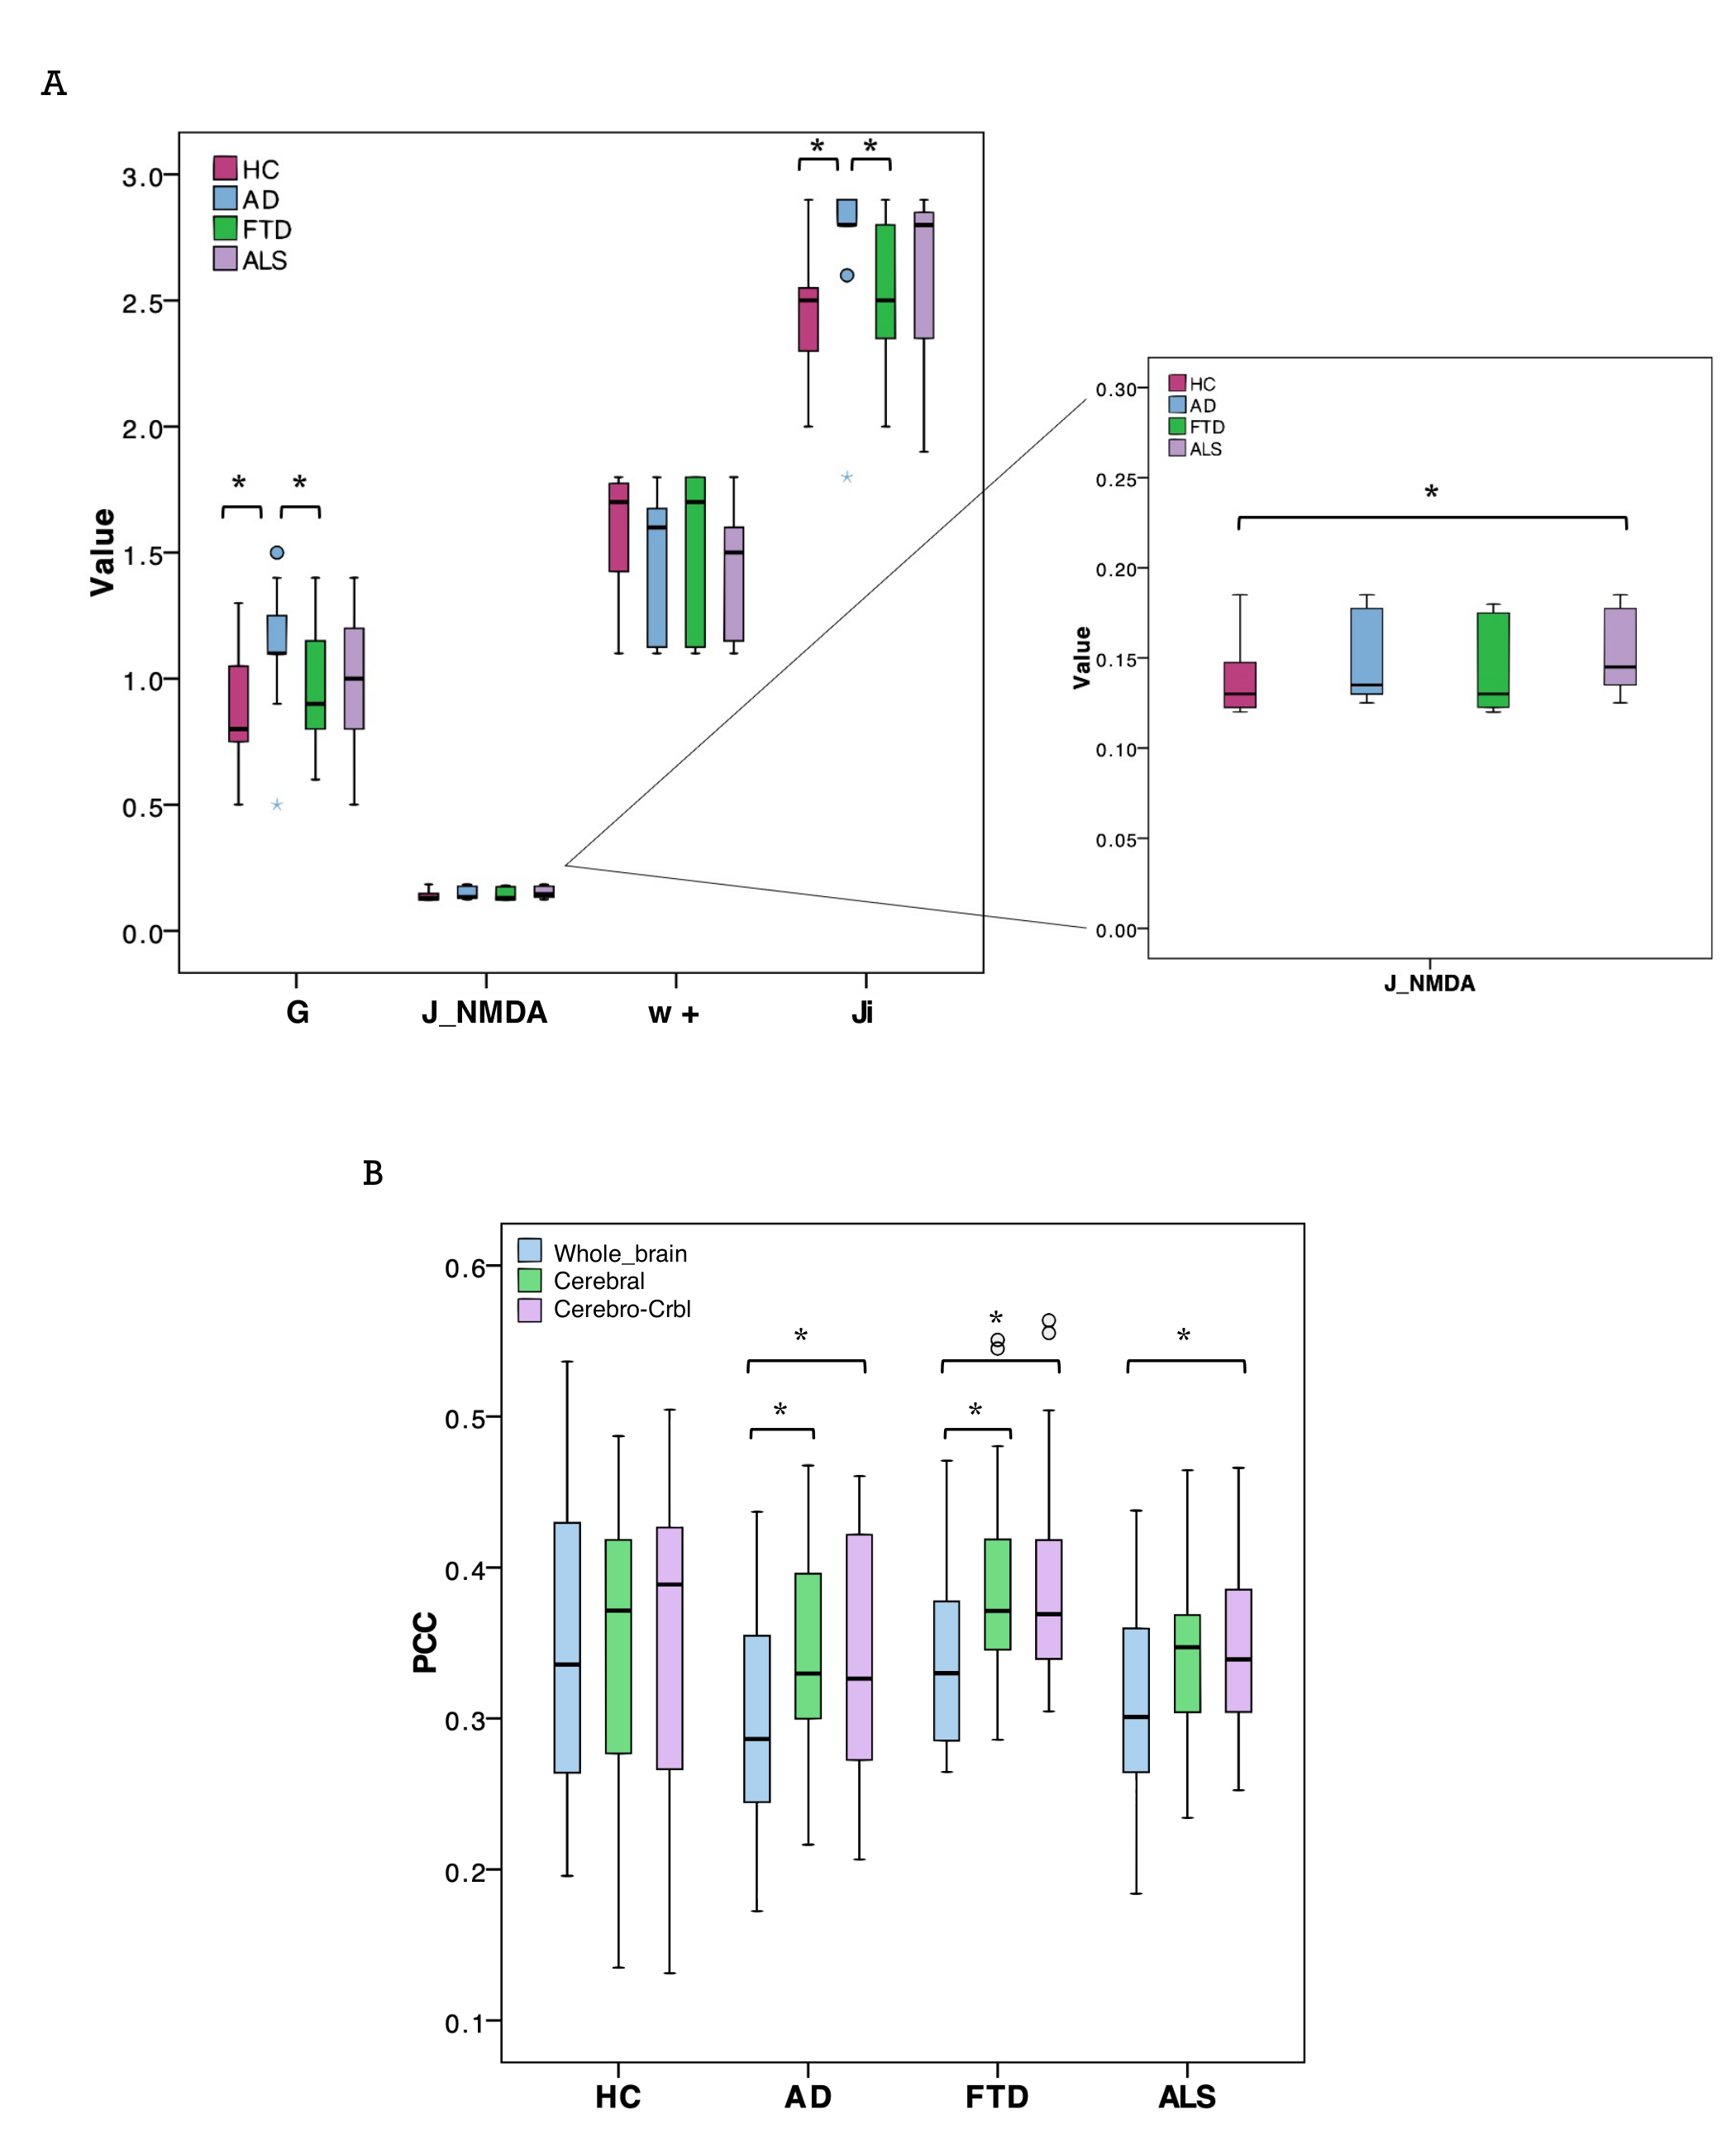
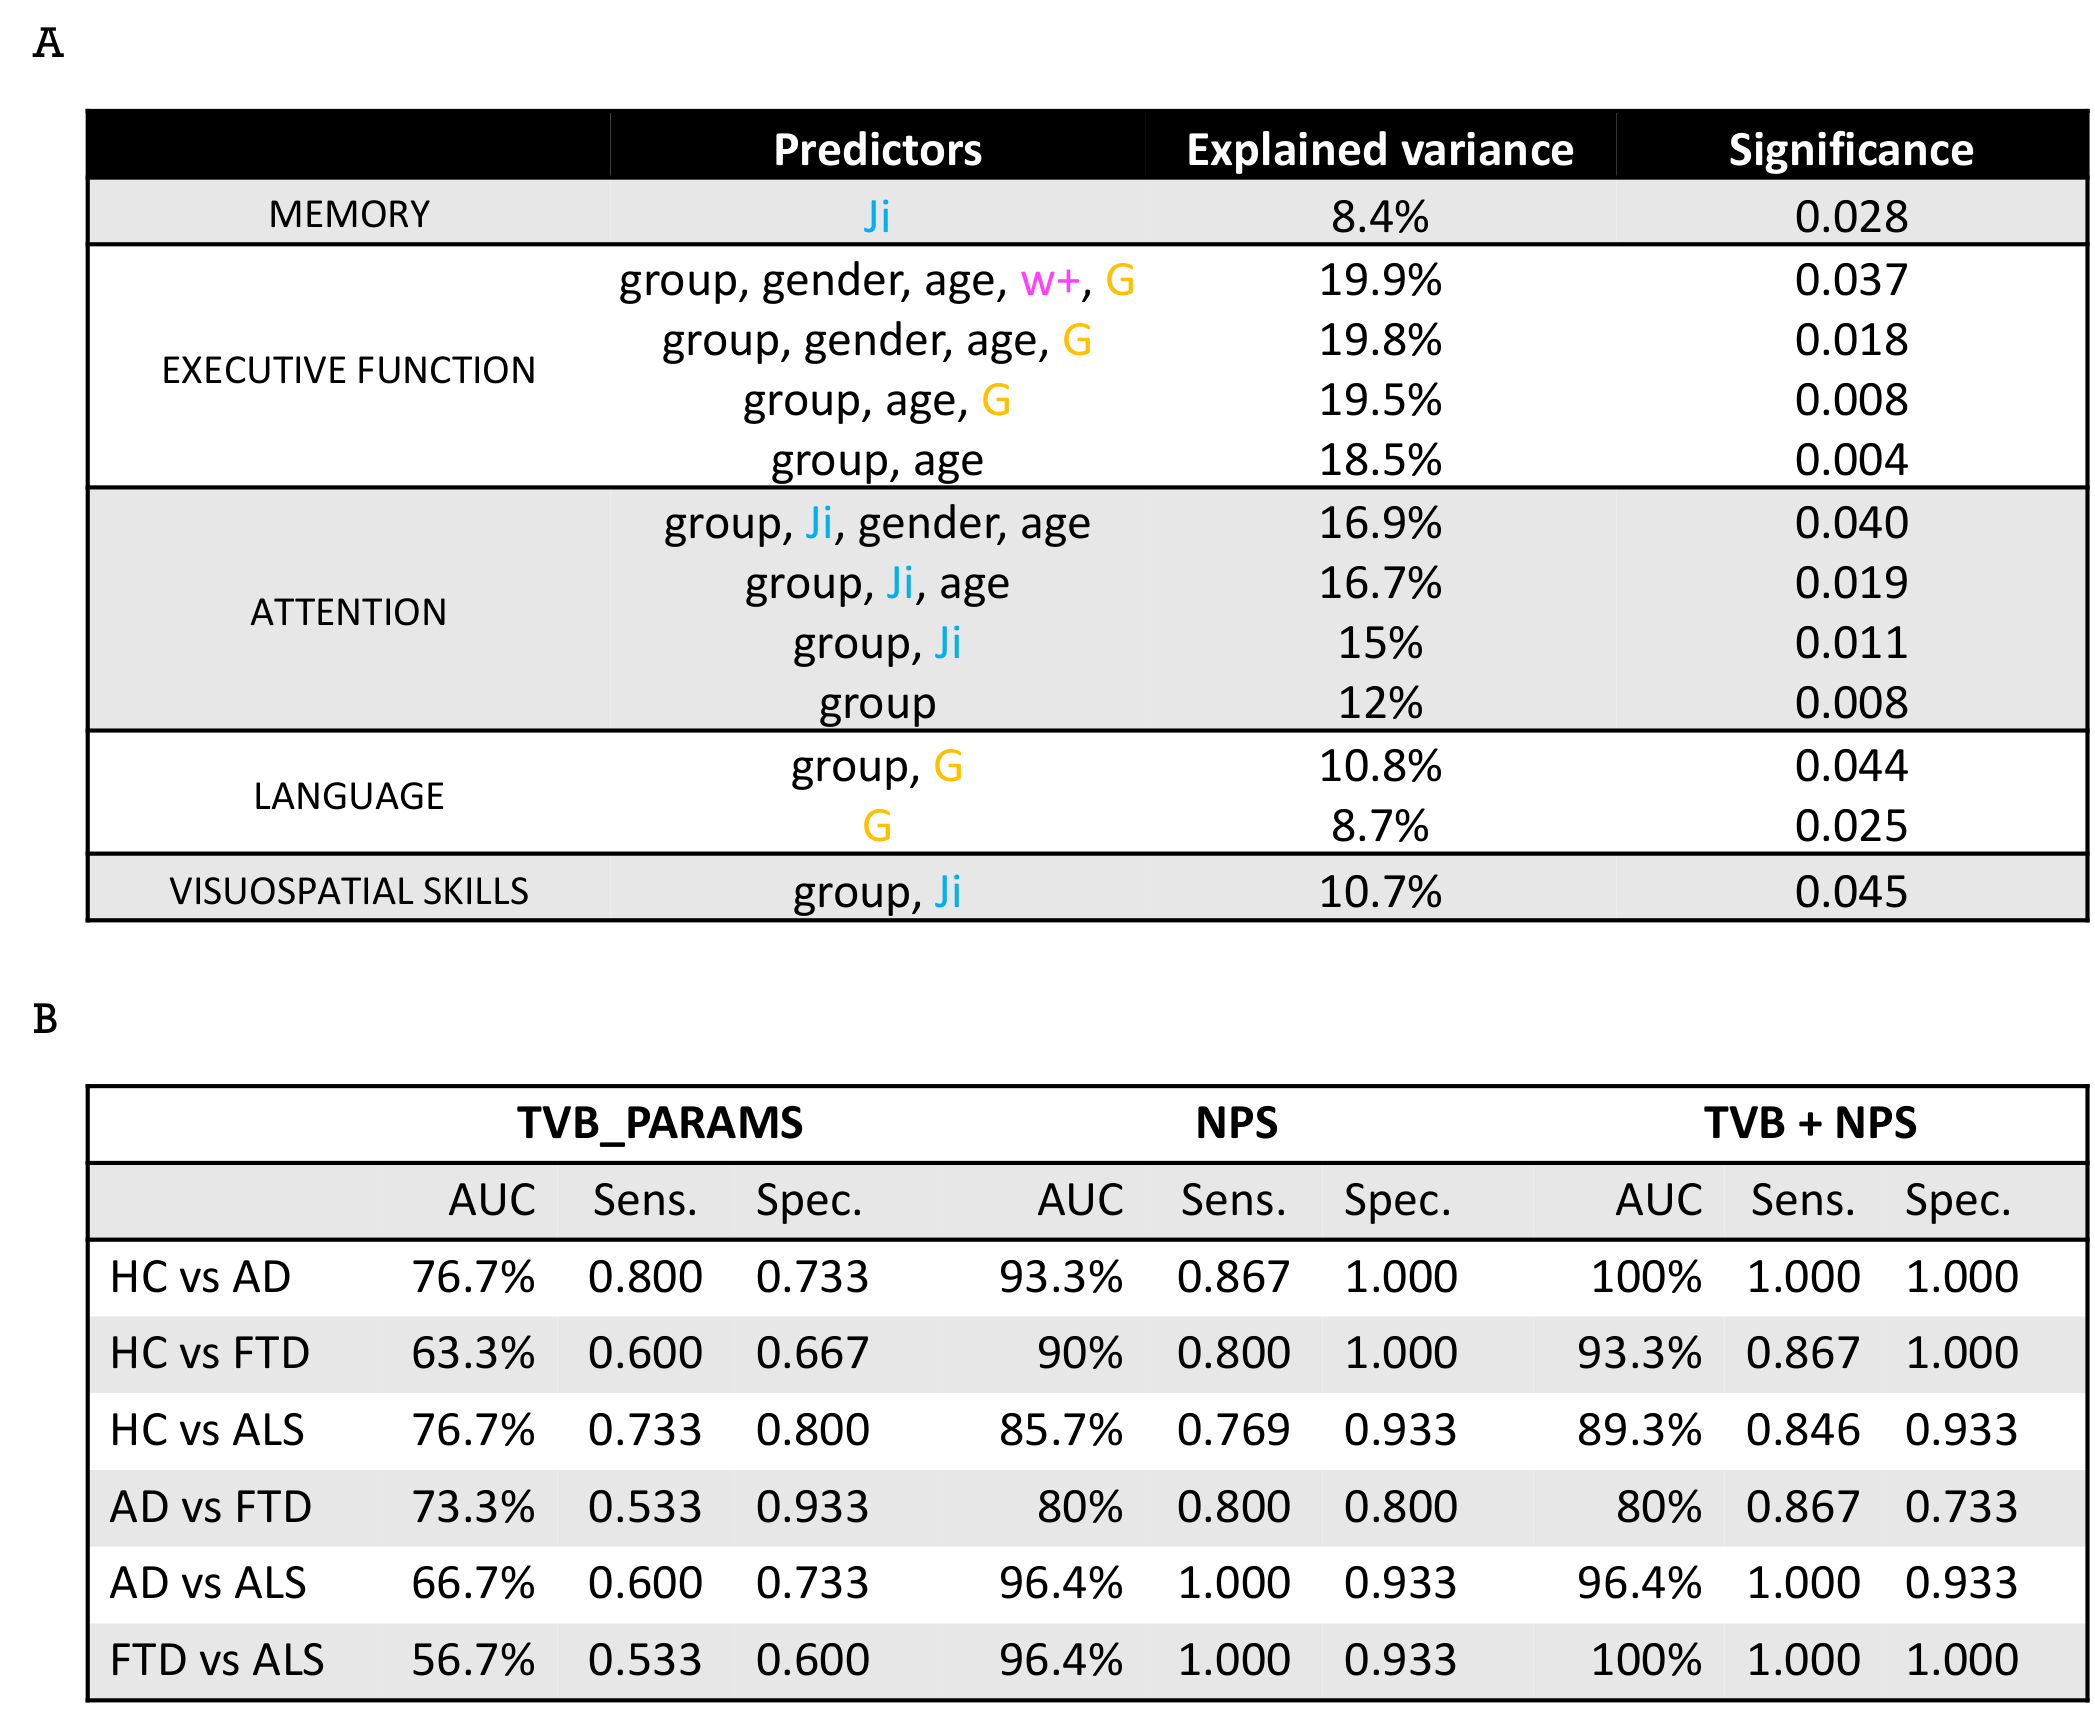
TVB parameters were different between clinical groups and AD patients showed high global coupling (G) and inhibition (Ji) while ALS patients showed strong NMDA receptor-dependent excitation (JNMDA)(Fig.3A). The levels of excitation, inhibition and global coupling significantly contributed to explain the variation of neuropsychological scores in backward regression (Fig.4A), and the combination of TVB parameters with neuropsychological scores in discriminant analysis significantly improved discriminative power, reaching in some cases 100% of accuracy (Fig.4B). Cluster analysis enhanced the heterogeneity of E/I balance across subjects and provided a unique personalized description of the E/I profiles (Fig.5). PCC calculated embedding cerebro-cerebellar connections was higher than PCC obtained with the other two networks in pathologies (Fig.3B).Discussion
Our results revealed that different clinical groups were characterized by specific TVB parameters, providing new clues for the interpretation of neurodegenerative mechanisms. The high global coupling characterizing AD patients might underlie the hypersynchrony of disrupted networks, high Ji values support GABAergic dysfunction in AD pathogenesis and increased JNMDA in ALS patients underpins cortical hyperexcitability compared to controls. Beside a novel analysis of pathological differences between neurodegenerative diseases, TVB parameters were associated with subjects’ cognitive performance and contributed to achieve an extremely high discrimination power when combined with neuropsychological scores. Cluster analysis provided a unique subject-specific description of E/I profiles and the integration of cerebro-cerebellar connections in TVB improved the predictive power of the model in neurodegeneration. Overall, this work supports the cerebellar involvement in neurodegenerative diseases, reveals differences in the E/I balance of individual patients and suggests a novel TVB-based approach for future personalized diagnosis and therapy.Acknowledgements
This work was performed at the IRCCS Mondino Foundation and was supported by the Italian Ministry of Health (RC2020). This research received funding by H2020 Research and Innovation Action Grants Human Brain Project 785907 and 945539 (SGA2 and SGA3) and by the MNL Project “Local Neuronal Microcircuits” of the Centro Fermi (Rome, Italy) to ED and FP. CGWK received funding from the UK MS Society (#77), Wings for Life (#169111), Horizon2020 (CDS-QUAMRI, #634541), BRC (#BRC704/CAP/CGW). We acknowledge Alfredo Costa, Paolo Vitali, Anna Pichiecchio and Viktor Jirsa for ongoing support.References
- Maestú F, de Haan W, Busche MA, DeFelipe J (2021) Neuronal excitation/inhibition imbalance: core element of a translational perspective on Alzheimer pathophysiology. Ageing Res Rev 69:101372
- Benussi A, Alberici A, Buratti E, Ghidoni R, Gardoni F, Luca M Di, Padovani A, Borroni B (2019) Toward a glutamate hypothesis of frontotemporal dementia. Front Neurosci 13:1–9.
- Pradhan J, Bellingham MC (2021) Neurophysiological mechanisms underlying cortical hyper-excitability in amyotrophic lateral sclerosis: A review. Brain Sci 11.
- Sanz-Leon P, Knock SA, Spiegler A, Jirsa VK (2015) Mathematical framework for large-scale brain network modeling in The Virtual Brain. Neuroimage 111:385–430
- Sanz-Leon P, Knock SA, Woodman MM, Domide L, Mersmann J, Mcintosh AR, Jirsa V (2013) The virtual brain: A simulator of primate brain network dynamics. Front Neuroinform 7.
- Zimmermann J, Perry A, Breakspear M, Schirner M, Sachdev P, Wen W, Kochan NA, Mapstone M, Ritter P, McIntosh AR, Solodkin A (2018) Differentiation of Alzheimer’s disease based on local and global parameters in personalized Virtual Brain models. NeuroImage Clin 19:240–251.
- Smith RE, Tournier JD, Calamante F, Connelly A (2012) Anatomically-constrained tractography: Improved diffusion MRI streamlines tractography through effective use of anatomical information. Neuroimage 62:1924–1938
- Tournier JD, Calamante F, Connelly A (2012) MRtrix: Diffusion tractography in crossing fiber regions. Int J Imaging Syst Technol 22:53–66.
- Tzourio-Mazoyer, N., Landeau, B., Papathanassiou, D., Crivello, F., Etard, O., Delcroix, N., et al. (2002). Automated anatomical labeling of activations in SPM using a macroscopic anatomical parcellation of the MNI MRI single-subject brain. Neuroimage 15, 273–289.
- Diedrichsen J, Balsters JH, Flavell J, Cussans E, Ramnani N (2009) A probabilistic MR atlas of the human cerebellum. Neuroimage 46:39–46
- Palesi F, Lorenzi RM, Casellato C, Ritter P, Jirsa V, Wheeler-kingshott CAMG, Angelo ED (2020) The Importance of Cerebellar Connectivity on Simulated Brain Dynamics. Front Cell Neurosci 14:1–11.
- Deco G, Ponce-Alvarez A, Hagmann P, Romani GL, Mantini D, Corbetta M (2014) How local excitation-inhibition ratio impacts the whole brain dynamics. J Neurosci 34:7886–7898.
Figures