0462
Functional eigenvector centrality dynamics are related to amyloid deposition in preclinical Alzheimer’s Disease
Luigi Lorenzini1, Ingala Silvia1, Lyduine E Collij1, Betty Tijms2, Henk JMM Mutsaerts 1,3, Viktor Wottschel 1, Sven Haller4,5, Kaj Blennow 6,7, Giovanni Frisoni8,9, Gael Chételat 10, Pierre Payoux 11,12, Pablo Lage-Martinez 13, Adam Waldman 14,15, Joanna Wardlaw 14,16, Craig Ritchie17, Juan Domingo Gispert 18,19,20,21, Pieter Jelle Visser 2,22,23, Philip Scheltens 2, Barkhof Frederik1, and Alle Meije Wink 1
1Dept. of Radiology and Nuclear Medicine, Amsterdam University Medical Centre, Vrije Universiteit, Amsterdam Neuroscience, Amsterdam, The Netherlands, Amsterdam, Netherlands, 2Department of Neurology, Alzheimer Center Amsterdam, Amsterdam Neuroscience, Vrije Universiteit Amsterdam, Amsterdam UMC, Amsterdam, the Netherlands, Amsterdam, Netherlands, 3Ghent Institute for Functional and Metabolic Imaging (GIfMI), Ghent University, Ghent, Belgium, Ghent, Belgium, 4CIRD Centre d’Imagerie Rive Droite, Geneva, Switzerland, Geneva, Switzerland, 5Department of Surgical Sciences, Radiology, Uppsala University, Uppsala, Sweden, Uppsala, Sweden, 6Department of Psychiatry and Neurochemistry, Institute of Neuroscience and Physiology, the Sahlgrenska Academy at the University of Gothenburg, Sweden, Gothenburg, Sweden, 7Clinical Neurochemistry Laboratory, Sahlgrenska University Hospital, Mölndal, Sweden, Mölndal, Sweden, 8aboratory Alzheimer’s Neuroimaging & Epidemiology, IRCCS Istituto Centro San Giovanni di Dio Fatebenefratelli, Brescia, Italy, Brescia, Italy, 9University Hospitals and University of Geneva, Geneva, Switzerland, Geneva, Switzerland, 10Université de Normandie, Unicaen, Inserm, U1237, PhIND "Physiopathology and Imaging of Neurological Disorders", institut Blood-and-Brain @ Caen-Normandie, Cyceron, 14000 Caen, France, Caen, France, 11Department of Nuclear Medicine, Toulouse CHU, Purpan University Hospital, Toulouse, France, Toulouse, France, 12Toulouse NeuroImaging Center, University of Toulouse, INSERM, UPS, Toulouse, France, Toulouse, France, 13Centro de Investigación y Terapias Avanzadas, Neurología, CITA‐Alzheimer Foundation, San Sebastián, Spain, San Sebastián, Spain, 14Centre for Clinical Brain Sciences, The University of Edinburgh, Edinburgh, UK, Edinburgh, Scotland, 15Department of Medicine, Imperial College London, London, UK, London, United Kingdom, 16UK Dementia Research Institute at Edinburgh, University of Edinburgh, UK, Edinburgh, Scotland, 17Centre for Dementia Prevention, The University of Edinburgh, Scotland, UK, Edinburgh, Scotland, 18Barcelonaβeta Brain Research Center (BBRC), Pasqual Maragall Foundation, Barcelona, Spain, Barcelona, Spain, 19CIBER Bioingeniería, Biomateriales y Nanomedicina (CIBER-BBN), Madrid, Spain, Madrid, Spain, 20IMIM (Hospital del Mar Medical Research Institute), Barcelona Spain, Barcelona, Spain, 21Universitat Pompeu Fabra, Barcelona, Spain, Barcelona, Spain, 22Alzheimer Center Limburg, Department of Psychiatry & Neuropsychology, School of Mental Health and Neuroscience, Maastricht University, Maastricht, The Netherlands, Maastricht, Netherlands, 23Division of Neurogeriatrics, Department of Neurobiology, Care Sciences and Society, Karolinska Institutet, Stockholm, Sweden, Stockholm, Sweden
1Dept. of Radiology and Nuclear Medicine, Amsterdam University Medical Centre, Vrije Universiteit, Amsterdam Neuroscience, Amsterdam, The Netherlands, Amsterdam, Netherlands, 2Department of Neurology, Alzheimer Center Amsterdam, Amsterdam Neuroscience, Vrije Universiteit Amsterdam, Amsterdam UMC, Amsterdam, the Netherlands, Amsterdam, Netherlands, 3Ghent Institute for Functional and Metabolic Imaging (GIfMI), Ghent University, Ghent, Belgium, Ghent, Belgium, 4CIRD Centre d’Imagerie Rive Droite, Geneva, Switzerland, Geneva, Switzerland, 5Department of Surgical Sciences, Radiology, Uppsala University, Uppsala, Sweden, Uppsala, Sweden, 6Department of Psychiatry and Neurochemistry, Institute of Neuroscience and Physiology, the Sahlgrenska Academy at the University of Gothenburg, Sweden, Gothenburg, Sweden, 7Clinical Neurochemistry Laboratory, Sahlgrenska University Hospital, Mölndal, Sweden, Mölndal, Sweden, 8aboratory Alzheimer’s Neuroimaging & Epidemiology, IRCCS Istituto Centro San Giovanni di Dio Fatebenefratelli, Brescia, Italy, Brescia, Italy, 9University Hospitals and University of Geneva, Geneva, Switzerland, Geneva, Switzerland, 10Université de Normandie, Unicaen, Inserm, U1237, PhIND "Physiopathology and Imaging of Neurological Disorders", institut Blood-and-Brain @ Caen-Normandie, Cyceron, 14000 Caen, France, Caen, France, 11Department of Nuclear Medicine, Toulouse CHU, Purpan University Hospital, Toulouse, France, Toulouse, France, 12Toulouse NeuroImaging Center, University of Toulouse, INSERM, UPS, Toulouse, France, Toulouse, France, 13Centro de Investigación y Terapias Avanzadas, Neurología, CITA‐Alzheimer Foundation, San Sebastián, Spain, San Sebastián, Spain, 14Centre for Clinical Brain Sciences, The University of Edinburgh, Edinburgh, UK, Edinburgh, Scotland, 15Department of Medicine, Imperial College London, London, UK, London, United Kingdom, 16UK Dementia Research Institute at Edinburgh, University of Edinburgh, UK, Edinburgh, Scotland, 17Centre for Dementia Prevention, The University of Edinburgh, Scotland, UK, Edinburgh, Scotland, 18Barcelonaβeta Brain Research Center (BBRC), Pasqual Maragall Foundation, Barcelona, Spain, Barcelona, Spain, 19CIBER Bioingeniería, Biomateriales y Nanomedicina (CIBER-BBN), Madrid, Spain, Madrid, Spain, 20IMIM (Hospital del Mar Medical Research Institute), Barcelona Spain, Barcelona, Spain, 21Universitat Pompeu Fabra, Barcelona, Spain, Barcelona, Spain, 22Alzheimer Center Limburg, Department of Psychiatry & Neuropsychology, School of Mental Health and Neuroscience, Maastricht University, Maastricht, The Netherlands, Maastricht, Netherlands, 23Division of Neurogeriatrics, Department of Neurobiology, Care Sciences and Society, Karolinska Institutet, Stockholm, Sweden, Stockholm, Sweden
Synopsis
Recent evidence suggests that amyloid deposition in the brain follows — and subsequently affects — temporal variability of neuronal activity and functional connectivity. Temporal variability in functional brain network properties connote changes in participation of functional hubs in different subnetworks. We confirm previous findings of alterations of functional eigenvector centrality (EC) in relation to amyloid, and demonstrate that those regions show altered dynamic EC profiles with lower variability over time, hence lower network integration.
Introduction
Initial amyloid β accumulation in Alzheimer’s disease (AD) occurs predominantly in highly connected brain regions and is associated with functional connectivity (FC) alterations in its early stages1. It has been proposed that, in normal functioning networks, brain areas showing high FC on a long time scale — hereafter static FC — may show greater variability — hereafter dynamic FC — in order to support flexibility of such brain areas to participate in multiple subnetworks2–4. We hypothesize that amyloid accumulation in functional hub regions may impair short time scale FC dynamics. We studied this hypothesis in non-demented individuals from the European Prevention of Alzheimer’s Dementia (EPAD) cohort study5. We used eigenvector centrality (EC) measures, which allow the reliable identification of hub regions in functional brain networks6,7.Methods
Data were drawn from the v1500.0 data release of EPAD cohort study5, including baseline data of the first 1500.0 participants consented in the study. Inclusion criteria were age above 50 years and no diagnosis of dementia (Clinical Dementia Rating < 1)8. We selected 736 individuals of which we had cerebrospinal fluid (CSF) samples, cognitive test data, 3D T1-weighted and resting-state functional MRI data available. CSF Aβ1-42 levels <1000 pg/mL were defined as amyloid positive (A+)9. Voxel-wise eigenvector centrality (EC) was computed for the whole fMRI time series (200 timepoints) — static EC (long time-scale) — and within partially overlapping sliding windows of 100 time points — dynamic EC (short time-scale). Static EC differences between amyloid positive (A+) and negative (A-) participants were assessed using a general linear model. Dynamics of short time scale EC were determined by the 1) standard deviation (SD) of EC values across time windows and 2) minimum and maximum EC range across time windows. These dynamic properties were compared between A+ and A- participants within clusters of significant static EC differences, and within 10 canonical resting-state networks (RSN)10. Eventually, we used linear models to determine interaction effects between amyloid status and cognitive performance on dynamic EC variability in RSNs. Processing and analysis pipelines are illustrated in Figure 1.Results
35 participants were excluded because of motion artifacts, resulting in N=701 participants. Mean age was 64.6±7.0 and 409 participants (58.3%) were female. Mean MMSE score was 28.7±1.53 and 120 (15.7%) participants had a CDR of 0.5. 232 (33.1%) participants were classified as A+. Worse cognitive performance was observed in the A+ group, with a higher percentages of participants having CDR = 0.5, and lower average score in the RBANS total scale, sum of index and attention index (all p <0.01). A+ participants showed lower static EC values in a parietal and an occipital cluster, and higher EC values at a long time scale in a medio-frontal cluster (Figure 2). When comparing the dynamic EC properties in the medio-frontal cluster, A+ participants showed lower EC variability than A- individuals (Figure 3). The default mode network (Figure 4) and the dorsal visual networks of A+ participants also showed lower dynamic EC variability (p < 0.001). EC dynamic properties in the DMN and dorsal visual networks were distinctively associated with cognitive performance in the A- and A+ groups, with the lowest variability found in A+ participants with good cognitive scores (Figure 5).Discussion
We found that static EC at a long time scale was altered in participants at risk of developing AD, which is in line with previous findings. Moreover, our findings suggest that dynamic properties at shorter time scales explain these disruptions. The observed EC temporal pattern alterations might reflect reduced involvement of functional hubs in different network dynamics, therefore decreasing functional integration, and explaining cognitive deterioration. We hypothesize that dynamic EC is a meaningful early biomarker of the interplay between early amyloid proteinopathy and cognitive decline.Acknowledgements
No acknowledgement found.References
9. Ingala, S. et al. Application of the ATN classification scheme in a population without dementia: Findings from the EPAD cohort. Alzheimer’s & Dementia (2021) doi:10.1002/alz.12292.
10. Smith, S. M. et al. Correspondence of the brain’s functional architecture during activation and rest. Proceedings of the National Academy of Sciences vol. 106 13040–13045 (2009).Figures

Figure 1. Static and dynamic fastECM pipeline. From the pre-processed rs-fMRI BOLD time series (upper row) static ECM is first computed at the voxel level on the frame-wise voxel by voxel correlation matrix (A). Subsequently, ECM is performed within partially overlapping sliding windows used to segment the fMRI time series (B). Dynamic ECM time series were then extracted for the clusters showing statistical significant differences in the static EC analysis (C) and within resting-state networks.
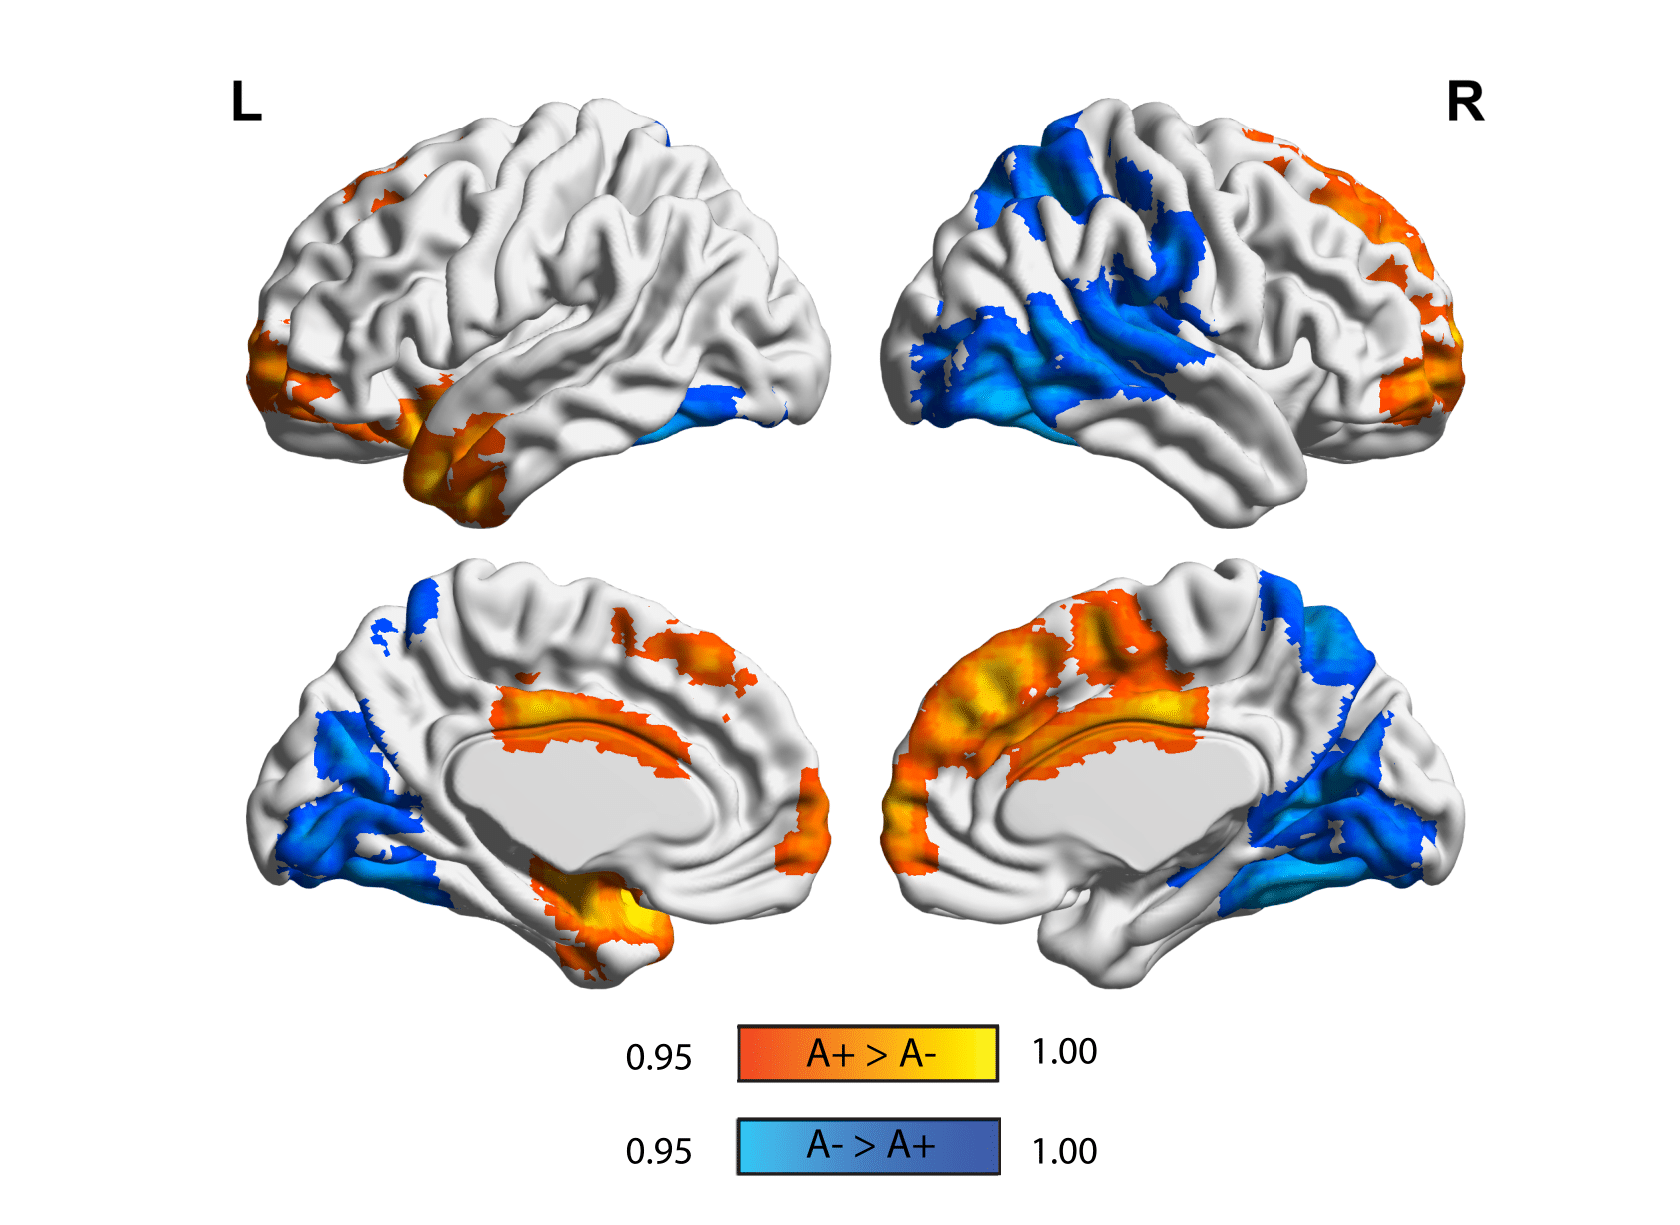
Figure 2. Static eigenvector centrality differences in amyloid groups. Surface plots of p-values in statistical significant clusters. Orange clusters show regions where ECM A+> A- and blue shows regions where ECM A->A+. P values are displayed as 1-P images, where values above 0.95 are significant per P<0.05, and values closer to 1 are the most significant. Upper row is the lateral view, lower row is the medial view, for the left hemisphere (left column) and right hemisphere (right column), respectively.
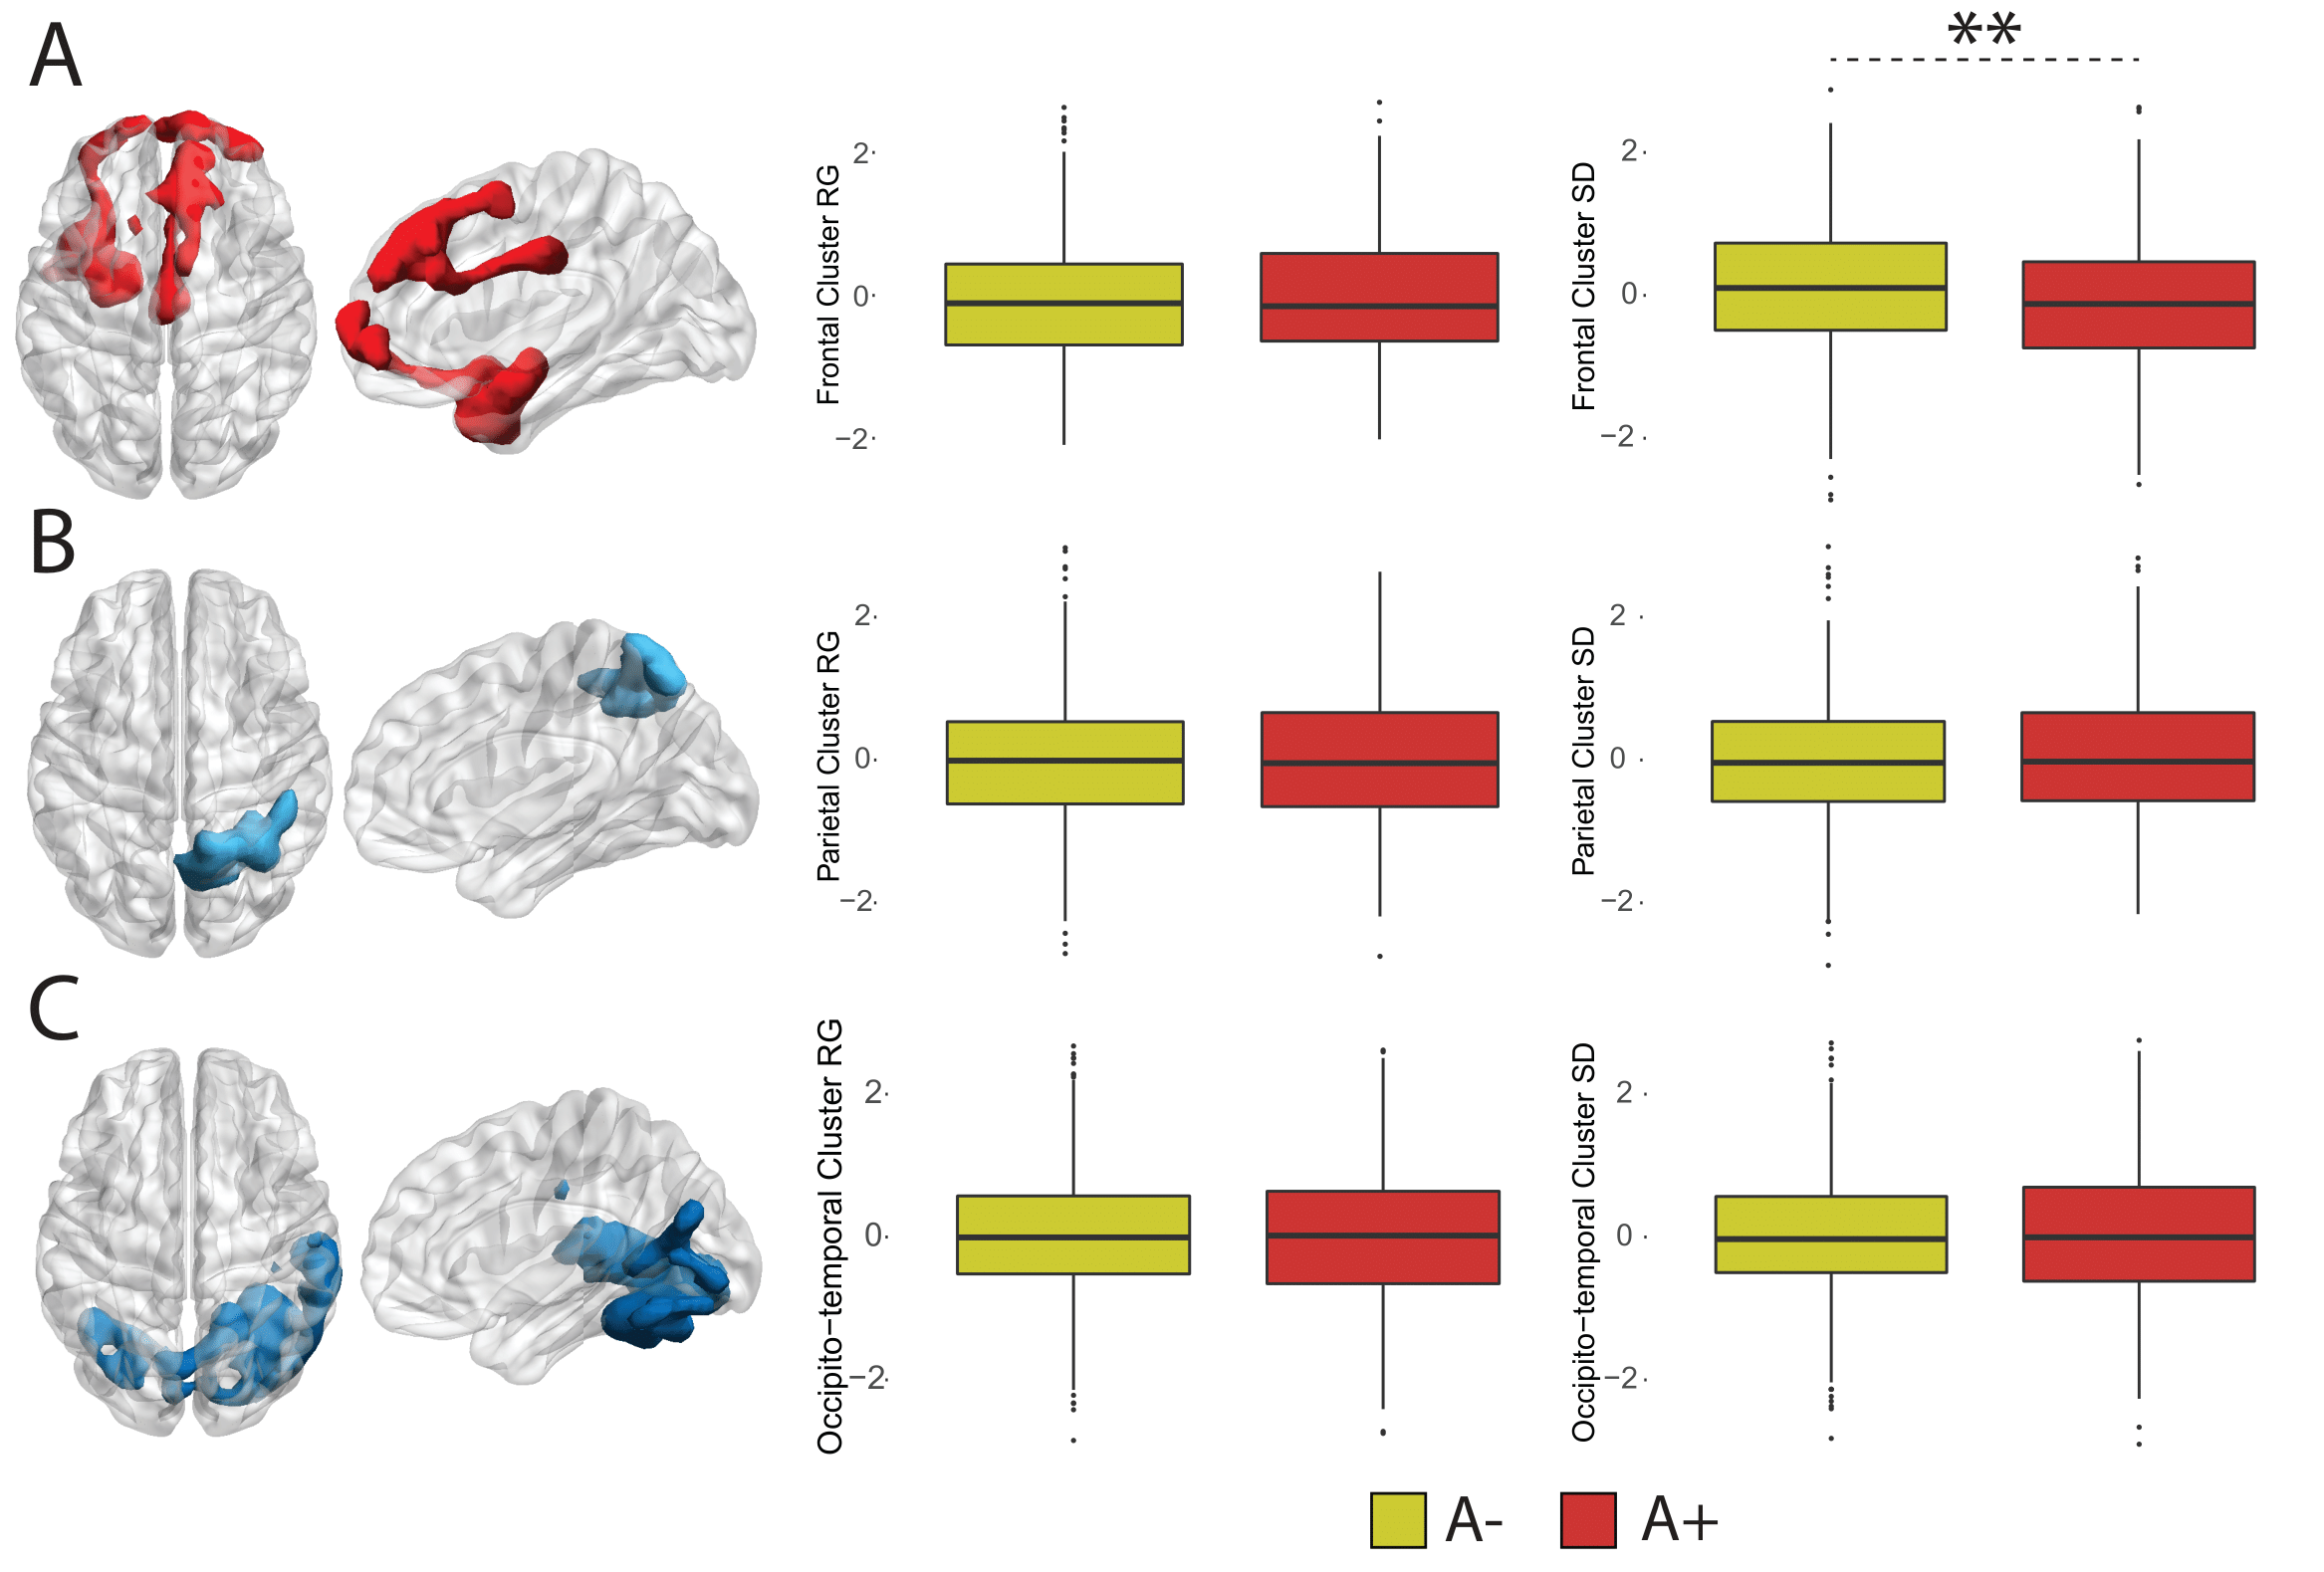
Figure 3. Dynamic EC variability measured within static clusters. Rendering of statistically significant clusters from the static EC analysis and differences in within-cluster dynamic EC standard deviation and range for the frontotemporal (A), parietal (B) and occipito-temporal (C) clusters.
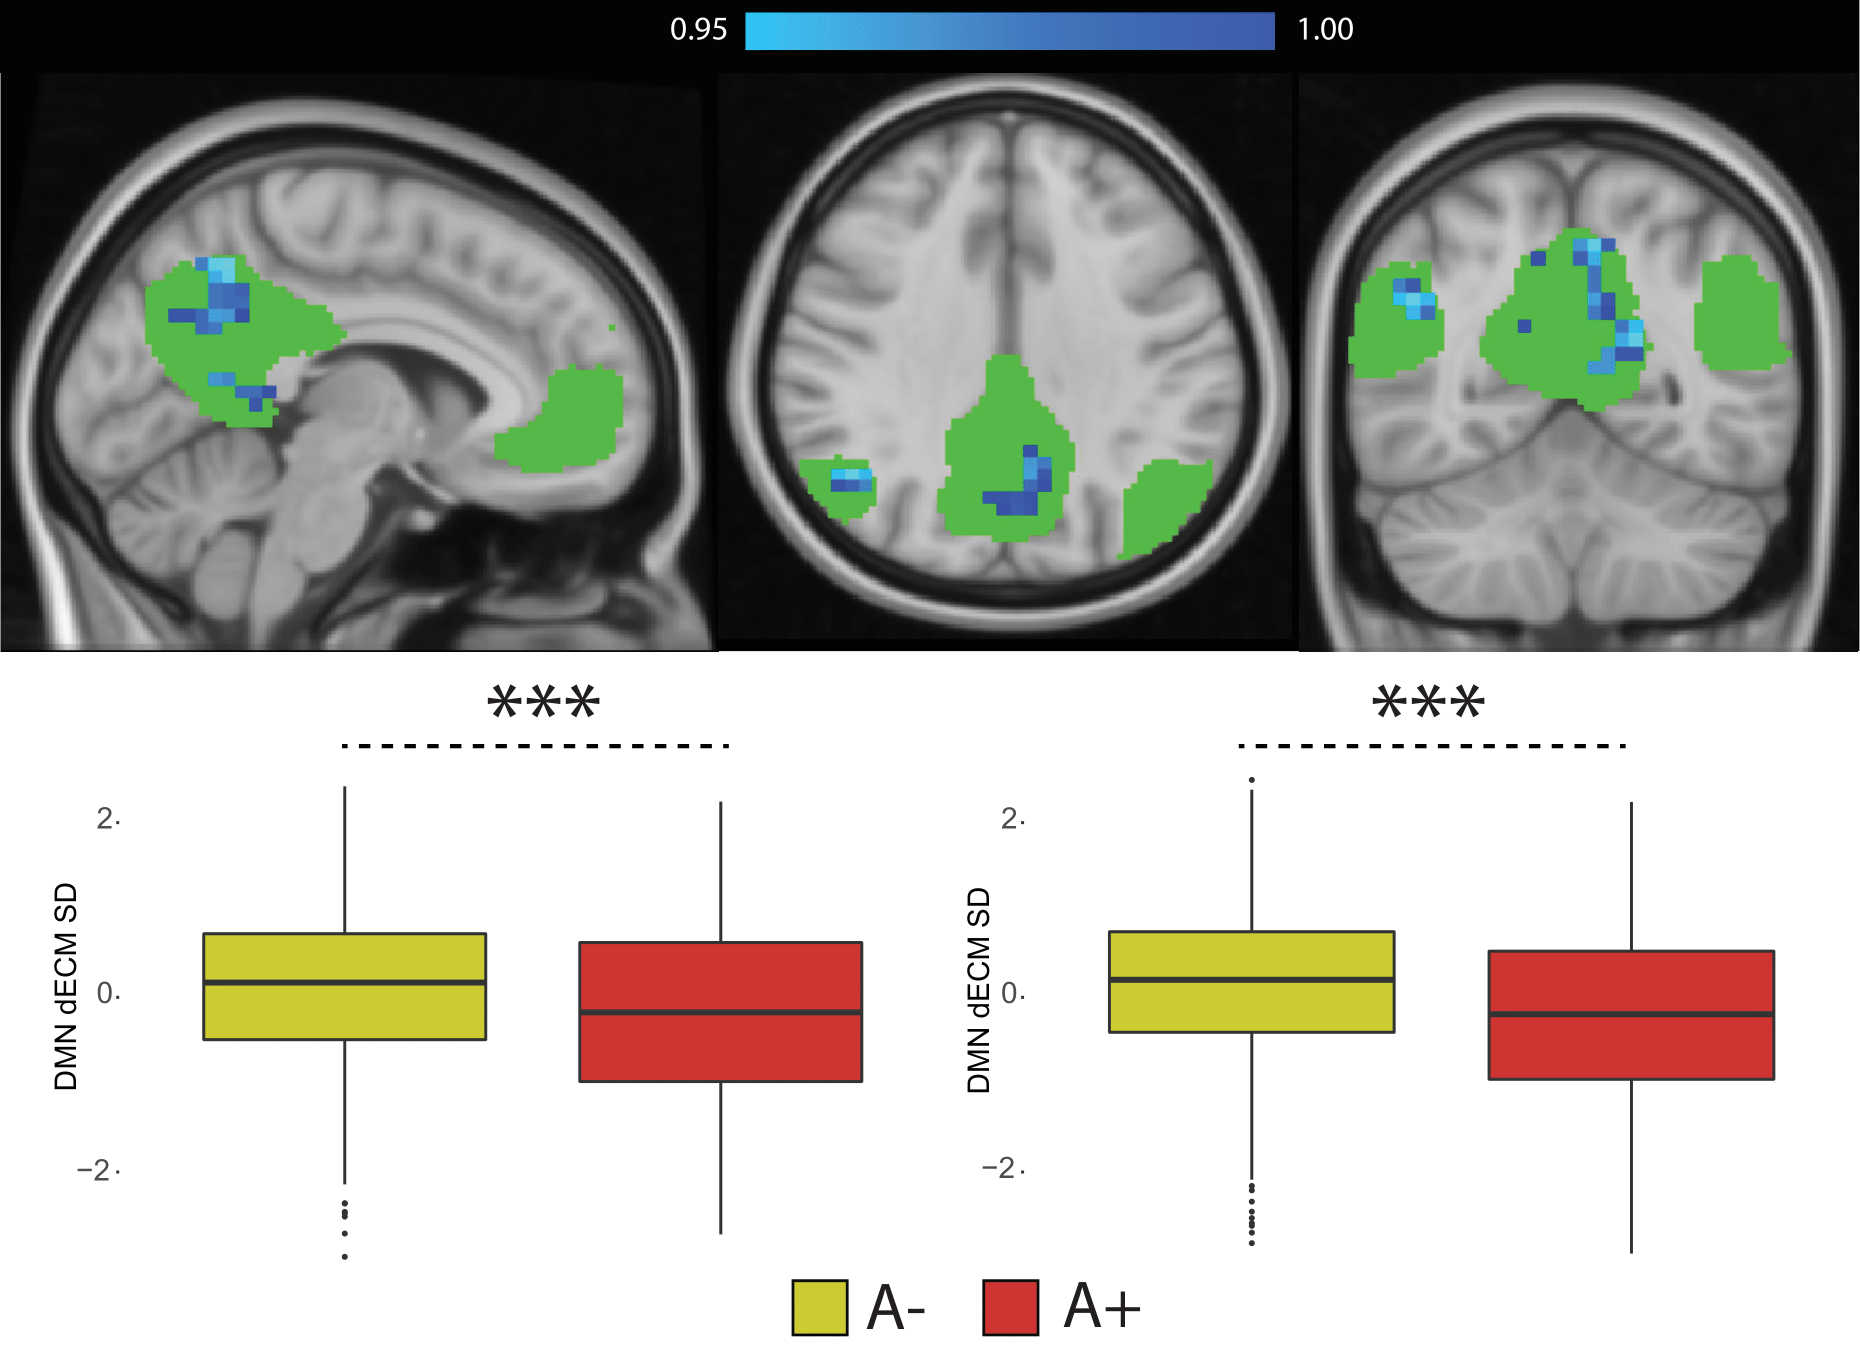
Figure 4. Dynamic eigenvector centrality in the Default Mode Network. Top-row: statistical significant differences showing lower EC dynamics in amyloid positive participants (in blue). P values are reported as 1-P images, where values above 0.95 are significant per P<0.05, and values closer to 1 are the most significant; Bottom-row: Differences in dynamic EC standard deviation (left) and range (right) within the DMN between amyloid positive (A+) and amyloid negative (A-) participants. Abbreviations: dECM = dynamic eigenvector centrality; SD = standard deviation; RG = range.
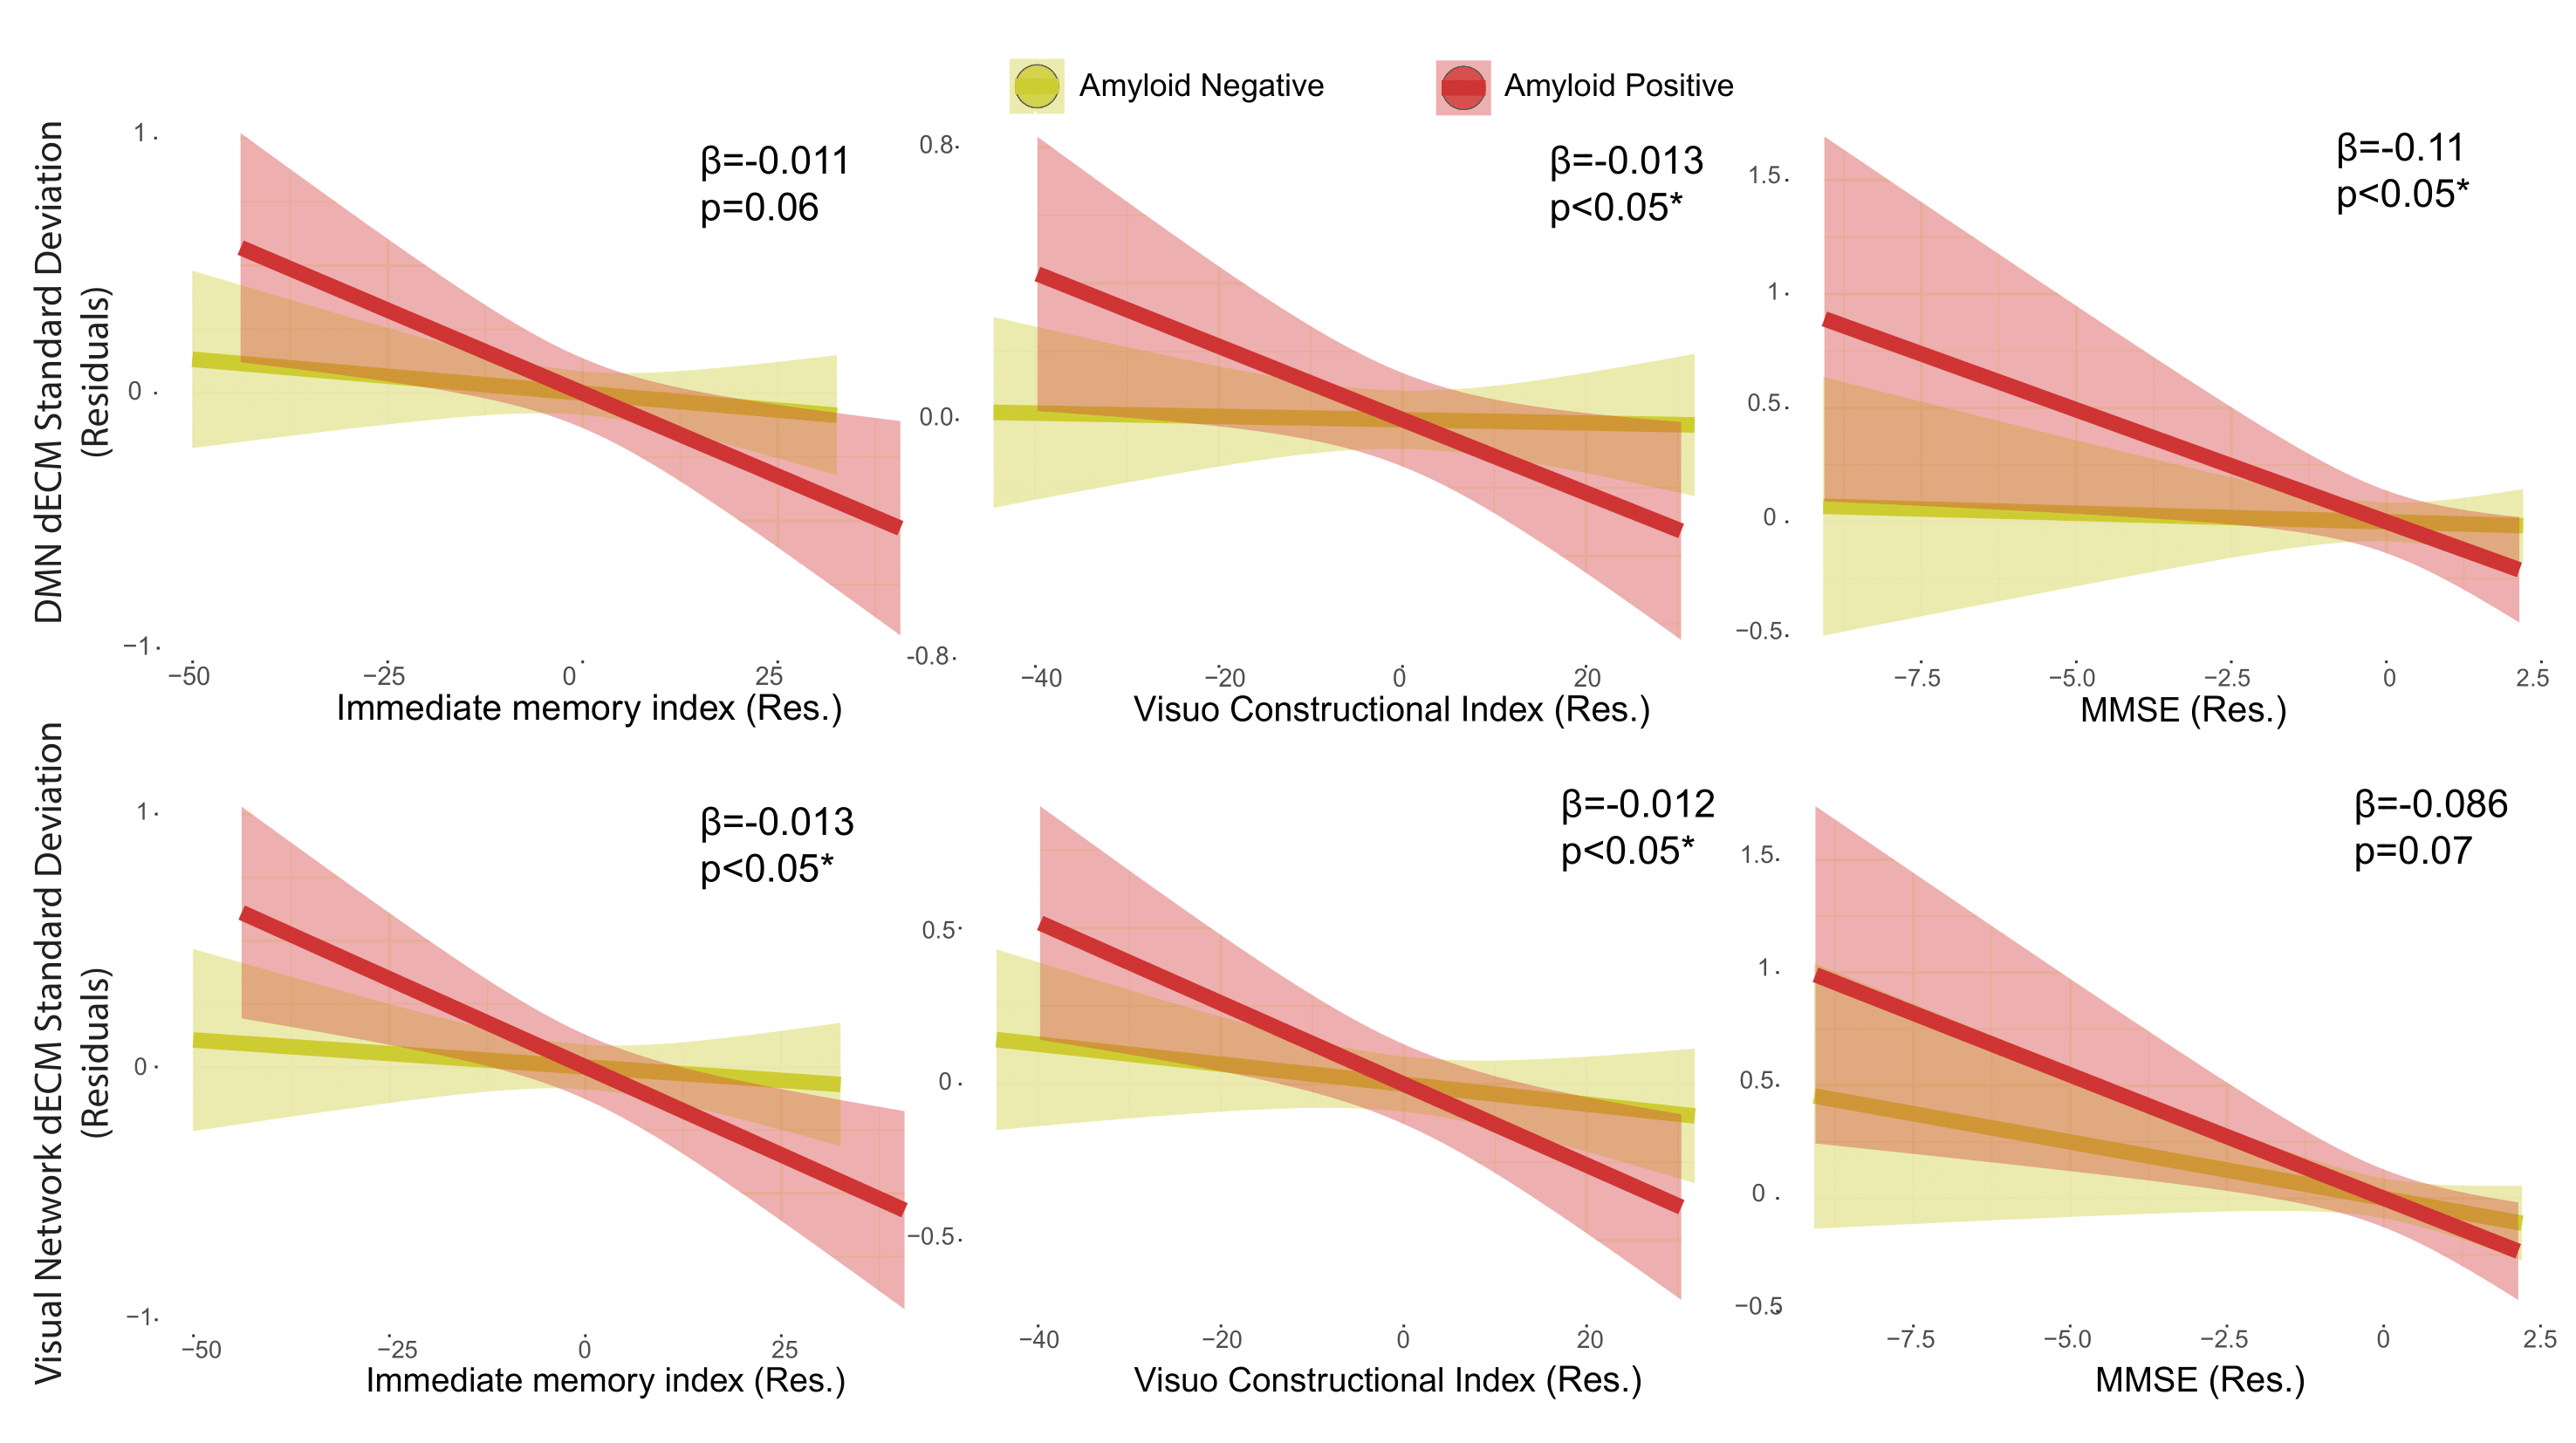
Figure 5. Relation between cognitive performance and dynamic EC temporal variability in the default mode and visual networks in the amyloid groups. The RBANS immediate memory index and visuo-constructional index, and the MMSE score showed significant interactions between amyloid status and cognitive scores on networks dynamic centrality variability measures (SD and range). Residuals of the linear models after correcting for age, sex and education are shown. Abbreviations: dECM = dynamic eigenvector centrality mapping; Res = residuals.
DOI: https://doi.org/10.58530/2022/0462