0461
Transformer-based Alzheimer’s disease analyzer for multi-institutional 3D MRI images1Yonsei University, Seoul, Korea, Republic of
Synopsis
We propose Transformer-based Alzheimer’s disease (AD) analyzer for 3D MRI. The proposed network can analyze 3D MRI images efficiently combining 3D CNN, and Transformer. It is possible to efficiently extract locality information for AD-related abnormalities in local brain based on CNN networks with inductive bias. Also, the transformer network is also used to obtain attention relationship among 3D representation features after CNN. Our proposed method was compared to various networks including 3D CNN and transformer with an area under curve and accuracy for AD classification in multi-institutional datasets. Also, the transformer interpretability technique-based activation map can visualize AD-related abnormality region.
Introduction
Recently, transformer networks have been widely used not only in natural language processing [1] but also vision field [2-3]. The transformer architectures which have been effectively applied to l (2D) image processing have been used to analyze medical images [4-5]. However, the transformer-based networks require a very large number of training datasets due to low inductive bias with the low ability to analyze translation equivalence and locality in images. This is not suitable for application in 3D MRI with a small number of data protected by personal information or ethical issues. Alzheimer’s disease (AD) is a progressive and irreversible neurodegenerative disease-causing many elderly deaths worldwide [6-7]. AD-related abnormalities may develop in local areas of the brain such as the hippocampus atrophy, enlargement of ventricles, and in whole areas such as the atrophy of the cerebral cortex [8-9]. In this study, we propose a Transformer-based Alzheimer’s disease (AD) analyzer for 3D MRI images The proposed network can analyze 3D MRI images efficiently combining 3D convolutional neural network (CNN) and Transformer. It is possible to efficiently extract the locality information for AD-related abnormalities in the local brain based on CNN networks with inductive bias. It is also possible to learn the abnormalities distributed over the wider region in the brain using the transformer without inductive bias.Methods
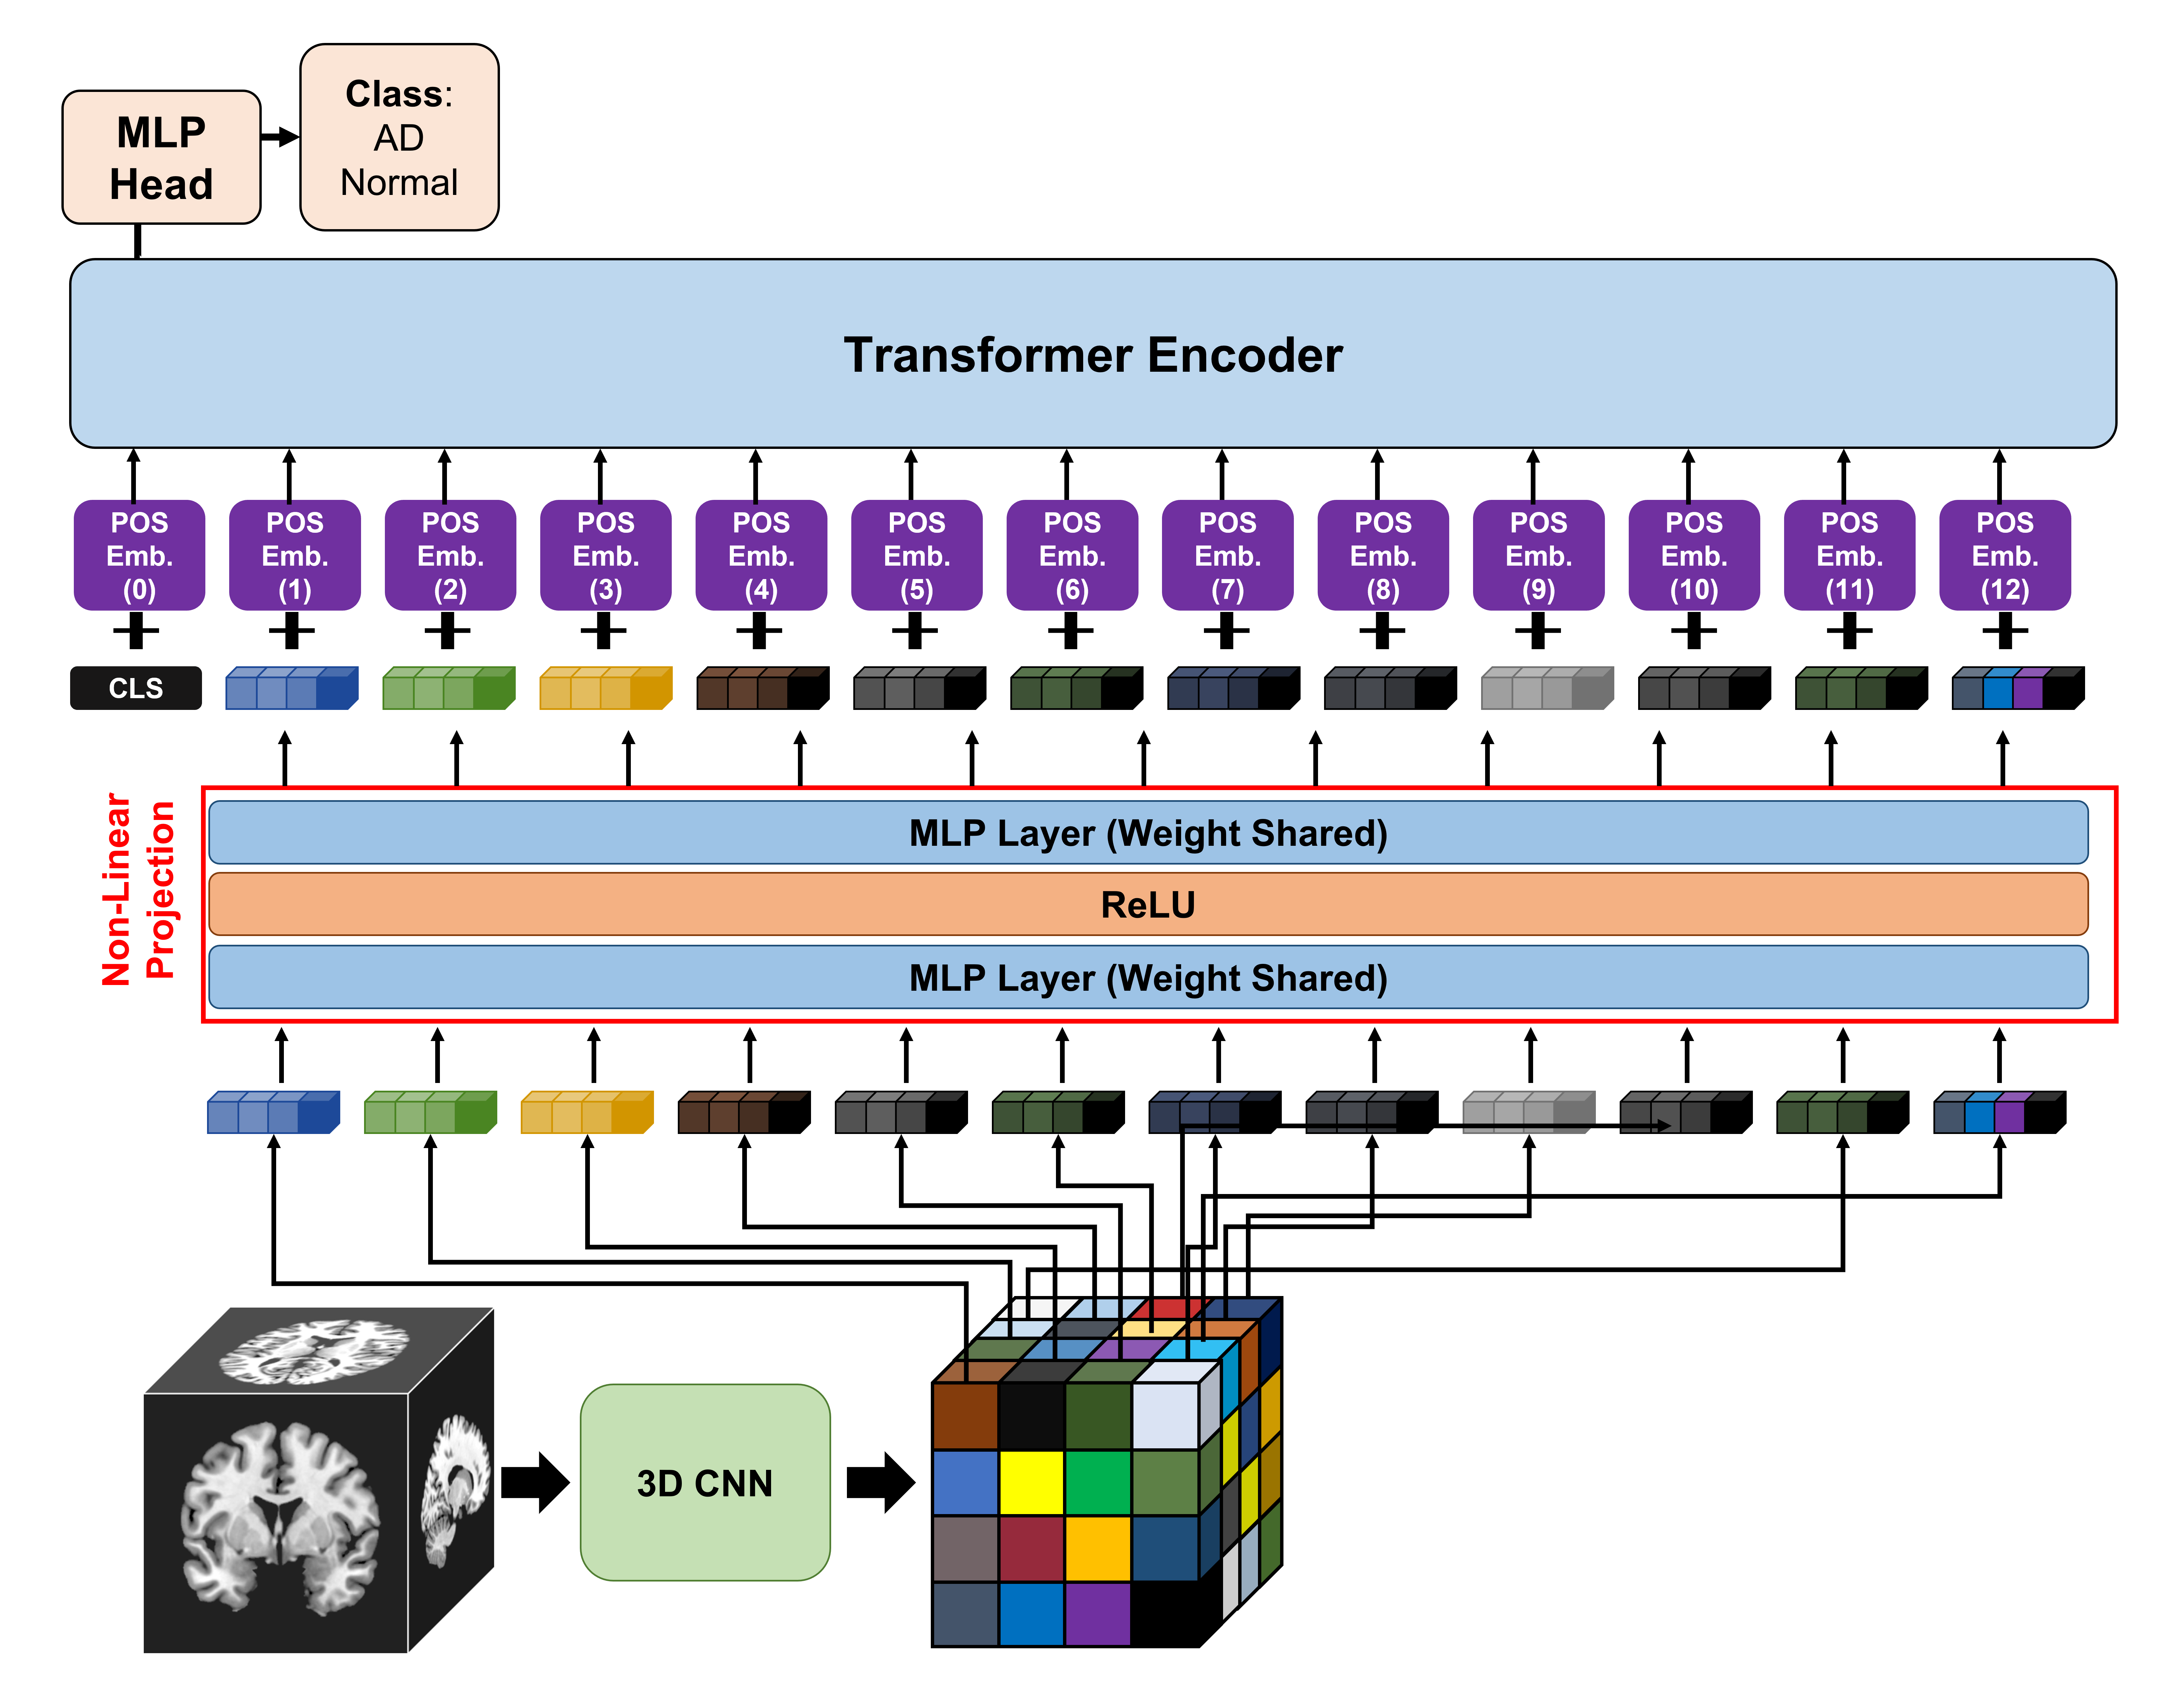
We combined 3D CNN and Transformer networks. The detailed architecture of our proposed network is presented in Fig 1. In order to obtain 3D representation features, we apply 3D DenseNet121 [11] block to the MRI image $$$I\in\mathbb{R}^{L\times{W}\times{H}}$$$ where image length $$$L$$$ image width $$$W$$$ and image height $$$H$$$ are all the same The 3D CNN block $$$D:\mathbb{R}^{L\times{W}\times{H}}\rightarrow\mathbb{R}^{C\times{\tilde{L}\times{\tilde{H}}\times{\tilde{H}}}}$$$ After the 3D DenseNet121 block applied into input image $$$I$$$, the 3D representation features $$$T$$$ is calculated. $$T=D(I)$$ After that, we apply non-linear projection layer $$$D_{mlp}:\mathbb{R}^{N\times{C}}\rightarrow\mathbb{R}^{N\times{d}}$$$ from $$$N=\tilde{L}\cdot\tilde{W}\cdot\tilde{H}$$$ used various self-supervised learning [12] to the features. The non-linear projection consists of two layers MLP with ReLU activation between them. Using the layer, channel number $$$C$$$ is changed to projection dimension $$$d$$$. Multi-plane and multi-slice image tokens $$$I\in\mathbb{R}^{N\times{d}}$$$ from 3D CNN and non-linear projection layers. After the projection, the learnable one-dimensional position embedding which are applied to the embedding scheme to retain positional information.Also, a learnable classification token $$$z_{cls}$$$ is prepended to these tokens, like Visual Transformer [2] class token. The final token $$$Z_0\in\mathbb{R}^{(N+1)\times{d}}$$$ in in used in transformer encoder is below: $$Z_0=[z_{cls}, T_1, T_2, T_3,...,T_N] + P$$ where $$$z_{cls}\in\mathbb{R}^d$$$, $$$P\in\mathbb{R}^{(N+1)\times{d}}$$$
The image tokens from embedding process are then passed through composed of $$$K$$$ transformer layers. Each transformer layer consists of Multi-Headed Self-Attention (MSA) [2], layer normalization (LN) [2], and MLP blocks as follows: $$\tilde{z}_k = MSA(LN(z_k)) + z_k$$ $$z_{k+1}=MLP(LN(\tilde{z_k}) + \tilde{z_k}$$
The MLP consists of two linear projections separated by a GELU non-linearity and the token-dimensionality, $$$d$$$, remains fixed throughout all layers. Finally, a linear classifier is used to classify the encoded input based on MLP head: $$$z_{cls}^K\in\mathbb{R}^d$$$. The final classification class is two: NC and AD class.
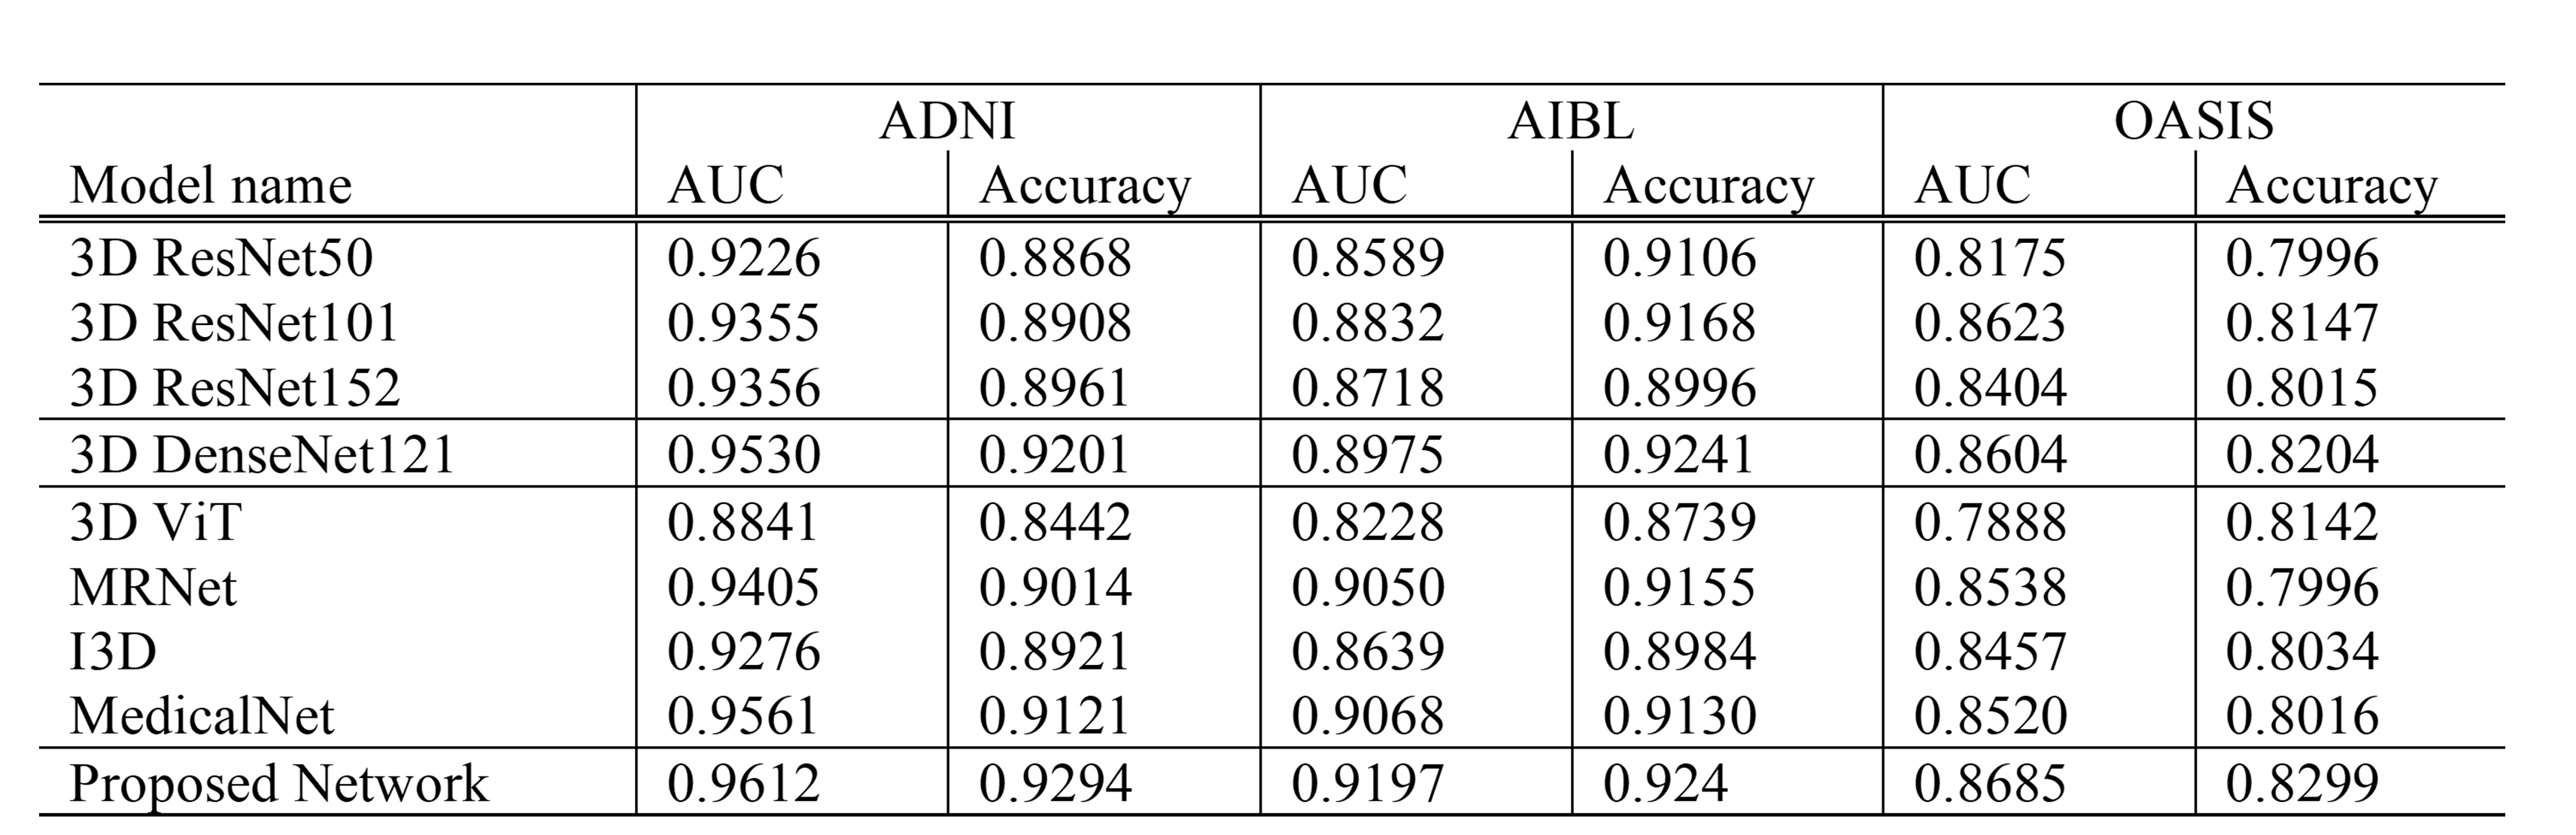
In this study, we acquired a training dataset from the Alzheimer’s Disease Neuroimaging Initiative (ADNI) [8] for the training process. The number of the total training dataset is 4,786, including 3,174 NC and 1,612 AD cases. Test datasets were acquired from three institutions: ADNI, Australian Imaging, Biomarker and Lifestyle Flagship Study of Ageing (AIBL) [9] and The Open Access Series of Imaging Studies (OASIS) [1]. Especially, the test database from ADNI was totally separated from the training dataset. The ADNI test dataset includes total 751 cases which consist of 509 NC and 242 AD cases. The AIBL dataset contains total 817 cases which consist of 697 NC and 120 AD cases. The OASIS dataset consists of total 600 cases which consist of 360 NC and 240 AD cases.
Result and Discussion:
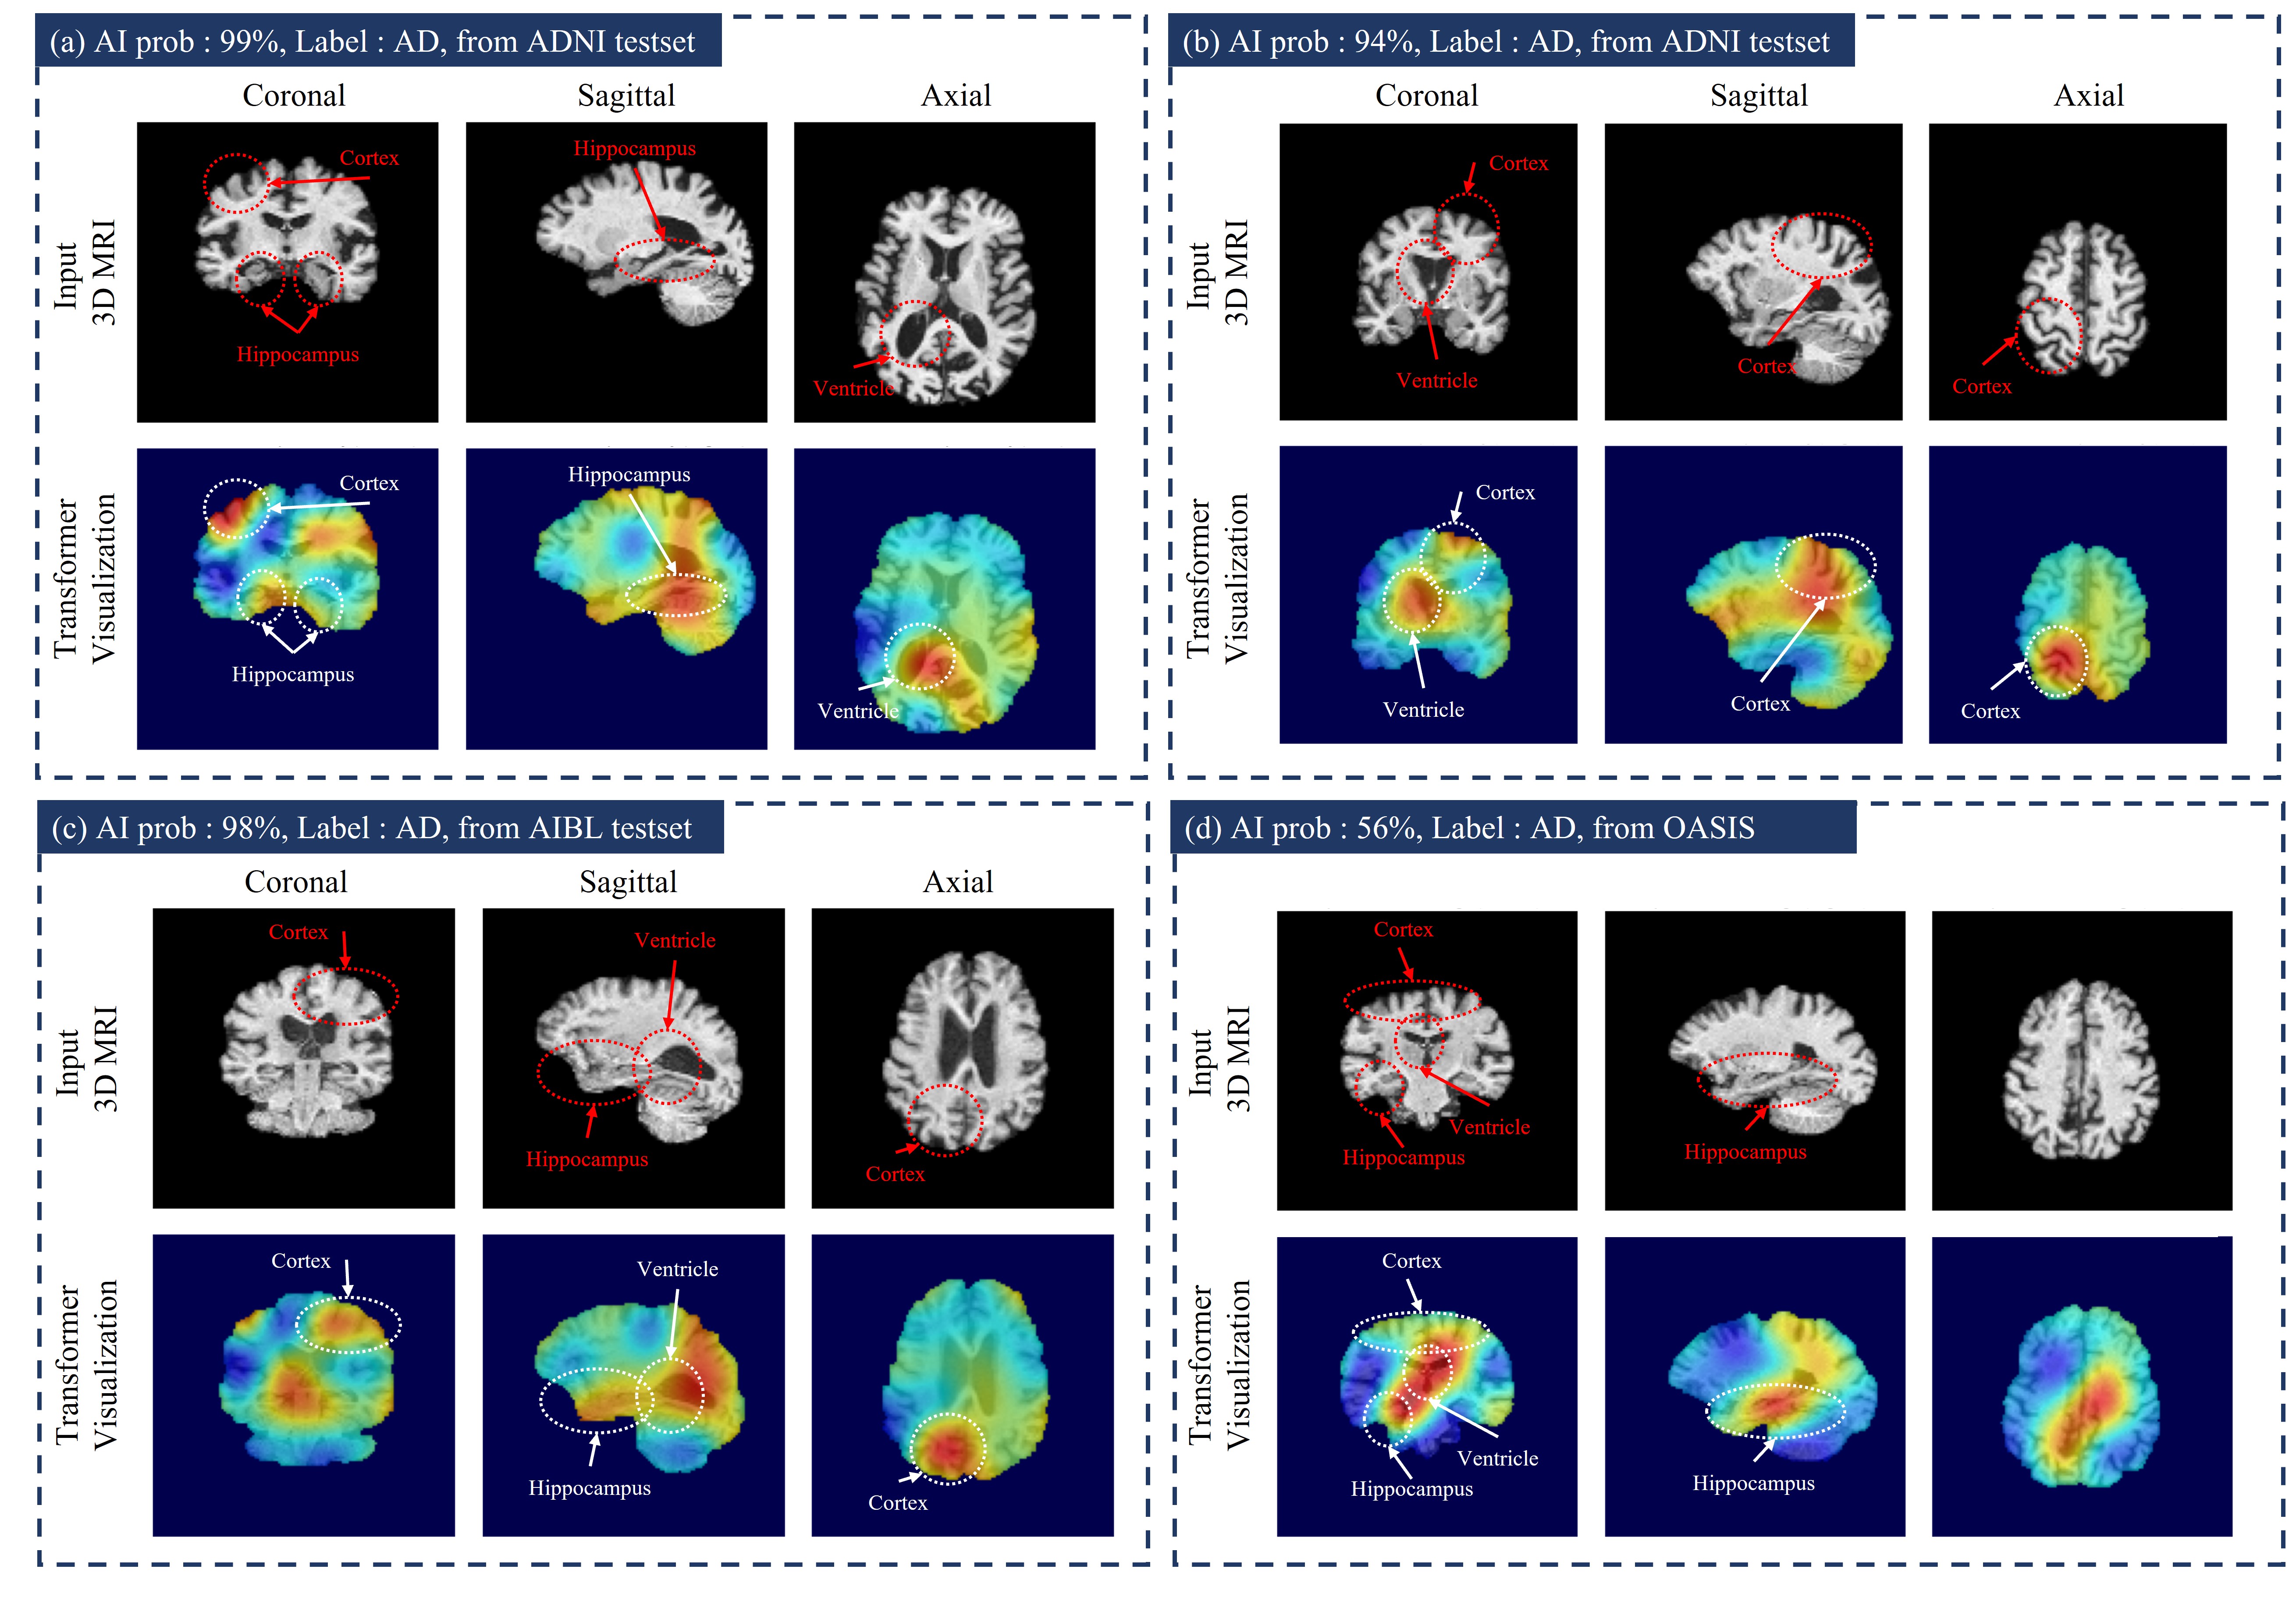
We compared proposed model with conventional 3D classification methods based on 3D ResNet (50, 101, 152) [13], 3D DenseNet121 because they have been widely used for AD classification [14-15]. Also, we compared I3D [16], MRNet [17], and MedicalNet [18]. Also, we implemented 3D ViT [2] which is composed of pure-transformer networks. The quantitative performance is presented in Figure 2 which shows AUC, Accuracy values of AD classification from multi-institutional datasets. Our model achieved the highest values of the metrics compared to the other methods. Also, the 3D ViT has a rather lower performance than the other algorithms. Although the network achieves high performance in the experiments using a very large database, the pure-transformer networks obtain low performance in our experiment with a small amount of data. On the other hand, the proposed model using a hybrid network achieves competitive performance in the low number of medical images. We visualize the activation map based on the transformer classification activation map technique [19]. Fig 3 shows an AD-related activation map in three-institution 3D MRI images. As it can be shown, the heatmap mainly focuses on the hippocampus, ventricle, and cerebral cortex areas. The axial image of Fig 3(a) represents that our proposed network mainly focuses on the severely contracted cortex region in the circle annotated area. It can be seen that our network efficiently analyzes brain structural changes that occur mainly in AD patients.Acknowledgements
This work was supported by Samsung Research FundingCenter of Samsung Electronics under Project Number SRFC-TF2103-01References
[1] Kenton, J. D. M. W. C. et al. BERT: Pre-training of Deep Bidirectional Transformers for Language Understanding. In Proceedings of NAACL-HLT, 4171-4186 (2019)
[2] Dosovitskiy, A. et al. An image is worth 16x16 words: Transformers for image recognition at scale. In International Conference on Learning Representations, (2020)
[3] Liu, Ze, et al. "Swin transformer: Hierarchical vision transformer using shifted windows." In Proceedings of ICCV (2021). [4] Chen, J. at el. ViT-V-Net: Vision Transformer for Unsupervised Volumetric Medical Image Registration. In MIDL (2021)
[5] Matsoukas, Christos, et al. "Is it Time to Replace CNNs with Transformers for Medical Images?." In Proceedings of ICCV, (2021).
[6] Tondelli, Manuela, et al. "Structural MRI changes detectable up to ten years before clinical Alzheimer's disease." Neurobiology of aging 33.4 (2012): 825-e25.
[7] Vemuri, P., & Jack, C. R. (2010). Role of structural MRI in Alzheimer's disease. Alzheimer's research & therapy, 2(4), 1-10.
[8] E Petersen, R. C., Aisen, P. S., Beckett, L. A., Donohue, M. C., Gamst, A. C., Harvey, D. J., ... & Weiner, M. W. (2010). Alzheimer's disease neuroimaging initiative (ADNI): clinical characterization. Neurology, 74(3), 201-209.
[9] Ellis, K. A., Rowe, C. C., Villemagne, V. L., Martins, R. N., Masters, C. L., Salvado, O., ... & AIBL Research Group. (2010). Addressing population aging and Alzheimer's disease through the Australian Imaging Biomarkers and Lifestyle study: Collaboration with the Alzheimer's Disease Neuroimaging Initiative. Alzheimer's & dementia, 6(3), 291-296.
[10] LaMontagne, P. J., Benzinger, T. L., Morris, J. C., Keefe, S., Hornbeck, R., Xiong, C., ... & Marcus, D. (2019). OASIS-3: longitudinal neuroimaging, clinical, and cognitive dataset for normal aging and Alzheimer disease. MedRxiv.
[11] G. Huang, Z. Liu, L. Van Der Maaten and K. Q. Weinberger, "Densely Connected Convolutional Networks," 2017 IEEE Conference on Computer Vision and Pattern Recognition (CVPR), 2017, pp. 2261-2269, doi: 10.1109/CVPR.2017.243.
[12] Chen, Ting, et al. "A simple framework for contrastive learning of visual representations." International conference on machine learning. PMLR, 2020.
[13] He, K., Zhang, X., Ren, S., & Sun, J. (2016). Deep residual learning for image recognition. In Proceedings of the IEEE conference on computer vision and pattern recognition (pp. 770-778).
[14] Fulton, L. V., Dolezel, D., Harrop, J., Yan, Y., & Fulton, C. P. (2019). Classification of Alzheimer’s disease with and without imagery using gradient boosted machines and ResNet-50. Brain sciences, 9(9), 212.
[15] Ebrahimi, A., Luo, S., & Chiong, R. (2020, November). Introducing Transfer Leaming to 3D ResNet-18 for Alzheimer’s Disease Detection on MRI Images. In 2020 35th International Conference on Image and Vision Computing New Zealand (IVCNZ) (pp. 1-6). IEEE.
[16] Carreira, J., & Zisserman, A. (2017). Quo vadis, action recognition? a new model and the kinetics dataset. In proceedings of the IEEE Conference on Computer Vision and Pattern Recognition (pp. 6299-6308).
[17] Bien, N., Rajpurkar, P., Ball, R. L., Irvin, J., Park, A., Jones, E., ... & Lungren, M. P. (2018). Deep-learning-assisted diagnosis for knee magnetic resonance imaging: development and retrospective validation of MRNet. PLoS medicine, 15(11), e1002699.
[18] Chen, S., Ma, K., & Zheng, Y. (2019). Med3d: Transfer learning for 3d medical image analysis. arXiv preprint arXiv:1904.00625.
[19] Chefer, H., Gur, S., & Wolf, L. (2021). Transformer interpretability beyond attention visualization. In Proceedings of the IEEE/CVF Conference on Computer Vision and Pattern Recognition (pp. 782-791).
Figures