0460
Explainable MRI: Revealing the mechanisms underlying deep learning brain disease classification
Christian Tinauer1, Lukas Pirpamer1, Marc Masana2, Stefan Heber1, Anna Damulina1, Maximilian Sackl1, Martin Soellradl3, Reinhold Schmidt1, Stefan Ropele1, and Christian Langkammer1
1Department of Neurology, Medical University of Graz, Graz, Austria, 2Institute of Computer Graphics and Vision, Graz University of Technology, Graz, Austria, 3Institute of Medical Engineering, Graz University of Technology, Graz, Austria
1Department of Neurology, Medical University of Graz, Graz, Austria, 2Institute of Computer Graphics and Vision, Graz University of Technology, Graz, Austria, 3Institute of Medical Engineering, Graz University of Technology, Graz, Austria
Synopsis
Increased iron deposition in the basal ganglia is a frequent finding in patients with AD. Using R2* maps we separated Alzheimer's patients (n=115) from healthy controls (n=169) by using a deep neural network and systematically investigated the influence of the learned features using an attached relevance map generator. The highest relevances were found in and adjacent to the basal ganglia, which is in line with established histological findings and additionally confirmed by the conventional ROI-based analysis. This study demonstrates the validity of heat mapping as a means to identify novel areas of pathological tissue changes.
Introduction
Recent studies showed that deep neural networks (DNNs) can learn features from MRI for the classification of Alzheimer's disease (AD) 1. DNNs are generally seen as black boxes, which are not easily interpretable by humans 2. Medical applications are especially required to verify that the high accuracy of those models is not the result of exploiting artifacts in the data. However, even when using an advanced heat mapping approach it remained unclear whether atrophy, signal intensity changes or other contributors are relevant for the T1-based separation of patients with AD from healthy controls (HC) 3.In this work, we utilize a quantitative MRI parameter, the effective relaxation rate R2*, for AD classification by a regularized DNN. R2* is highly correlated with iron concentration in gray matter 4 and increased iron levels in the basal ganglia are a frequent finding in AD 5. We then compare the relevance maps from heat mapping with the outcome of an established ROI-based analysis and relate the results to histologically well-known areas of disease activity.
Methodology
Dataset. We retrospectively selected 217 MRI datasets from 115 patients with probable AD (mean age=73.7±6.9 years) from our outpatient clinic and 173 MRIs from 169 age-matched healthy controls (mean age=73.9±4.6 years) from an ongoing community dwelling study. Patients and controls were scanned using a consistent MRI protocol at 3 Tesla (Siemens TimTrio) including a T1-weighted MPRAGE sequence (1mm isotropic resolution) and a spoiled FLASH sequence (0.9x0.9x2mm³, TR/TE=35/4.92ms, 6 echoes, 4.92ms echo spacing, 64 slices). AD and HC data were split up randomly into five folds, while maintaining all scans from one person in the same fold 1. Final folds were created by combining one fold from each cohort to ensure class distribution within.Preprocessing. Brain masks from each subject were obtained using SIENAX from FSL 6. R2* maps were voxelwise calculated using a monoexponential model and affinely registered to the MPRAGE sequence using FSL flirt. The R2* maps have been registered to the MNI152 template nonlinearly using FSL fnirt.
Standard classification network. We utilize a classifier network, which uses the combination of a single convolutional layer followed by a down-convolutional layer as the main building block. The overall network stacks four of those main building blocks before passing the data through two fully connected layers. Each layer is followed by a Rectified Linear Unit (ReLU) nonlinearity, except for the output layer where a Softmax activation is applied.
Relevance-guided classification network. To focus the network on relevant features, we proposed a relevance-guided network architecture, that extends the given classifier network with a relevance map generator (cf. Figure 1 for details). To this end we implemented the deep Taylor decomposition (z+-rule) 7 to generate the relevance maps of each input image depending on the classifier's current parameters, entitled Graz+.
Training. We trained Graz+ models for three differently preprocessed types of R2* maps:
- input images in native subject R2* space
- input images linearly registered to MNI152 space
- input images nonlinearly registered to MNI152 space
R2* ROI analysis. Anatomic structures were segmented using FIRST from FSL 9, and median R2* values were calculated in the basal ganglia (BG) and thalami 10. T-tests were applied to study R2* differences between AD and controls.
Results
Figure 2 summarizes the mean performance for the cross validation setup of all tested configurations, with the model without input image registration performing best regarding balanced accuracy, sensitivity and area under the receiver operating characteristics curve (AUC). Mean heat maps for classification decisions on cross validation holdout data sets for all trained models are shown in Figure 3. Qualitatively, the mean heat maps show a substantial overlap with the basal ganglia regions (bottom row). The median R2* values in selected anatomical brain regions are given in Figure 4.Discussion and Conclusion
Previous studies using T1-weighted MRIs showed that volumetric brain features are highly relevant for the DNN-based classification of AD 3, which has been also confirmed in recent related work of simulated aging 11. To focus the classifier's attention within brain parenchyma, we have applied a relevance-guided regularized network (Graz+). However, from T1-weighted images alone it cannot be concluded whether volumetric features, signal intensity changes or other factors are relevant.Therefore, this study assessed the histological validity of the DNN-based classification by using R2* as a measure of iron concentration. A variety of studies have shown that brain iron increasingly accumulates in the deep gray matter of AD patients 12. Heat mapping identified the highest relevances in and adjacent to the basal ganglia (Figure 3), which was additionally confirmed by the conventional ROI-based results (Figure 4).
In conclusion, this study used quantitative MRI data (R2*) for deep learning classification and heat mapping in a clinical cohort of AD. Combined with a-priori knowledge from histological post-mortem and in-vivo iron mapping studies this underlines that heat mapping can serve as a valid means to identify areas of pathological tissue changes.
Acknowledgements
This study was funded by the Austrian Science Fund (FWF grant numbers: KLI523, P30134). This research was supported by NVIDIA GPU hardware grants and the “University SAL Labs” initiative of Silicon Austria Labs (SAL).References
- Wen J, Thibeau-Sutre E, Diaz-Melo M, et al. Convolutional neural networks for classification of Alzheimer’s disease: Overview and reproducible evaluation. Med Image Anal. 2020;63:101694. doi:10.1016/j.media.2020.101694
- Davatzikos C. Machine learning in neuroimaging: Progress and challenges. NeuroImage. 2019;197:652-656. doi:10.1016/j.neuroimage.2018.10.003
- Tinauer C, Heber S, Pirpamer L, et al. Explainable Brain Disease Classification and Relevance-Guided Deep Learning.; 2021:2021.09.09.21263013. doi:10.1101/2021.09.09.21263013
- Langkammer C, Krebs N, Goessler W, et al. Quantitative MR imaging of brain iron: a postmortem validation study. Radiology. 2010;257(2):455-462. doi:10.1148/radiol.10100495
- Drayer BP. Imaging of the aging brain. Part II. Pathologic conditions. Radiology. 1988;166(3):797-806. doi:10.1148/radiology.166.3.3277248
- Smith SM, Zhang Y, Jenkinson M, et al. Accurate, robust, and automated longitudinal and cross-sectional brain change analysis. Neuroimage. 2002;17(1):479-489. doi:10.1006/nimg.2002.1040
- Montavon G, Lapuschkin S, Binder A, Samek W, Müller KR. Explaining nonlinear classification decisions with deep Taylor decomposition. Pattern Recognition. 2017;65:211-222. doi:10.1016/j.patcog.2016.11.008
- Kingma DP, Ba J. Adam: A Method for Stochastic Optimization. In: Bengio Y, LeCun Y, eds. 3rd International Conference on Learning Representations, ICLR 2015, San Diego, CA, USA, May 7-9, 2015, Conference Track Proceedings. ; 2015. Accessed November 10, 2021. http://arxiv.org/abs/1412.6980
- Patenaude B, Smith SM, Kennedy DN, Jenkinson M. A Bayesian model of shape and appearance for subcortical brain segmentation. Neuroimage. 2011;56(3):907-922. doi:10.1016/j.neuroimage.2011.02.046
- Damulina A, Pirpamer L, Soellradl M, et al. Cross-sectional and Longitudinal Assessment of Brain Iron Level in Alzheimer Disease Using 3-T MRI. Radiology. 2020;296(3):619-626. doi:10.1148/radiol.2020192541
- Hofmann SM, Beyer F, Lapuschkin S, et al. Towards the Interpretability of Deep Learning Models for Human Neuroimaging.; 2021:2021.06.25.449906. doi:10.1101/2021.06.25.449906
- Lane DJR, Ayton S, Bush AI. Iron and Alzheimer’s Disease: An Update on Emerging Mechanisms. J Alzheimers Dis. 2018;64(s1):S379-S395. doi:10.3233/JAD-179944
- Khalil M, Langkammer C, Ropele S, et al. Determinants of brain iron in multiple sclerosis: a quantitative 3T MRI study. Neurology. 2011;77(18):1691-1697. doi:10.1212/WNL.0b013e318236ef0e
Figures
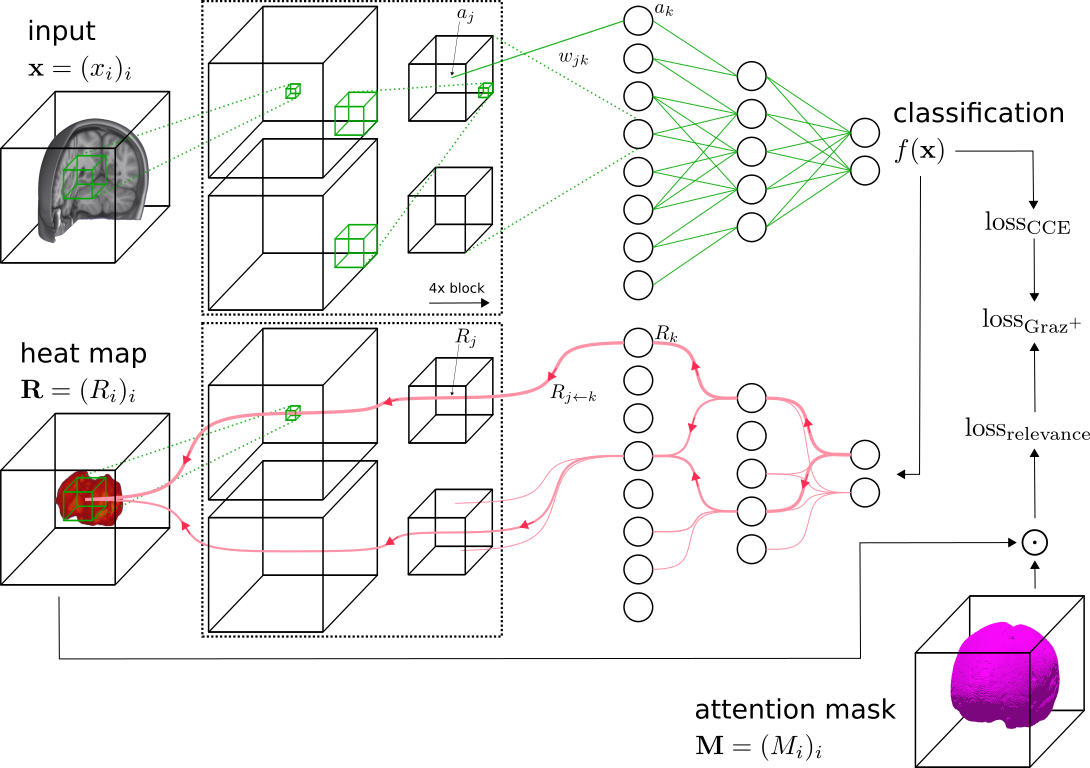
Schematic overview of the relevance-guided network and the adapted training process. A conventional classifier network (top) is extended by the heat map generator (bottom). For each classifier network layer a corresponding relevance redistribution layer with shared parameters and activations is attached to the generator network. The online calculated heat map is guiding the classifier training by adding a relevance sum inside the binary attention mask, which is added to the categorical cross entropy loss, yielding the total loss. ⊙ denotes the Hadamard product.
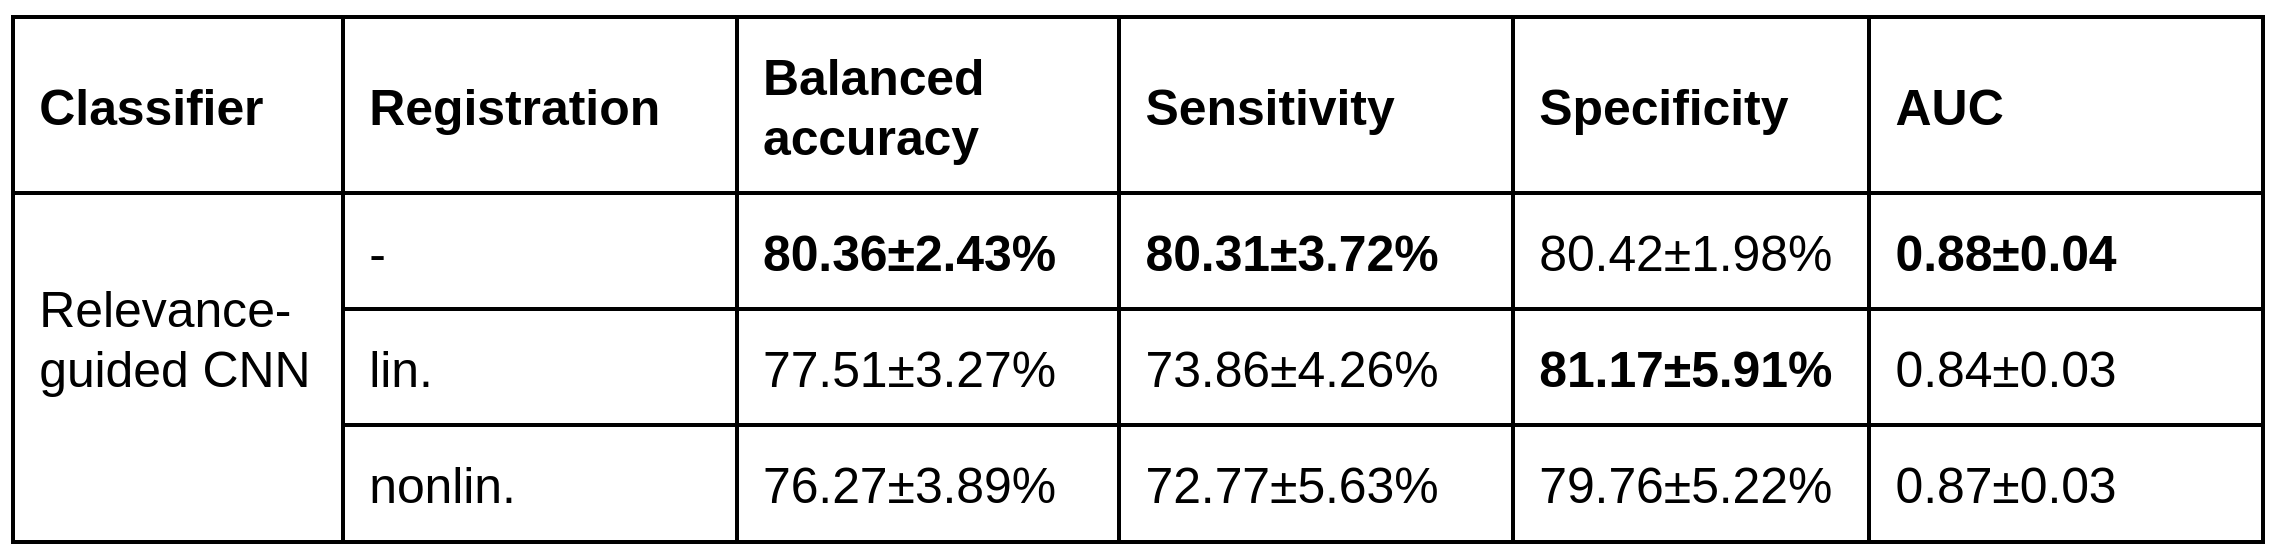
Mean performance (in %) for the different models on all holdout data sets of cross validation. Highest values per column are highlighted in bold.
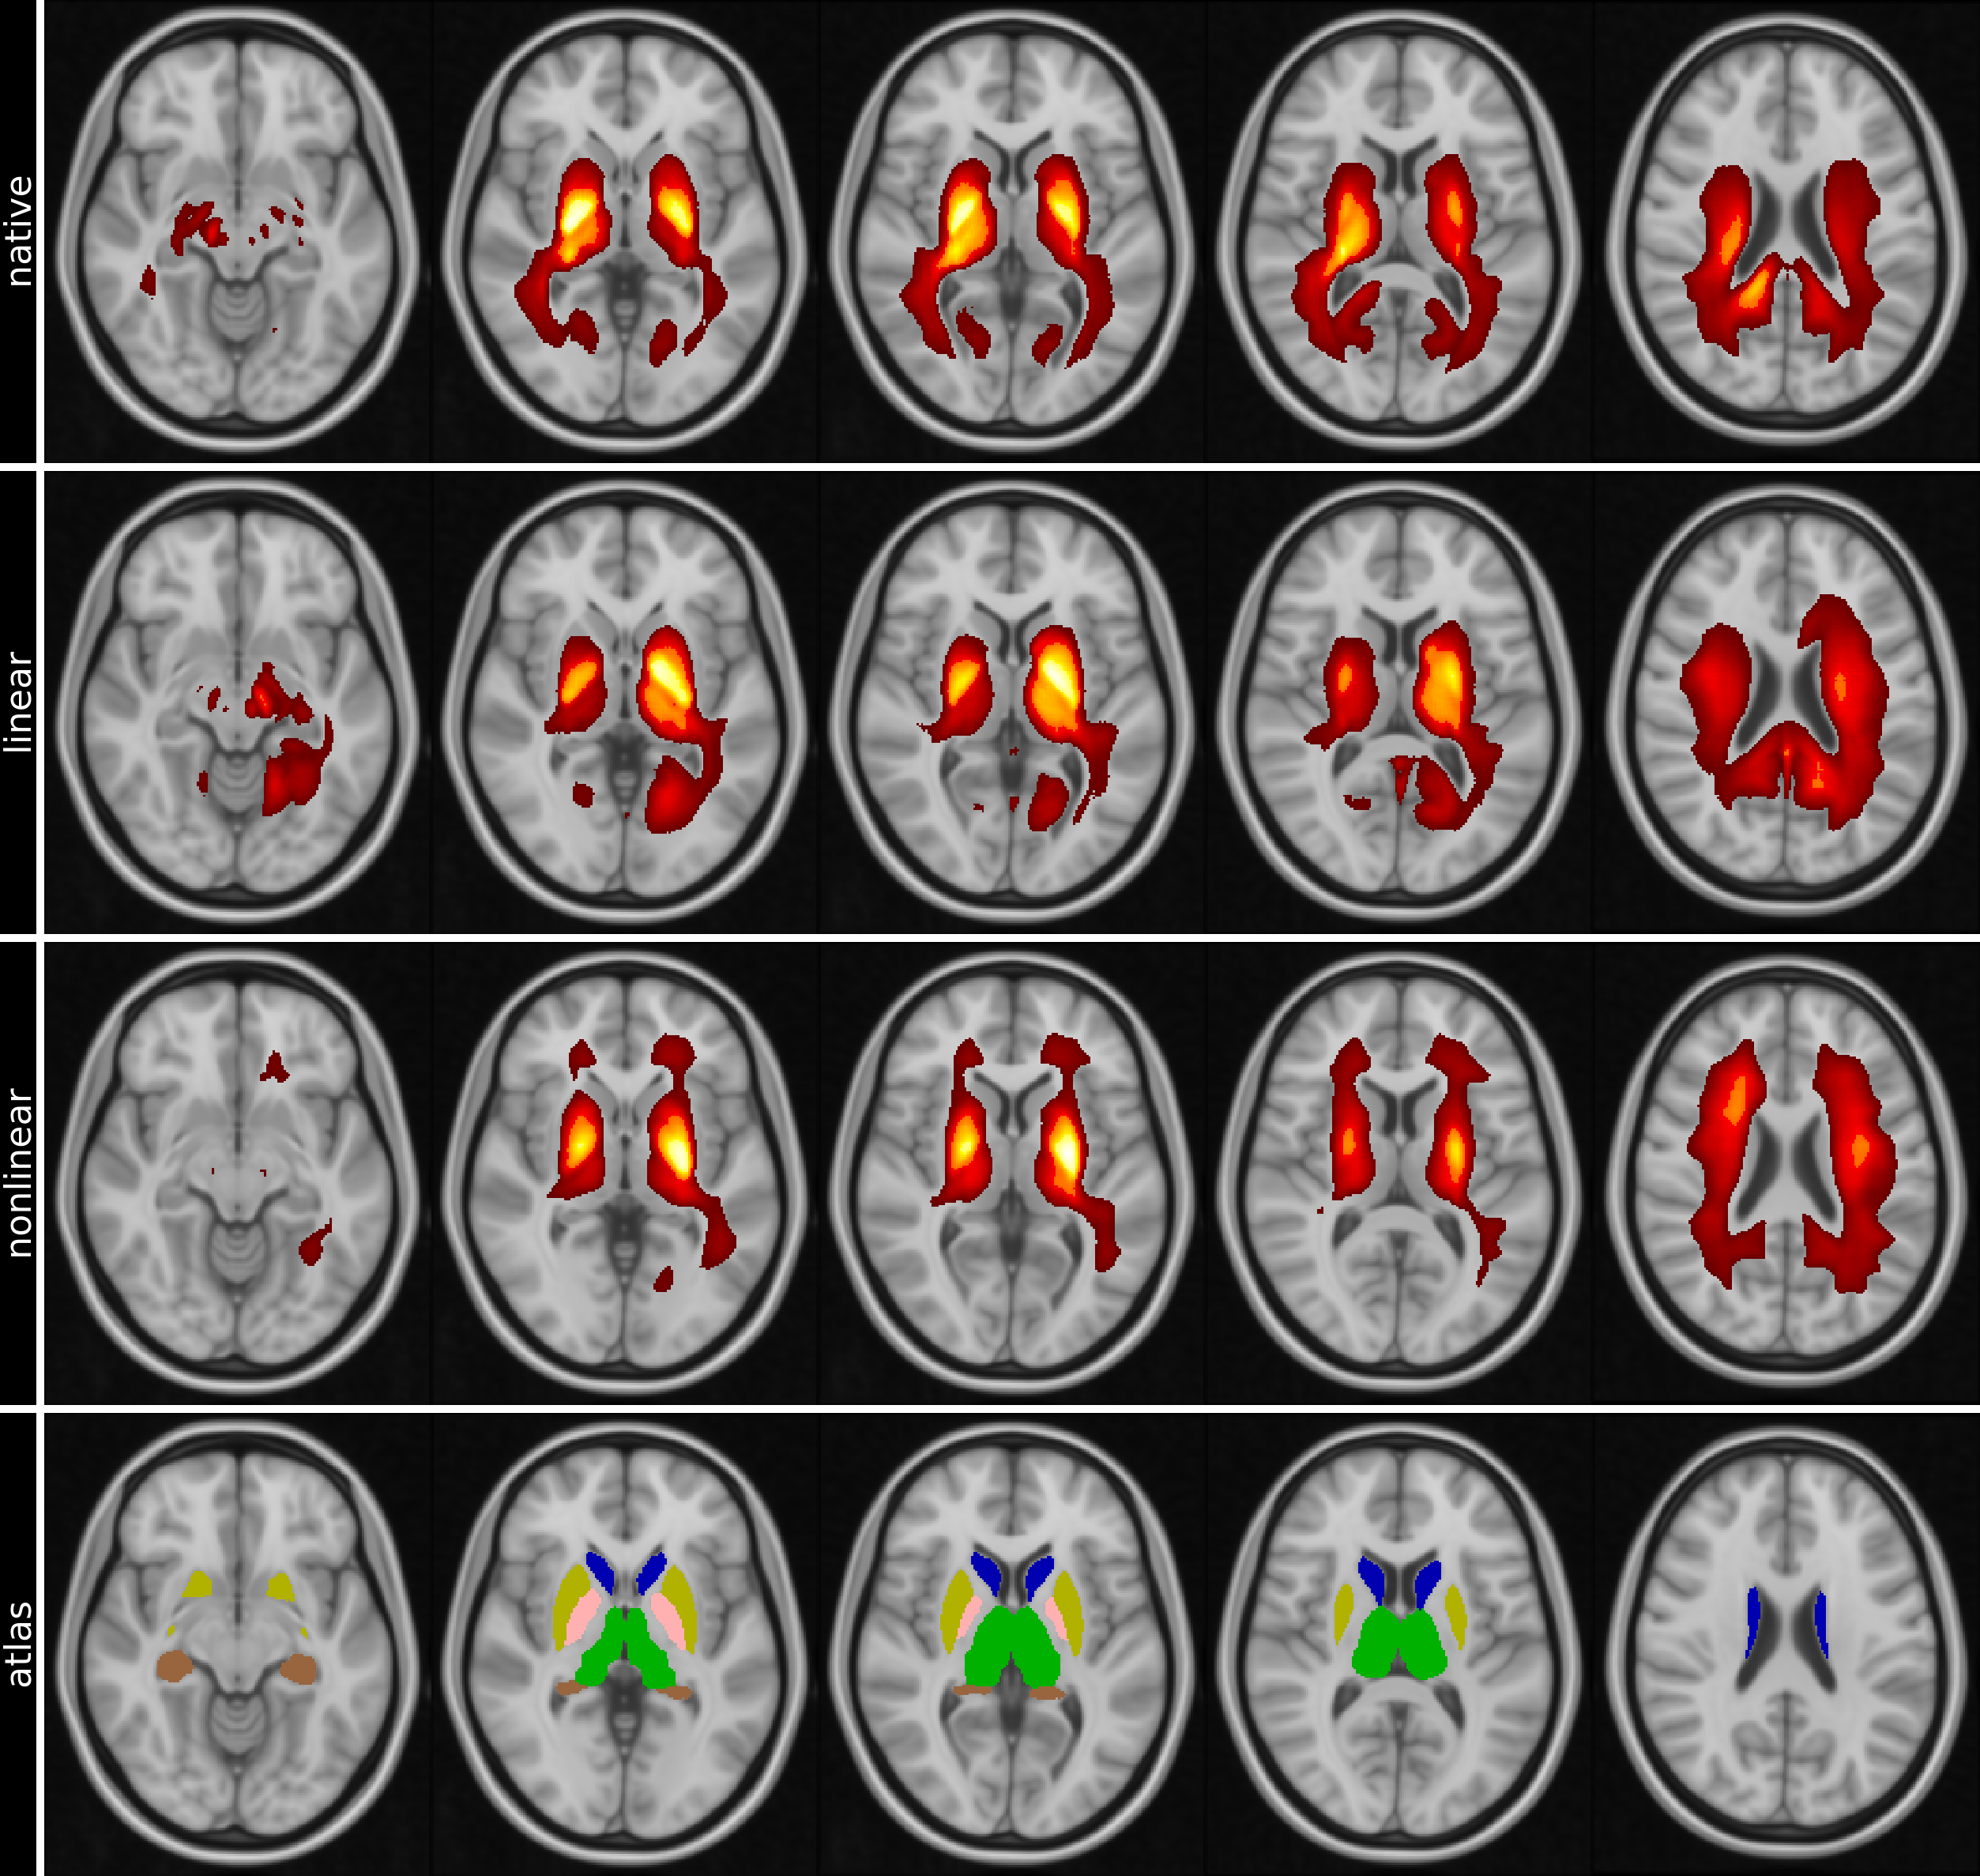
Mean heat maps (highest relevances in yellow, overlaid on MNI152 template) for R2* input images in different image spaces (native, linear registered to MNI152, nonlinear registered to MNI152). Atlas row shows thalami (green), caudate nuclei (blue), putamen (yellow), pallidum (pink) and hippocampi (copper) for visual comparison with heat maps.
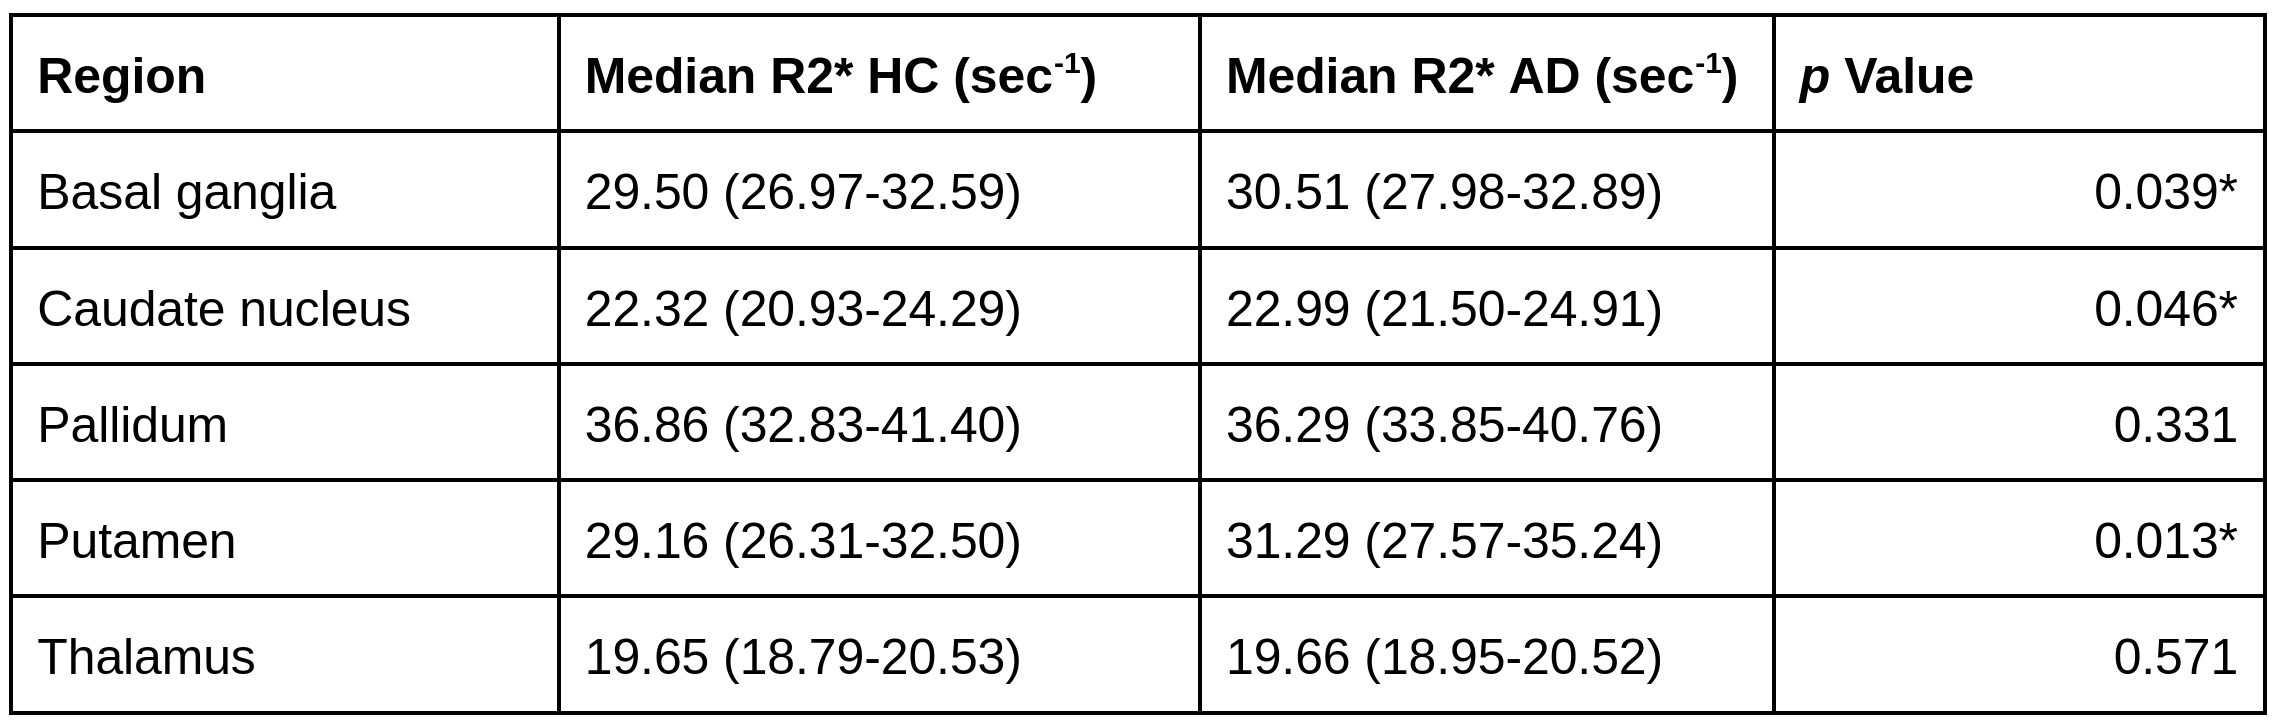
R2* values in different brain regions in study participants with AD and HC. T-test was used to calculate the p Value. Basal ganglia is defined as the mean of caudate nucleus, pallidum, putamen according to 13.
DOI: https://doi.org/10.58530/2022/0460