0459
Microstructural MR Markers of Alzheimer’s Disease Pathology in Post-Mortem Human Temporal Lobe
Courtney J Comrie1, Laurel A Dieckhaus1, Tom G Beach2, Geidy E Serrano2, and Elizabeth B Hutchinson1
1Biomedical Engineering, University of Arizona, Tucson, AZ, United States, 2Brain and Body Donation Program, Banner Sun Health Research Institute, Sun City, AZ, United States
1Biomedical Engineering, University of Arizona, Tucson, AZ, United States, 2Brain and Body Donation Program, Banner Sun Health Research Institute, Sun City, AZ, United States
Synopsis
Alzheimer’s is an irreversible degenerative brain disease. Current clinical MRI is capable of reporting severe brain atrophy, but fails to recognize earlier biomarkers associated with more subtle microstructural changes. Microstructural MRI techniques such as DTI, MAP-MRI, NODDI, MWF, and BPF are promising to address this challenge and may sensitively detect and distinguish tissue degeneration, tauopathies, and beta amyloid plaques. The capability of these techniques was investigated in post-mortem human temporal lobe specimens at high resolution and high image quality. Prominent findings seen were distinct differences between relaxivity and diffusivity metrics, and striking differences between DTI and MAP-MRI anisotropy metrics.
Introduction
Alzheimer’s Disease (AD) is an irreversible degenerative brain disease affecting 5.5 million Americans. However, clinical markers for early diagnosis are lacking and approximately 20% of all AD cases are ultimately misdiagnosed (1). Current clinical MRI is capable of reporting severe brain atrophy, but fails to recognize earlier biomarkers associated with more subtle cellular and molecular changes. Microstructural Magnetic Resonance Imaging (MRI) techniques are promising to address this challenge and may sensitively detect and distinguish tissue degeneration, tauopathies, and beta amyloid plaques to improve accuracy of diagnosis and enable early detection. The objective of this study was to identify and compare the most promising microstructural markers of AD pathology over a range of diffusion-based (DTI, MAP-MRI and NODDI) and relaxometry-based (MWF and BPF) MRI methods by investigating post-mortem human temporal lobe specimens at high resolution and high image quality.Methods
Fourteen post-mortem human temporal lobe samples were received from the Banner Sun Health Brain and Body Donation Program (2). Two temporal lobe samples of known pathologies, Braak stage 4 AD (3) and healthy, were utilized in development of methods and comprehensive metric comparisons. The remaining twelve samples were imaged and analyzed for comparative analysis of metrics across specimens. All samples were prepared according to (3) with short post-mortem interval, block fixation by paraformaldehyde and rehydration by storage in saline. Samples were prepared in 50 ml falcon tube and Fluorinert for scanning.Images were acquired at 250 micron isotropic resolution using a 7T Bruker Biospec MRI scanner, including multi-shell diffusion weighted imaging (DWI) 201 DWI volumes over b=0-6,000 s/mm2, quantitative magnetization transfer selective inversion recovery (SIR) forT1 and BPF mapping, and multi-spin echo (MSE) with TE=6-200ms for T2 and MWF mapping. Total scan time was approximately 50-60 hours.
Diffusion pre-processing and DTI and MAP-MRI (4) calculations were performed using TORTOISE 3.2.0 (5) to generate fractional anisotropy (FA), mean diffusivity (MD), and propagator anisotropy maps (PA) among others. NODDI modeling was performed using the MATLAB toolbox (6) and maps included intracellular volume fraction (FICV) and free water fraction (FISO). Advanced relaxometry mapping algorithms were accomplished using the REMMI toolbox in MATLAB to generate included myelin water fraction (MWF), bound pool fraction (BPF), T1, and geometric T2 mapping.
Within the two representative specimens, 1D and 2D histograms of different metrics were generated to evaluate the distribution of metric values and to compare between metrics. Region of interest (ROI) manual segmentations were performed for the hippocamps, entorhinal cortex, and white matter for targeted comparisons and to generate scatter plots across all 14 samples.
Results
Microstructural MRI metric maps for diffusion and relaxometry techniques were of resolution and quality to enable visualization of small anatomic feature in the temporal lobe (e.g. Figure 1). Joint histogram analysis revealed different profiles of diffusivity and T2 between control and AD specimens (Figure 2) with increased MD and decreased in T2 in hippocampus and cortex. Distinct 1D histogram behavior between AD and control BPF, ICVF and FISO were also evident (Figure 3). The observed increase in BPF may indicate increased protein content (e.g. tauopathies and beta amyloid plaques), and decreased ICVF with increased FISO suggest cellular degradation. Anisotropy metrics were strikingly different between DTI and MAP-MRI methods even in healthy tissue (Figure 4) and showed distinct histogram changes between AD and control. Figure 5 displays sampled ROI values for FA, PA and MWF in all 14 samples in the hippocampus, white matter, and grey matter. The correlation of values across specimens is relatively low except for between PA and FA in the white matter.Discussion
The most prominent results seen in this study were: 1) distinct differences between relaxivity and diffusivity metrics and 2) striking differences between DTI and MAP-MRI anisotropy metrics. Decreased T2 with increased MD is uncommon and may indicate combined tissue degeneration (increased diffusivity) and proteinopathy load (decreased T2). Increased BPF and NODDI tissue compartment values showing decreased ICVF and increased FISO in the hippocampus are consistent with this interpretation.Anisotropy metric differences were clearly observed by 1D histograms (Figure 4) showing a bimodal distribution for PA, but not FA, potentially corresponding to different tissue environments (e.g. axons vs. dendrites). In the pathologic sample, FA was shifted towards lower values compared to control and the higher PA peak was preferentially reduced. Initial analysis of the full sample set provided some indication of variability in metrics across specimens and correlation between metrics over different pathology stages, but work is ongoing to further evaluate these relationships and to determine the correspondence between these metrics and histopathology.
Conclusion
We have collected a rich dataset and begun to identify distinctive MR markers by both diffusion and relaxometry microstructural MRI methods in human post-mortem specimens with different AD pathology. Our initial findings suggest differential specificity of relaxometry and diffusion metrics to distinct molecular and cellular AD outcomes and that higher order anisotropy metrics such as PA capture outcomes that are not evident by FA alone. Identification of the most promising microstructural MRI metrics in human post-mortem tissue can help guide the development of these markers toward accurate and early clinical diagnosis of AD.Acknowledgements
This research was supported by the NIA/NIH grant R03 780250. All imaging was performed in the UA translational bioimaging resource (TBIR) and made possible by the NIH small instrumentation grant: S10 OD025016. The authors would like to thank High Performance Computing (HPC) for providing the resources needed. Thank you to all the MBSIL members for their support.References
- Beach TG, Monsell SE, Phillips LE, Kukull W. Accuracy of the clinical diagnosis of Alzheimer disease at National Institute on Aging Alzheimer Disease Centers, 2005-2010. J Neuropathol Exp Neurol. 2012 Apr;71(4):266-73.
- Beach TG, Adler CH, Sue LI, Serrano G, Shill HA, Walker DG, et al. Arizona Study of Aging and Neurodegenerative Disorders and Brain and Body Donation Program. Neuropathology. 2015 Aug 1;35(4):354–89.
- Braak H, Thal DR, Ghebremedhin E, Del Tredici K. Stages of the pathologic process in alzheimer disease: Age categories from 1 to 100 years. J Neuropathol Exp Neurol. 2011 Nov;70(11):960–9.
- Özarslan E, Koay CG, Shepherd TM, Komlosh ME, İrfanoğlu MO, Pierpaoli C, Basser PJ. Mean apparent propagator (MAP) MRI: a novel diffusion imaging method for mapping tissue microstructure. Neuroimage. 2013 Sep;78:16-32.
- Irfanoglu MO, Nayak A, Jenkins J, Pierpaoli C. TORTOISE v3: Improvements and New Features of the NIH Di. In: 25th Annual Meeting of the International Society fro Magnetic Resonance in Medicine. Honolulu, HI; 2017.
- Zhang H, Schneider T, Wheeler-Kingshott CA, Alexander DC. NODDI: practical in vivo neurite orientation dispersion and density imaging of the human brain. Neuroimage. 2012;61(4):1000–16.
Figures
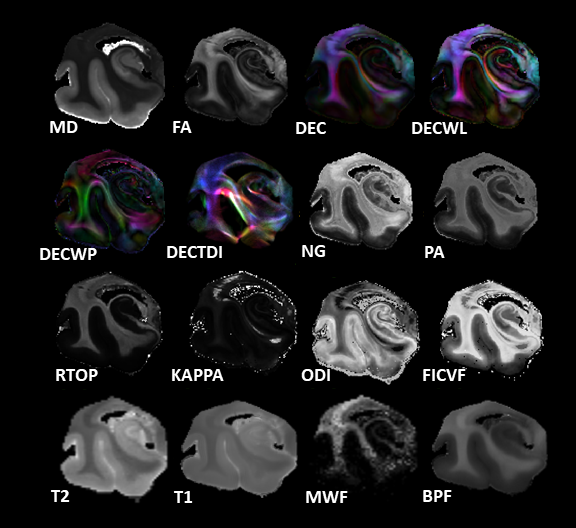
Figure 1: Showcase of microstructural metrics from left to
right DTI (mean diffusivity MD, fractional anisotropy FA, directionally encoded color DEC, linear weighted DEC DECWL, western planer DEC DECWP, tract density imaging DECTDI), mean apparent propagator MAP (non-gaussianity NG, propagator anisotropy PA, return to origin propagator RTOP), NODDI
(KAPPA, orientation distribution index ODI, intracellular volume fraction FICVF), T2, T1, myelin water fraction MWF, and bound pool fraction BPF.
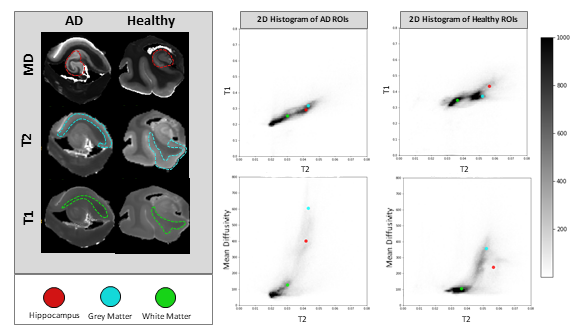
Figure 2: Whole sample joint histograms of T2 vs. T1 and T2
vs. MD for both AD and healthy control. AD displays increased MD and decreased
T2 when compared to healthy control. The hippocampal, grey, and white matter ROIs
are labeled with the red, blue, and green dots respectively.
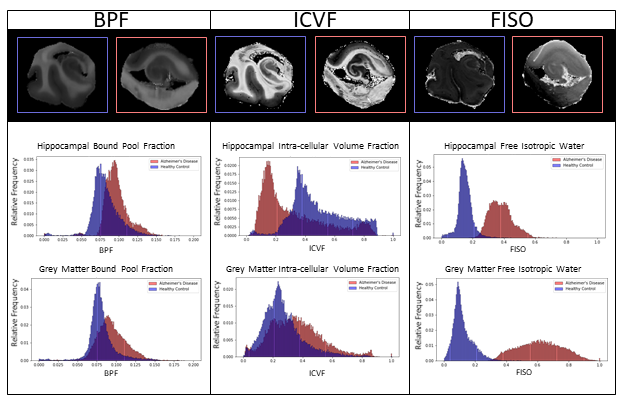
Figure 3: 1D histograms compare AD and healthy control
hippocampi and grey matter ROIs in BPF, ICVF, and FISO. Increased BPF intensity
in AD could be indicative of increased proteinopathy. AD hippocampus decreased
ICVF and increased FISO intensity could indicate tissue degeneration.
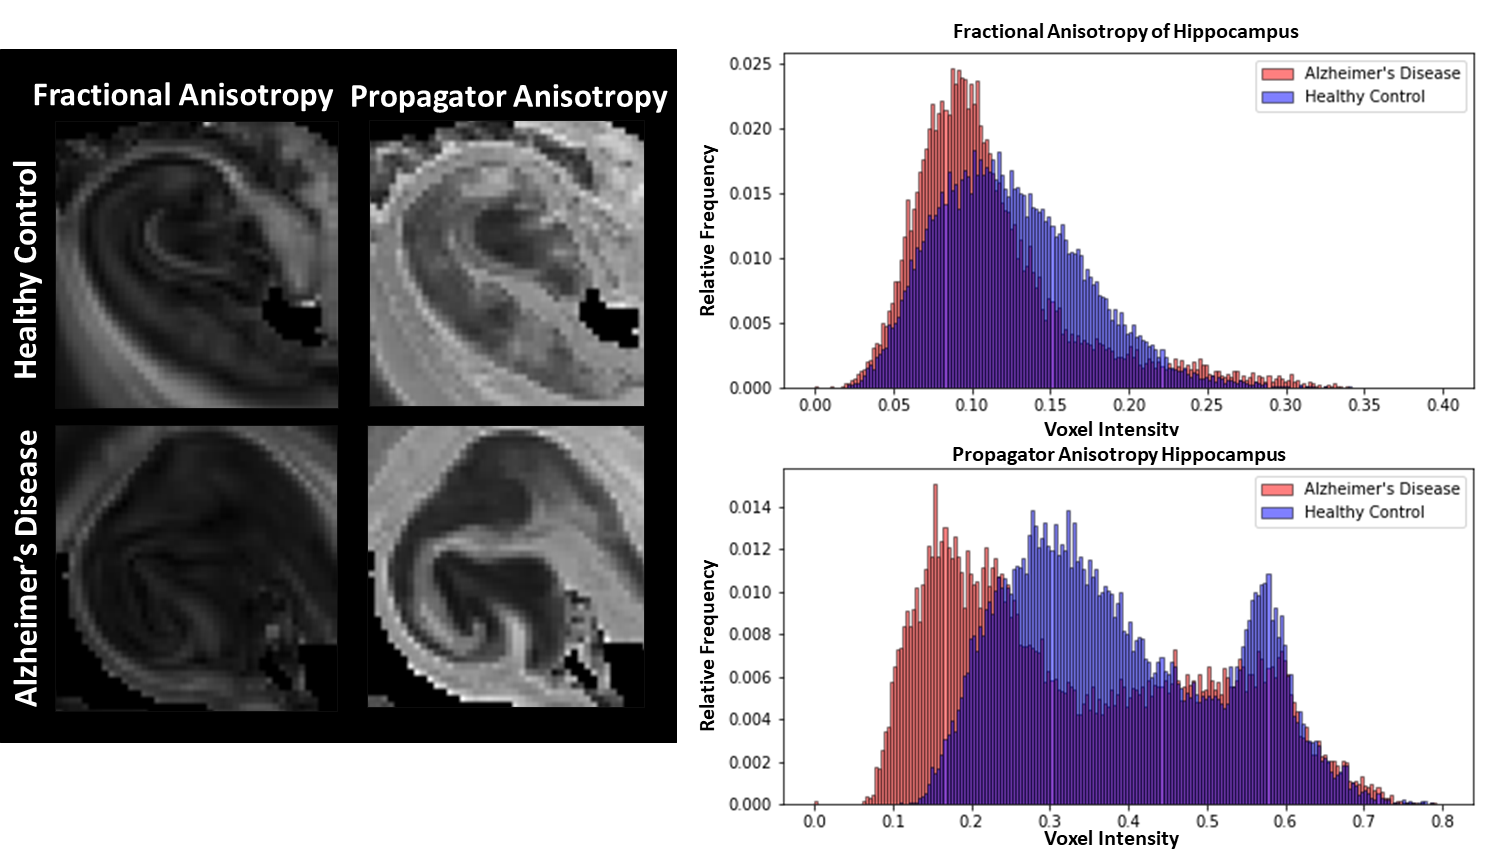
Figure 4: AD and control hippocampi compared in the FA and
PA 1D histograms. There are different anisotropy patterns between FA and PA,
but AD shows a consistent decrease in anisotropy.
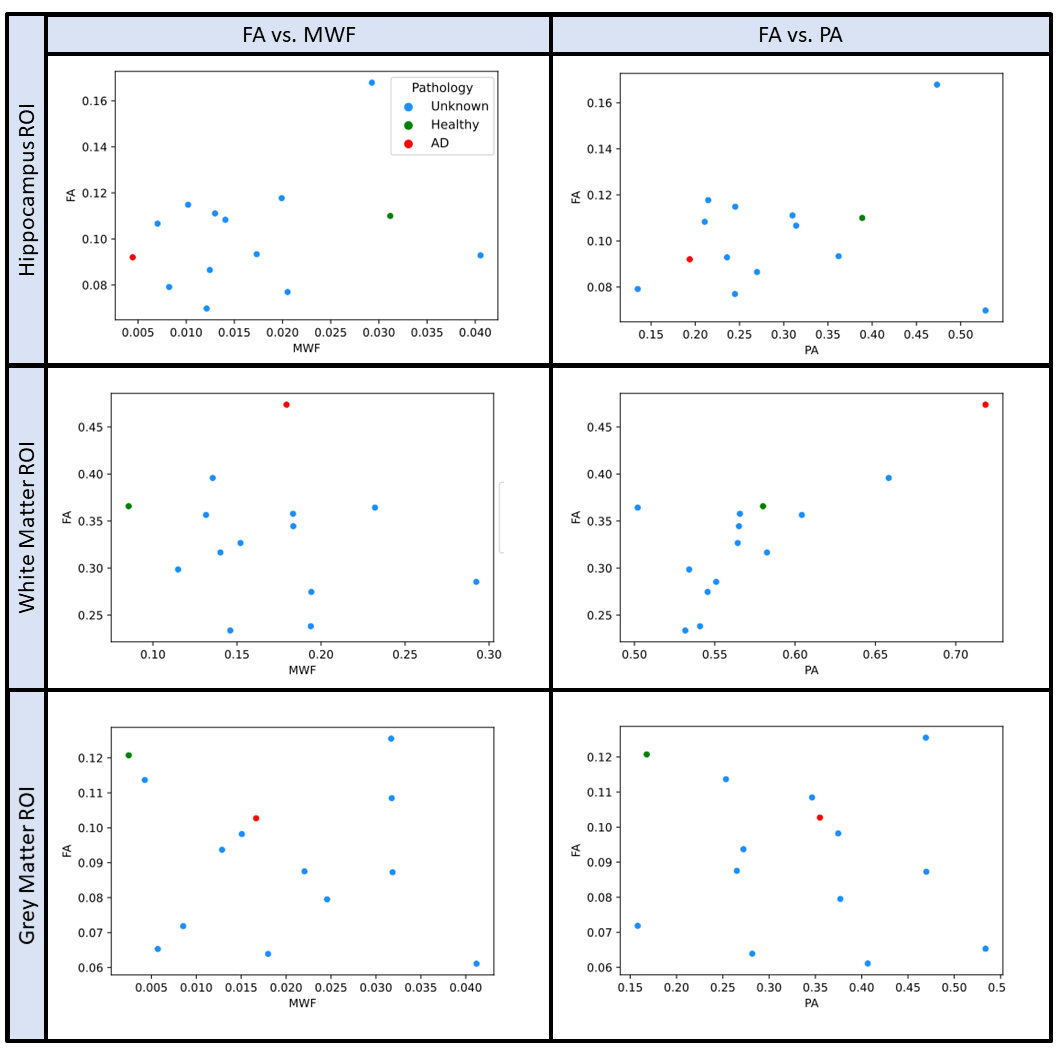
Figure
5: Sampled FA, MWF, and PA values for small hippocampi, white matter, and grey
matter sectional ROIs. All fourteen samples are plotted with the known
pathologies labeled red for AD and green for healthy control. There is relatively
low correlation of values across specimens, except for FA and PA in white
matter and hippocampus. There is also higher correlation in hippocampi FA vs
MWF.
DOI: https://doi.org/10.58530/2022/0459