0458
White matter changes in myelin, iron and R2* in Alzheimer's disease1Neuro-imaging, King's College London, London, United Kingdom
Synopsis
Brain iron dyshomeostasis/iron overload has been observed in Alzheimer's disease (AD). Being sensitive to the presence of iron, magnetic resonance imaging (MRI), is often used to study the role of iron in disease. In this study, we determined group differences in iron, R2* and myelin, acquired from the same ex-vivo mid-temporal gyri samples from AD and cognitively normal (CN) subjects. We observed decreased myelin and iron in white matter AD compared to CN. These white matter changes are likely due to a loss of iron-rich oligodendrocytes and demyelination during AD pathogenesis.
Introduction
Brain iron dyshomeostasis may contribute to neurodegeneration in Alzheimer's disease (AD)1, the most common subtype of dementia2. Iron is essential for many physiological processes in the brain, including mitochondria respiration and myelination. However, high iron levels are harmful, inducing oxidative stress3 and eventually cell death - including by ferroptosis, the recently discovered form of iron-dependent cell death4.Magnetic resonance imaging (MRI) is used to image brain iron in-vivo as iron increases the MRI relaxation rates R1, R2, R2*, and has been used to study the role of iron in neurodegeneration and for monitoring iron chelation therapies5. However, MRI does not simply provide a quantitative measure of iron since relaxation rates can be modified by other factors, particularly myelin6.
In this study, we investigated whether uni- and bi-variate distributions of iron content, R2* and myelin in mid-temporal gyri samples differed between cognitively normal (CN) and AD subjects, conditioning for tissue type: white matter (WM), grey matter (GM), and mid-cortical layer (MCL). Uniquely, this study has corresponding R2*, myelin and quantitative iron data, enabling pixel-to-pixel comparison after image registration.
Methods
Samples: Post-mortem formalin-fixed mid-temporal gyri samples, comprising white and grey matter from AD (Braak stages V-VI) and age/sex-matched CN subjects (n = 15/group) were obtained from the MRC London Neurodegenerative Diseases Brain Bank.MRI: Samples were embedded in Fomblin™ and underwent ex-vivo T2* (R2*) mapping using a 2D gradient echo sequence at 7T at 100µm resolution. After MRI, samples were wax-embedded.
Iron mapping and immunohistochemistry (IHC): Wax-embedded samples were sectioned at 7µm thick onto X-ray fluorescence (XRF) film for Synchrotron-Radiation XRF (SR-XRF) mapping, and adjacent sections onto glass microscope slides for IHC. Sections underwent SR-XRF at 100µm resolution to provide quantitative iron maps. For IHC, sections were double-stained with luxol fast blue (LFB, for myelin) and a cresyl violet stain (nissl bodies). All sections on slides were scanned/digitized at 40x magnification.
Segmentation: Gaussian mixture models were trained on double stained IHC images to obtain myelin-only images.
Registration: Iron and R2* maps, and the myelin image for each subject were co-registered using two-stage, slice-to-volume registration with the Insight Toolkit (ITK) library. Overlap measures (dice score, undirected hausdorff distance, mean contour distance) between the fixed and moving WM regions were computed to assess registration performance.
Statistical analysis: Distributions of pixel values were visualised for iron content, R2* and myelin, conditioned on disease status and tissue type. Two-sample Kolmogorov-Smirnov (KS) tests were computed to compare the distribution of AD vs. CN subjects. For bivariate distributions, the Spearman correlation coefficient was computed, and the joint distribution plotted, again conditioning on disease status and tissue type. The significance level of 0.01 was adjusted for large sample size7 to 0.00026.
Results
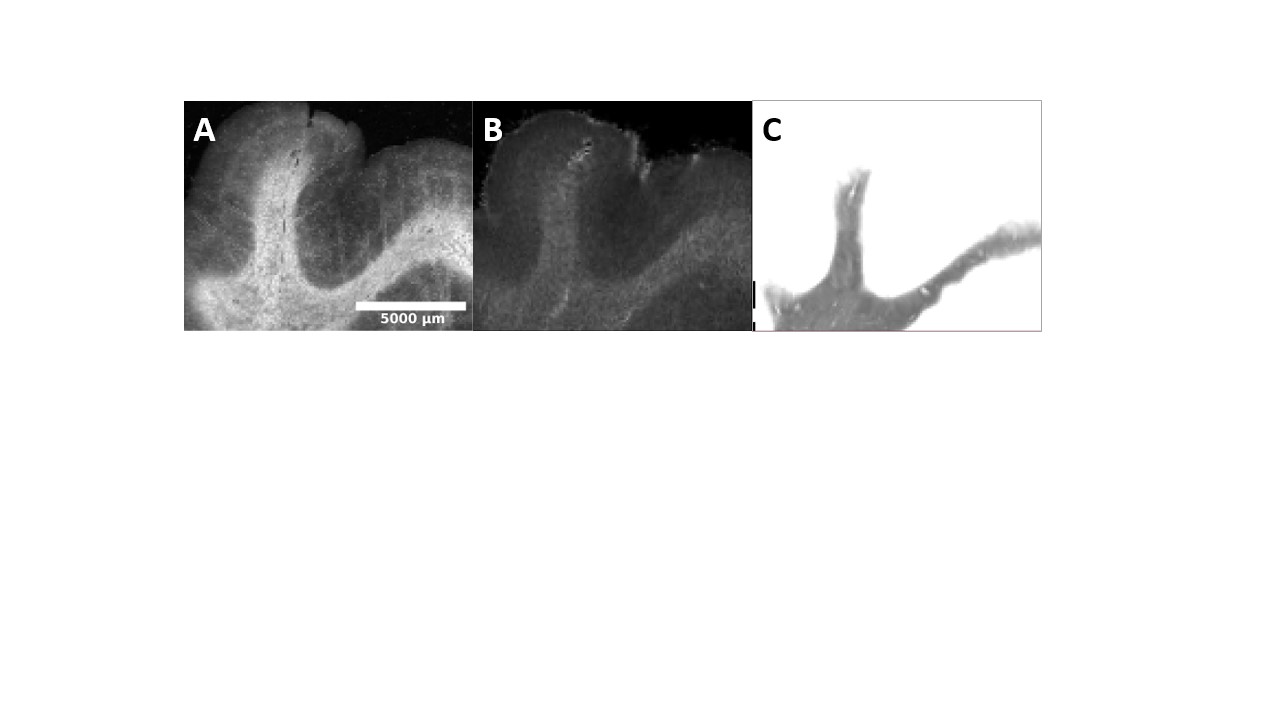
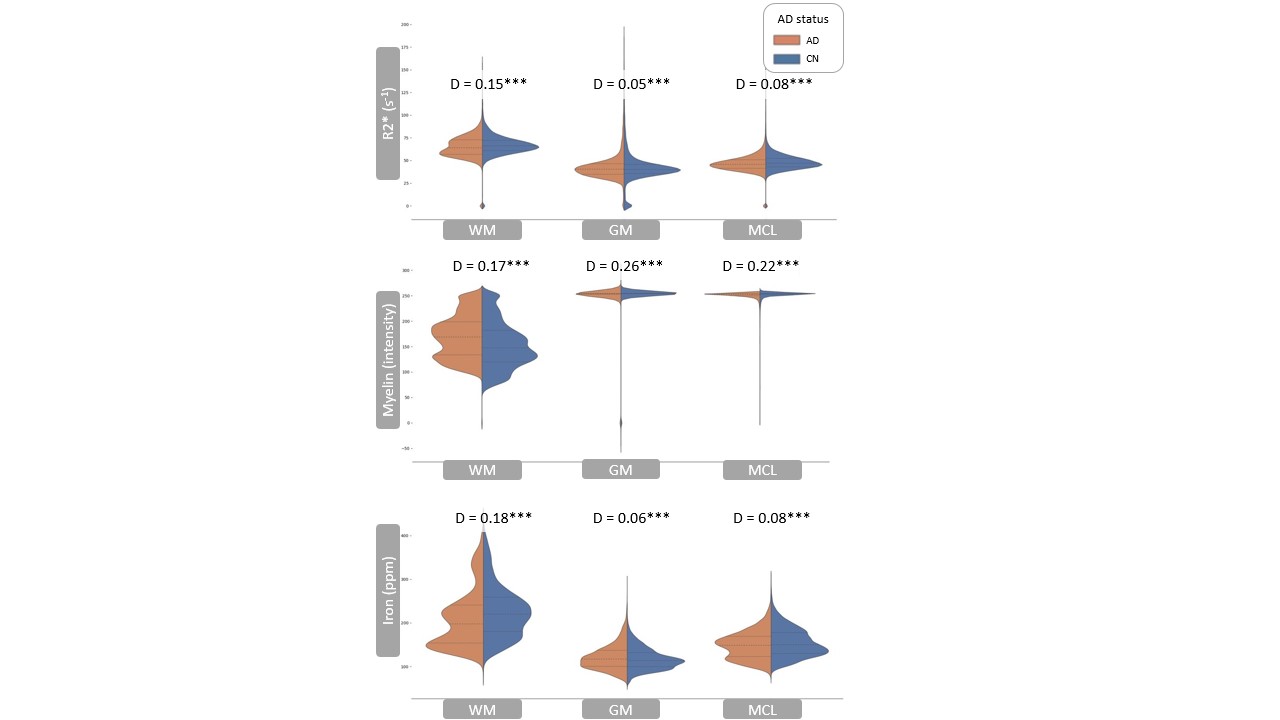
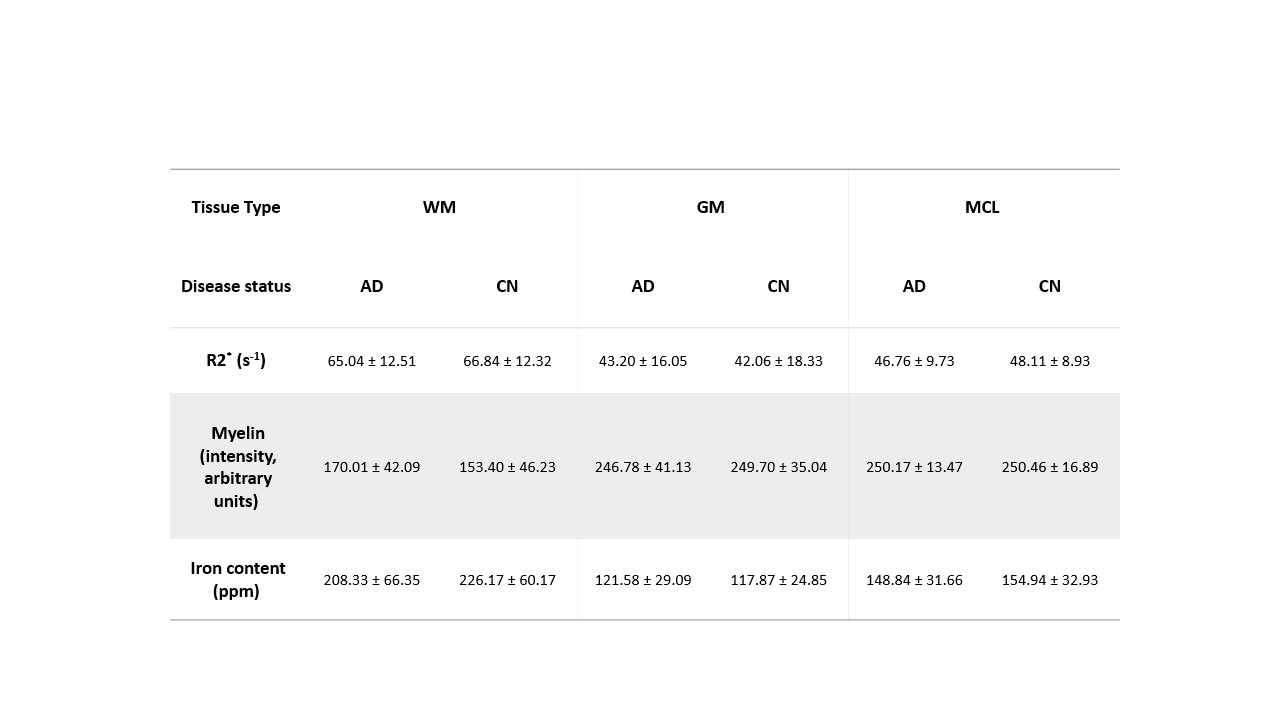
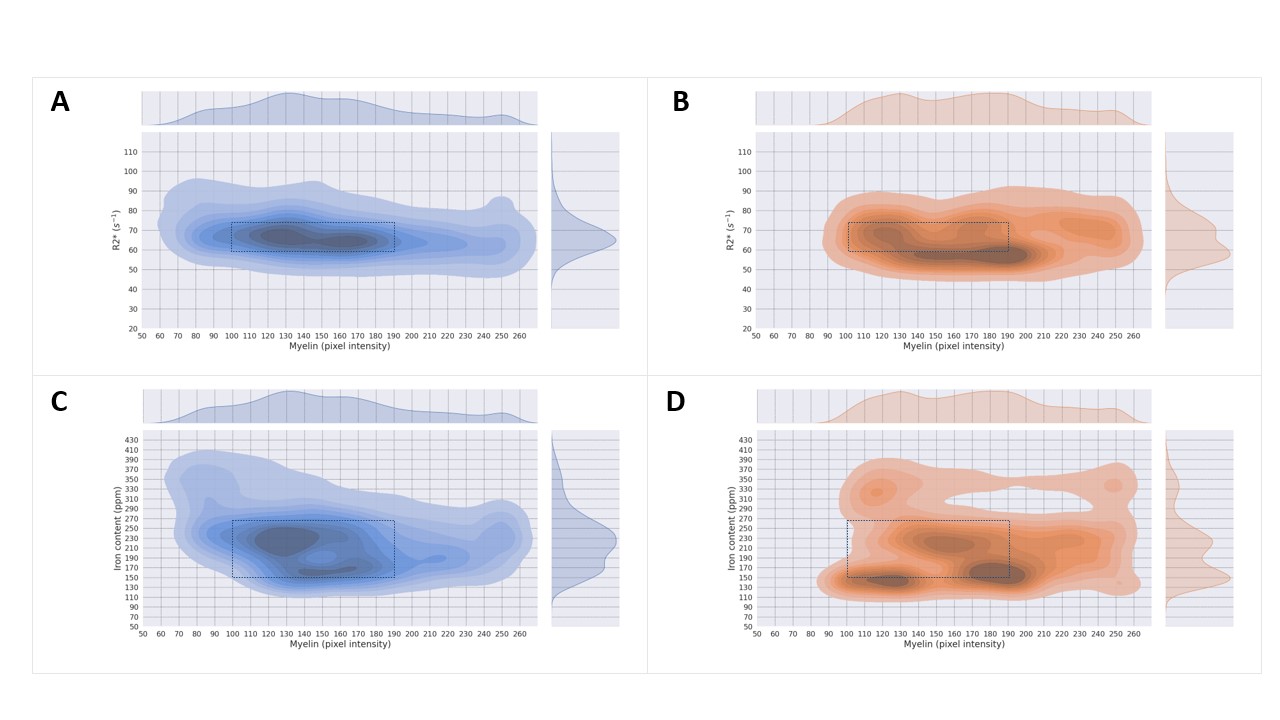
Registered iron, R2* and myelin images from one subject are shown in Fig. 1 and registration performance results are provided in Table 1. Substantial differences between CN and AD subjects were observed in the WM rather than GM (Fig. 2 and Table 2). Both myelin and iron content were reduced in AD WM compared to CN WM. Furthermore, the WM R2* distribution was bimodal for AD but monomodal for CN. R2*, LFB and iron were significantly correlated (|r| from 0.54 to 0.57), consistent with previous literature6. The WM myelin-R2* and myelin-iron joint distributions are shown in Fig. 3.Discussion
The greatest differences between CN and AD were observed in the WM, so only WM data will be discussed here. Interestingly, AD is often considered a GM disease, although WM changes are evident early in disease8. Reduced myelin content and the tendency of pixels to have lower R2* and myelin in AD, is consistent with demyelination observed in this disease stage.The reduction in iron in AD WM was unexpected. There has been much debate whether brain iron is increased in AD, with the conclusion that iron is elevated but only in certain brain regions9. However, there are few studies that measure individual GM and WM iron contents as we have done here, which is only possible with spatial rather than bulk iron measurements. Oligodendrocytes, whose membranes form myelin, are the highest iron-containing cell in the brain. Reduced WM iron content in AD is consistent with the loss of iron-laden oligodendrocytes and greater demyelination. Inspecting the iron-LFB joint distribution of AD WM, most pixels have reduced myelin and iron content compared to CN WM. Furthermore, the ratio of iron to myelin is different between AD WM and CN WM, with iron content remaining constant although myelin levels are distinctively different. Iron is crucial for myelination and the change in iron-myelin ratio in AD WM may lead to, or result from, dysregulated iron metabolism in oligodendrocytes.
Conclusion
We conclude that there are significant WM changes in AD, likely due to a loss of iron-rich oligodendrocytes associated with demyelination in AD. However, further investigations are needed to determine if the demyelination observed in AD arises specifically from defective iron metabolism in oligodendrocytes.Acknowledgements
Thanks to the London Neurodegenerative Diseases Brain Bank, from which the post-mortem human brain samples used in this study were obtained. The Brain Bank receives funding from the Medical Research Council UK and as part of the Brains for Dementia Research programme, jointly funded by Alzheimer’s Research UK and the Alzheimer’s Society.Thanks to the British Heart Foundation for funding the 7 T MRI scanner used in this study; the UCL microscope facility for scanning the stained histological slides and Diamond Light Source for access to beamline I18 to perform SRXRF elemental mapping. Lindsay Munroe and Azhaar Ashraf would like to acknowledge funding from the Engineering and Physical Sciences Research Council (EPSRC) and the EPSRC Centre for Doctoral Training in Smart Medical Imaging (EP/S022104/1).
References
1. Ashraf A, Jeandriens J, Parkes HG, So PW. Iron dyshomeostasis, lipid peroxidation and perturbed expression of cystine/glutamate antiporter in Alzheimer’s disease: evidence of ferroptosis. Redox biology. 2020 May 1;32:101494.
2. Wittenberg R, Hu B, Barraza-Araiza L, Rehill A. Projections of older people with dementia and costs of dementia care in the United Kingdom, 2019–2040. London: London School of Economics. 2019 Nov.
3. Kruszewski M. Labile iron pool: the main determinant of cellular response to oxidative stress. Mutation Research/Fundamental and Molecular Mechanisms of Mutagenesis. 2003 Oct 29;531(1-2):81-92.
4. Dixon SJ, Lemberg KM, Lamprecht MR, Skouta R, Zaitsev EM, Gleason CE, Patel DN, Bauer AJ, Cantley AM, Yang WS, Morrison III B. Ferroptosis: an iron-dependent form of nonapoptotic cell death. Cell. 2012 May 25;149(5):1060-72.
5. Ashraf A, Clark M, So PW. The aging of iron man. Frontiers in aging neuroscience. 2018 Mar 12;10:65.
6. De Barros A, Arribarat G, Combis J, Chaynes P, Péran P. Matching ex vivo MRI with iron histology: pearls and pitfalls. Frontiers in neuroanatomy. 2019 Jul 3;13:68.
7. Good IJ. The Bayes/non-Bayes compromise: A brief review. Journal of the American Statistical Association. 1992 Sep 1;87(419):597-606.
8. Nasrabady SE, Rizvi B, Goldman JE, Brickman AM. White matter changes in Alzheimer’s disease: a focus on myelin and oligodendrocytes. Acta neuropathologica communications. 2018 Dec;6(1):1-0.
9. Tao Y, Wang Y, Rogers JT, Wang F. Perturbed iron distribution in Alzheimer's disease serum, cerebrospinal fluid, and selected brain regions: a systematic review and meta-analysis. Journal of Alzheimer's Disease. 2014 Jan 1;42(2):679-90.
Figures