0457
Inter-subject differences in SAR sensitivity to motion with parallel-transmit at 7T.1Cardiff University, Cardiff, United Kingdom
Synopsis
Specific absorption rate (SAR) is sensitive to head motion, especially in parallel-transmit (pTx) due to channel interference. It is known that SAR distribution varies according to subject anatomy. Here, we investigate whether SAR sensitivity to motion also depends on the subject. We designed quadrature-mode and pTx pulses at a centred position and evaluated them at 29 displaced positions. We compared the motion-induced SAR change across 4 body-models. We observed some variation across models, but local-SAR at least doubled in all models’ worst-cases. Our findings suggest that the safety concerns surrounding motion effects on SAR are relevant for various populations.
Background
Previous studies show that specific absorption rate (SAR) is sensitive to head motion, particularly when using parallel transmit (pTx) coils1-4, causing safety limits to be exceeded. SAR has been found to vary between subjects, even without motion5,6. It has also been shown that motion sensitivity of SAR depends on coil geometry, with SAR for smaller pTx coil loop size and/or smaller array radius being more motion-sensitive than that of larger coils3. Here, we investigate whether (and to what degree) SAR sensitivity to motion depends on the subject and their anatomy by comparing the sensitivity of SAR to motion across four virtual human body models.Methods
Billie, Duke, Ella and Dizzy of the Virtual Population7 were simulated with a generic 8-channel pTx coil tuned to 295MHz in Sim4Life (Zurich MedTech, Zurich). Each model was simulated at 30 positions (Figure 1c). Positions were right 0,2,4,5,10,20mm and posterior 0,2,4,5,10mm, including all off-axis combinations. Figure 1a shows approximate head size (anterior-posterior and medial-lateral) for each model. The Duke model was scaled to 90% of it’s original size to avoid overlapping the coil and body models. The coil was displaced (rather than the body models) so that voxelization within body models was consistent across positions.Quadrature-mode, and pTx (1,2,3,5-spokes) excitation pulses were designed to uniformly excite an axial slice8,9. Pulses were designed with the B1-map from the centred position for each body model. pTx pulses were designed at 7 slice locations spanning a 10.8cm slab (figure 1b). Q-matrices10 were used for SAR calculation, and SAR was evaluated in terms of three metrics: gSAR (whole-head), psSAR (10g-average local), and eigSAR (using the eigenvalue of the Q-matrices). Peak (for psSAR and eigSAR) or total (for gSAR) SAR was evaluated at each off-centre position, and was normalised by SAR for the same pulse at the centre position (SARcentre; i.e. the no-motion case) to quantify change in SAR due to motion. Values are therefore reported as a factor or percentage of SARcentre. The volume of tissue exceeding psSARcentre was also analysed for each case.
Results
In quadrature mode, psSAR doubled for the Ella model (2.0-fold), however sensitivity varied substantially across models (fig. 2c). Worst-cases for Dizzy, Billie and Duke models were 1.6, 1.3 and 1.2, respectively. For quadrature pulses, higher SARcentre (not shown) coincided with a lower SAR sensitivity to motion. gSAR was relatively insensitive (fig. 2a), yielding worst-cases between 1.01 (Billie) and 1.04 (Ella).In pTx mode, psSAR was highly sensitive to motion across all body models (fig. 2d), but worst- (and best-) cases did not occur for the same slice / number of spokes across models (fig. 3). Worst-case psSAR more-than-doubled for Billie (2.4-fold at slice 5 with 5-spokes), almost tripled for Ella (2.9-fold at slice 1 with RF-shimming) and tripled for Duke (3.0-fold at slice 5 with 5-spokes) and Dizzy (3.1-fold at slice 2 with RF-shimming). Furthermore, the hotspot changed location in Billie and Dizzy worst-cases, but not Ella and Duke (fig. 4b). gSAR was less sensitive than psSAR, and worst-cases were similar across models (between 1.3 and 1.4; fig. 2b).
pTx pulses designed for the inferior-most and superior-most slices consistently yielded higher SARcentre (not shown), but were less sensitive to motion. These intra-model differences in SARcentre dominated over inter-model differences. Similarly, the amount of tissue experiencing increased psSAR exceeded 100cm3 for all models’ worst-cases (fig. 4a), but generally varied according to slice moreso than body model.
EigSAR ranged between approximately 0.9 and 1.4 for all body models except Duke, where EigSAR doubled following a rightward displacement of 20mm (fig. 5).
Discussion
Our results for Ella are in line with previous reports1-3, however we found variation for local-SAR across models, with worst-cases ranging between 2.4 and 3.1-fold that without motion.For realistic pulses, local-SAR sensitivity varied across body models in quadrature as well as pTx modes, though pTx yielded the largest SAR increase for all models. As expected, we found psSAR to be more motion-sensitive than gSAR, however similarities in the low gSAR sensitivity across body models may mask these important psSAR differences. EigSAR, which is independent of the pulse used, varied somewhat across models, but was also much less sensitive than psSAR.
Differences in sensitivity between models cannot be disentangled from differences due to initial patient positioning. For example, Duke’s nose was very close to the anterior-most coil, meaning SAR response to a given displacement may be different to other, differently placed models11. However, since both issues are relevant in practice, it is useful to consider them simultaneously.
We applied the same displacements to all body models, however, children may be more prone to motion. Therefore, SAR variability may show different patterns when the amount of motion that occurs in practice is also considered.
Conclusion
Motion-sensitivity of SAR (especially local-SAR) in pTx is variable across subjects, with models’ worst-cases occurring with different pulse types (number of spokes), and at different slice locations. Despite the variation observed, all models experienced an over-doubling of local-SAR due to motion in their respective worst-cases, demonstrating that as a safety concern, this issue is not limited to certain populations.Acknowledgements
No acknowledgement found.References
1. Kopanoglu E, Deniz CM, Erturk MA, Wise RG. Specific absorption rate implications of within‐scan patient head motion for ultra‐high field MRI. Magnetic Resonance in Medicine 2020.
2. Kopanoglu E, Plumley A, Erturk MA, Deniz C, Wise R. Implications of within-scan patient head motion on B1+ homogeneity and Specific Absorption Rate at 7T. Proc Intl Soc Mag Reson Med 27 2019.
3. Plumley A, Schmid P, Kopanoglu E. Parallel-transmit coil dimensions affect SAR sensitivity to motion at 7T. Proc Intl Soc Mag Reson Med 29 2021:2315.
4. Ajanovic AH, Joseph; Tomi-Tricot; Raphael, Malik, Shaihan. Motion and Pose Variability of SAR Estimation with Parallel Transmission at 7T. 2021. p 2487.
5. De Greef M, Ipek O, Raaijmakers AJE, Crezee J, Van Den Berg CAT. Specific absorption rate intersubject variability in 7T parallel transmit MRI of the head. Magnetic Resonance in Medicine 2013;69(5):1476–1485-1476–1485.
6. Ipek O, Raaijmakers AJ, Lagendijk JJ, Luijten PR, van den Berg CA. Intersubject local SAR variation for 7T prostate MR imaging with an eight-channel single-side adapted dipole antenna array. Magn Reson Med 2014;71(4):1559-1567.
7. Gosselin M-C, Neufeld E, Moser H, Huber E, Farcito S, Gerber L, Jedensjö M, Hilber I, Gennaro FD, Lloyd B, et al. Development of a new generation of high-resolution anatomical models for medical device evaluation: the Virtual Population 3.0. Physics in Medicine & Biology 2014;59(18):5287–5303-5287–5303.
8. Grissom W, Yip C-Y, Zhang Z, Stenger VA, Fessler JA, Noll DC. Spatial domain method for the design of RF pulses in multicoil parallel excitation. Magnetic Resonance in Medicine 2006;56(3):620–629-620–629.
9. Kopanoglu E, Constable RT. Radiofrequency pulse design using nonlinear gradient magnetic fields. Magnetic Resonance in Medicine 2015;74(3):826–839-826–839.
10. Graesslin I, Homann H, Biederer S, Börnert P, Nehrke K, Vernickel P, Mens G, Harvey P, Katscher U. A specific absorption rate prediction concept for parallel transmission MR. Magnetic Resonance in Medicine 2012;68(5):1664–1674-1664–1674.
11. Kopanoglu E. Patient specific parallel transmit pulses are patient position dependent while safety models are fixed: safety implications. Proc Intl Soc Mag Reson Med 29 2021:2299.
Figures
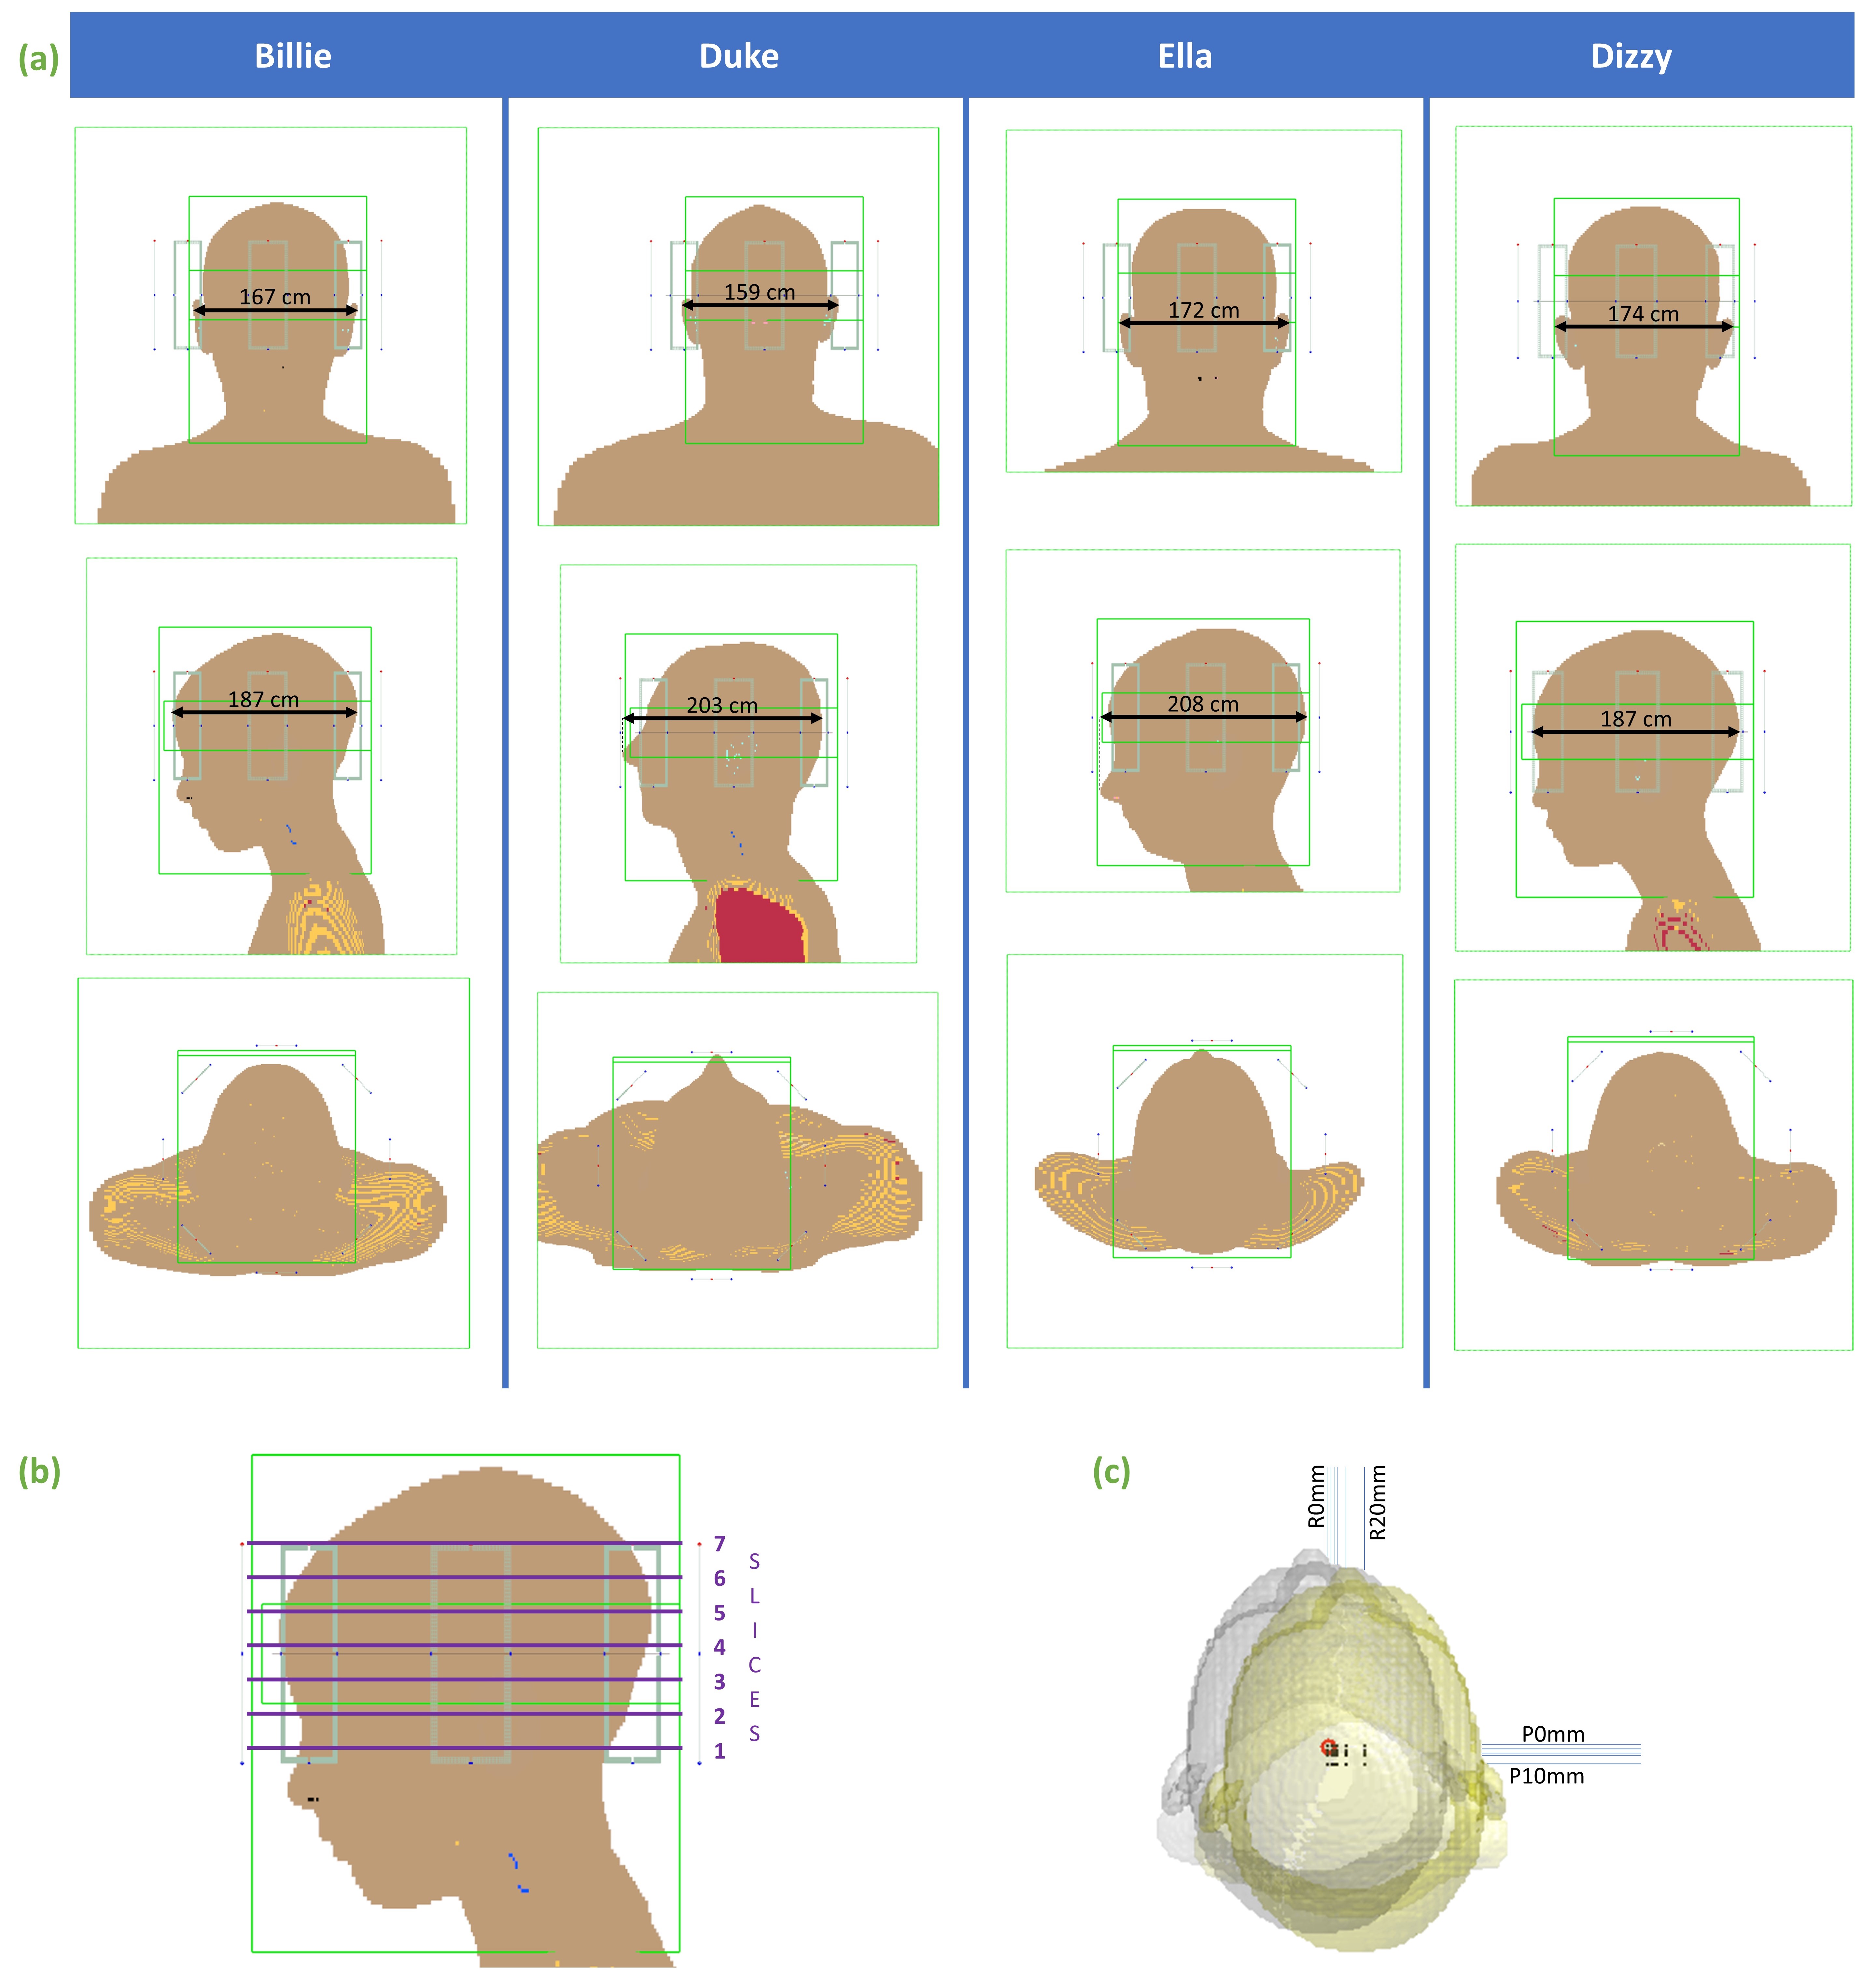
Fig 1a) Simulation models and approximate head dimensions. Models are shown in the centre position. b) slices for which pTx pulses were designed. Quadrature pulses were designed for slice 4, but this is arbitrary since relative SAR (i.e. change due to motion) in quadrature mode is independent of slice. c) positions simulated (R=rightward, P=posterior displacement; origins per position shown with black dots). Grey and yellow isosurfaces show centre and maximally-displaced positions, respectively.
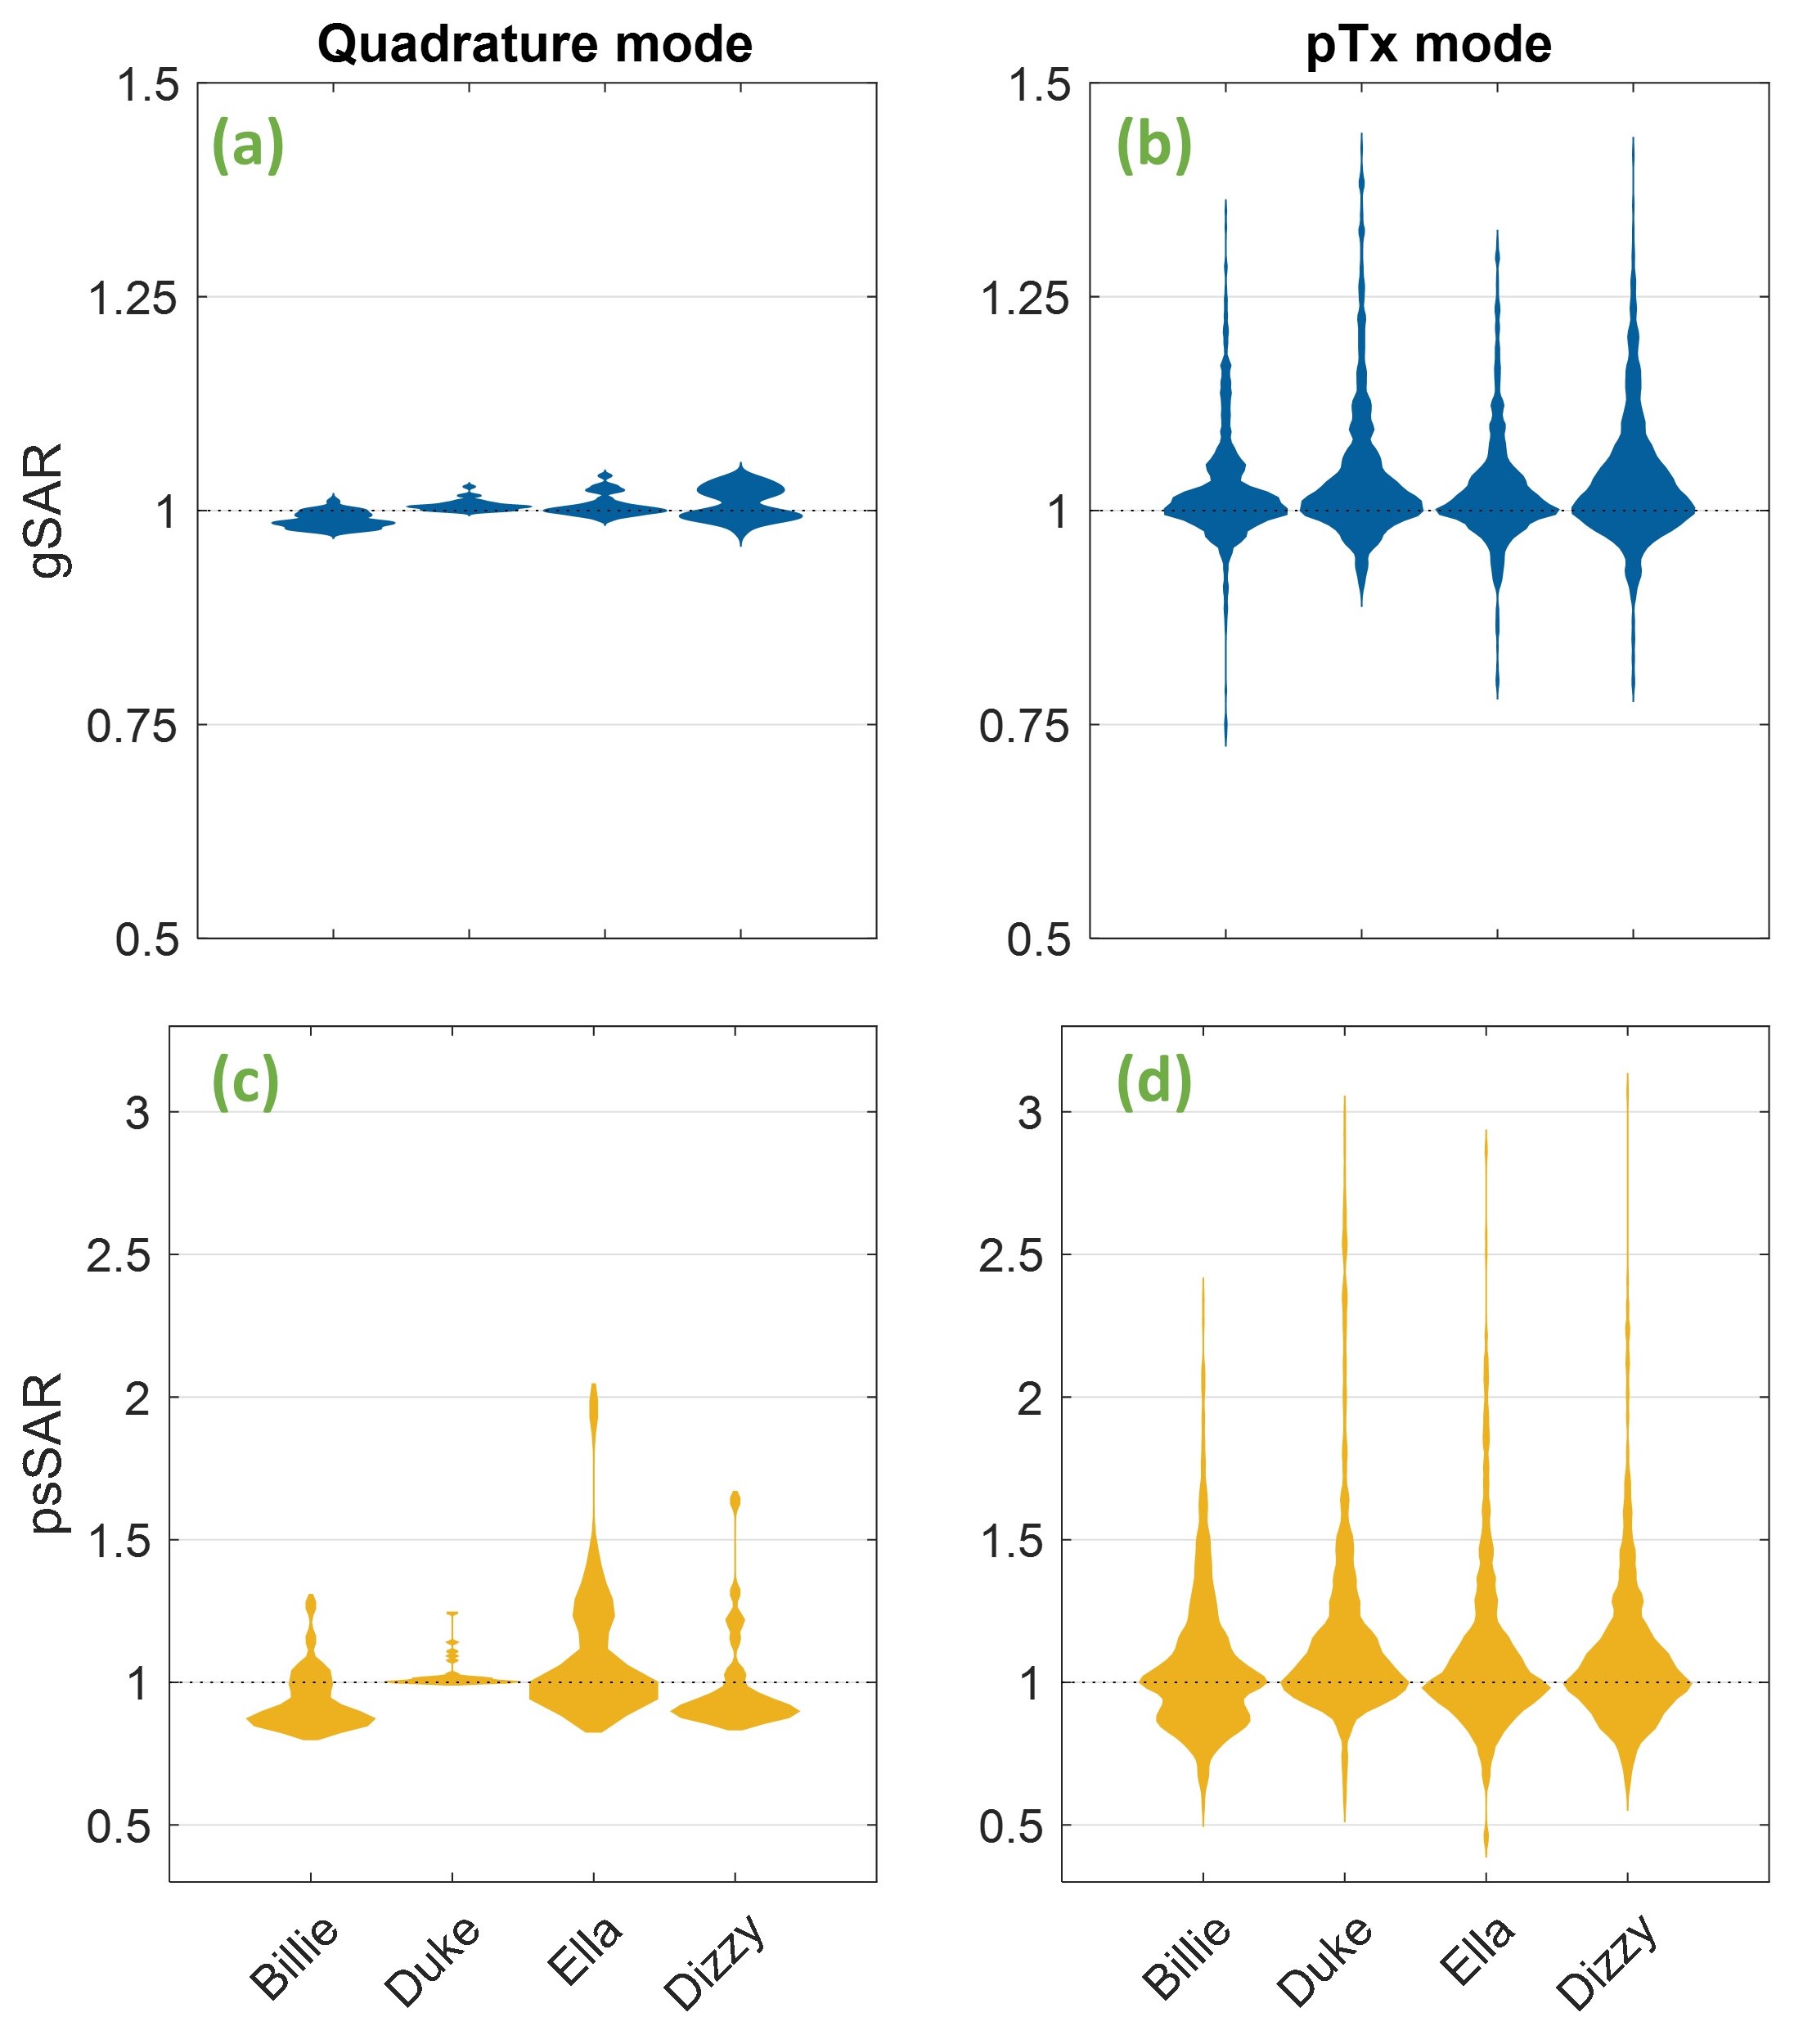
Fig 2 Top: Whole-head (gSAR) when using quadrature (a) and pTx (b) modes. Below: Peak 10g-local SAR (psSAR) for quadrature (c) and pTx (d) modes. SAR for quadrature mode is independent of slice and number of spokes, so only one quadrature pulse was designed per model, meaning quadrature violin plots contain 30 evaluations per model. pTx plots contain all pTx pulse evaluations (840 in total) per body model. In each case, SAR is shown as a factor of that of the same pulse without motion (SARcentre).
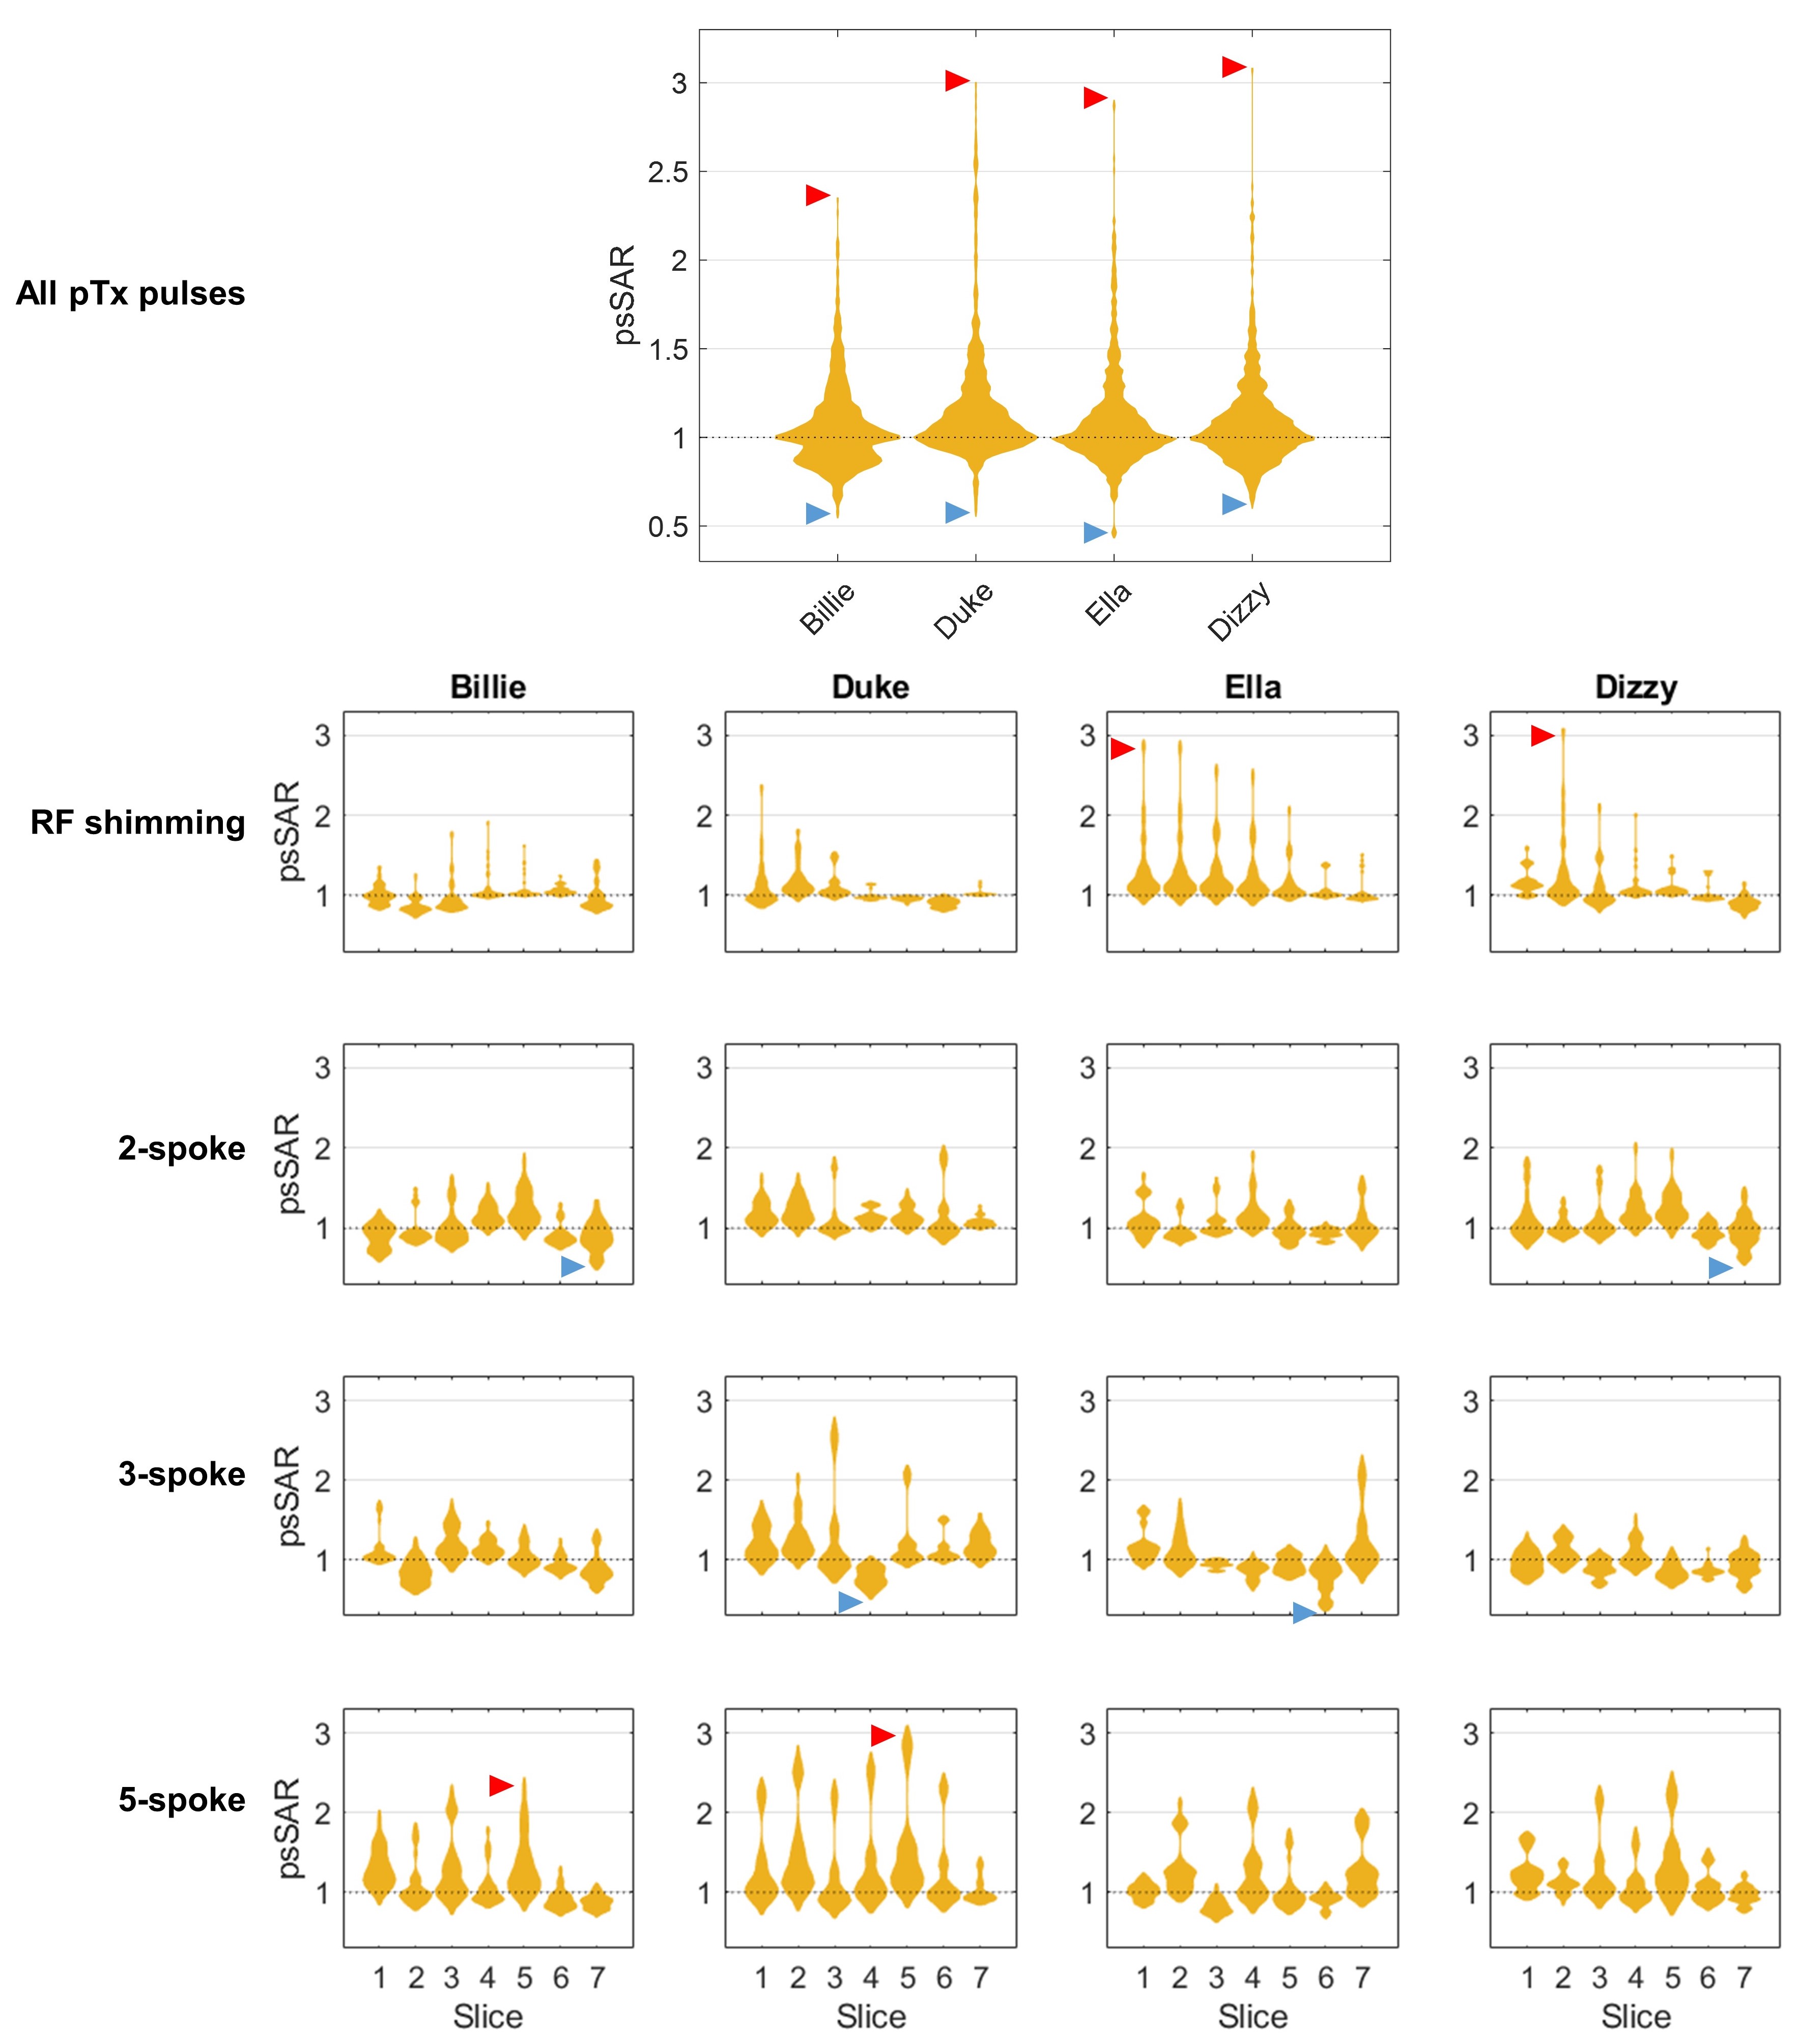
Fig 3 Local-SAR (psSAR) sensitivity of pTx pulses to motion, split by slice location and number of spokes (RF shimming=1 spoke). Each independent violin plot contains the 30 evaluations (all positions) for that pulse. SAR is shown as a factor of that of the same pulse without motion. Each body model’s lowest and highest observed psSAR are indicated with blue and red arrows, respectively. The top, large panel shows the same information as in fig. 2d (i.e. all pTx evaluations for each body model).
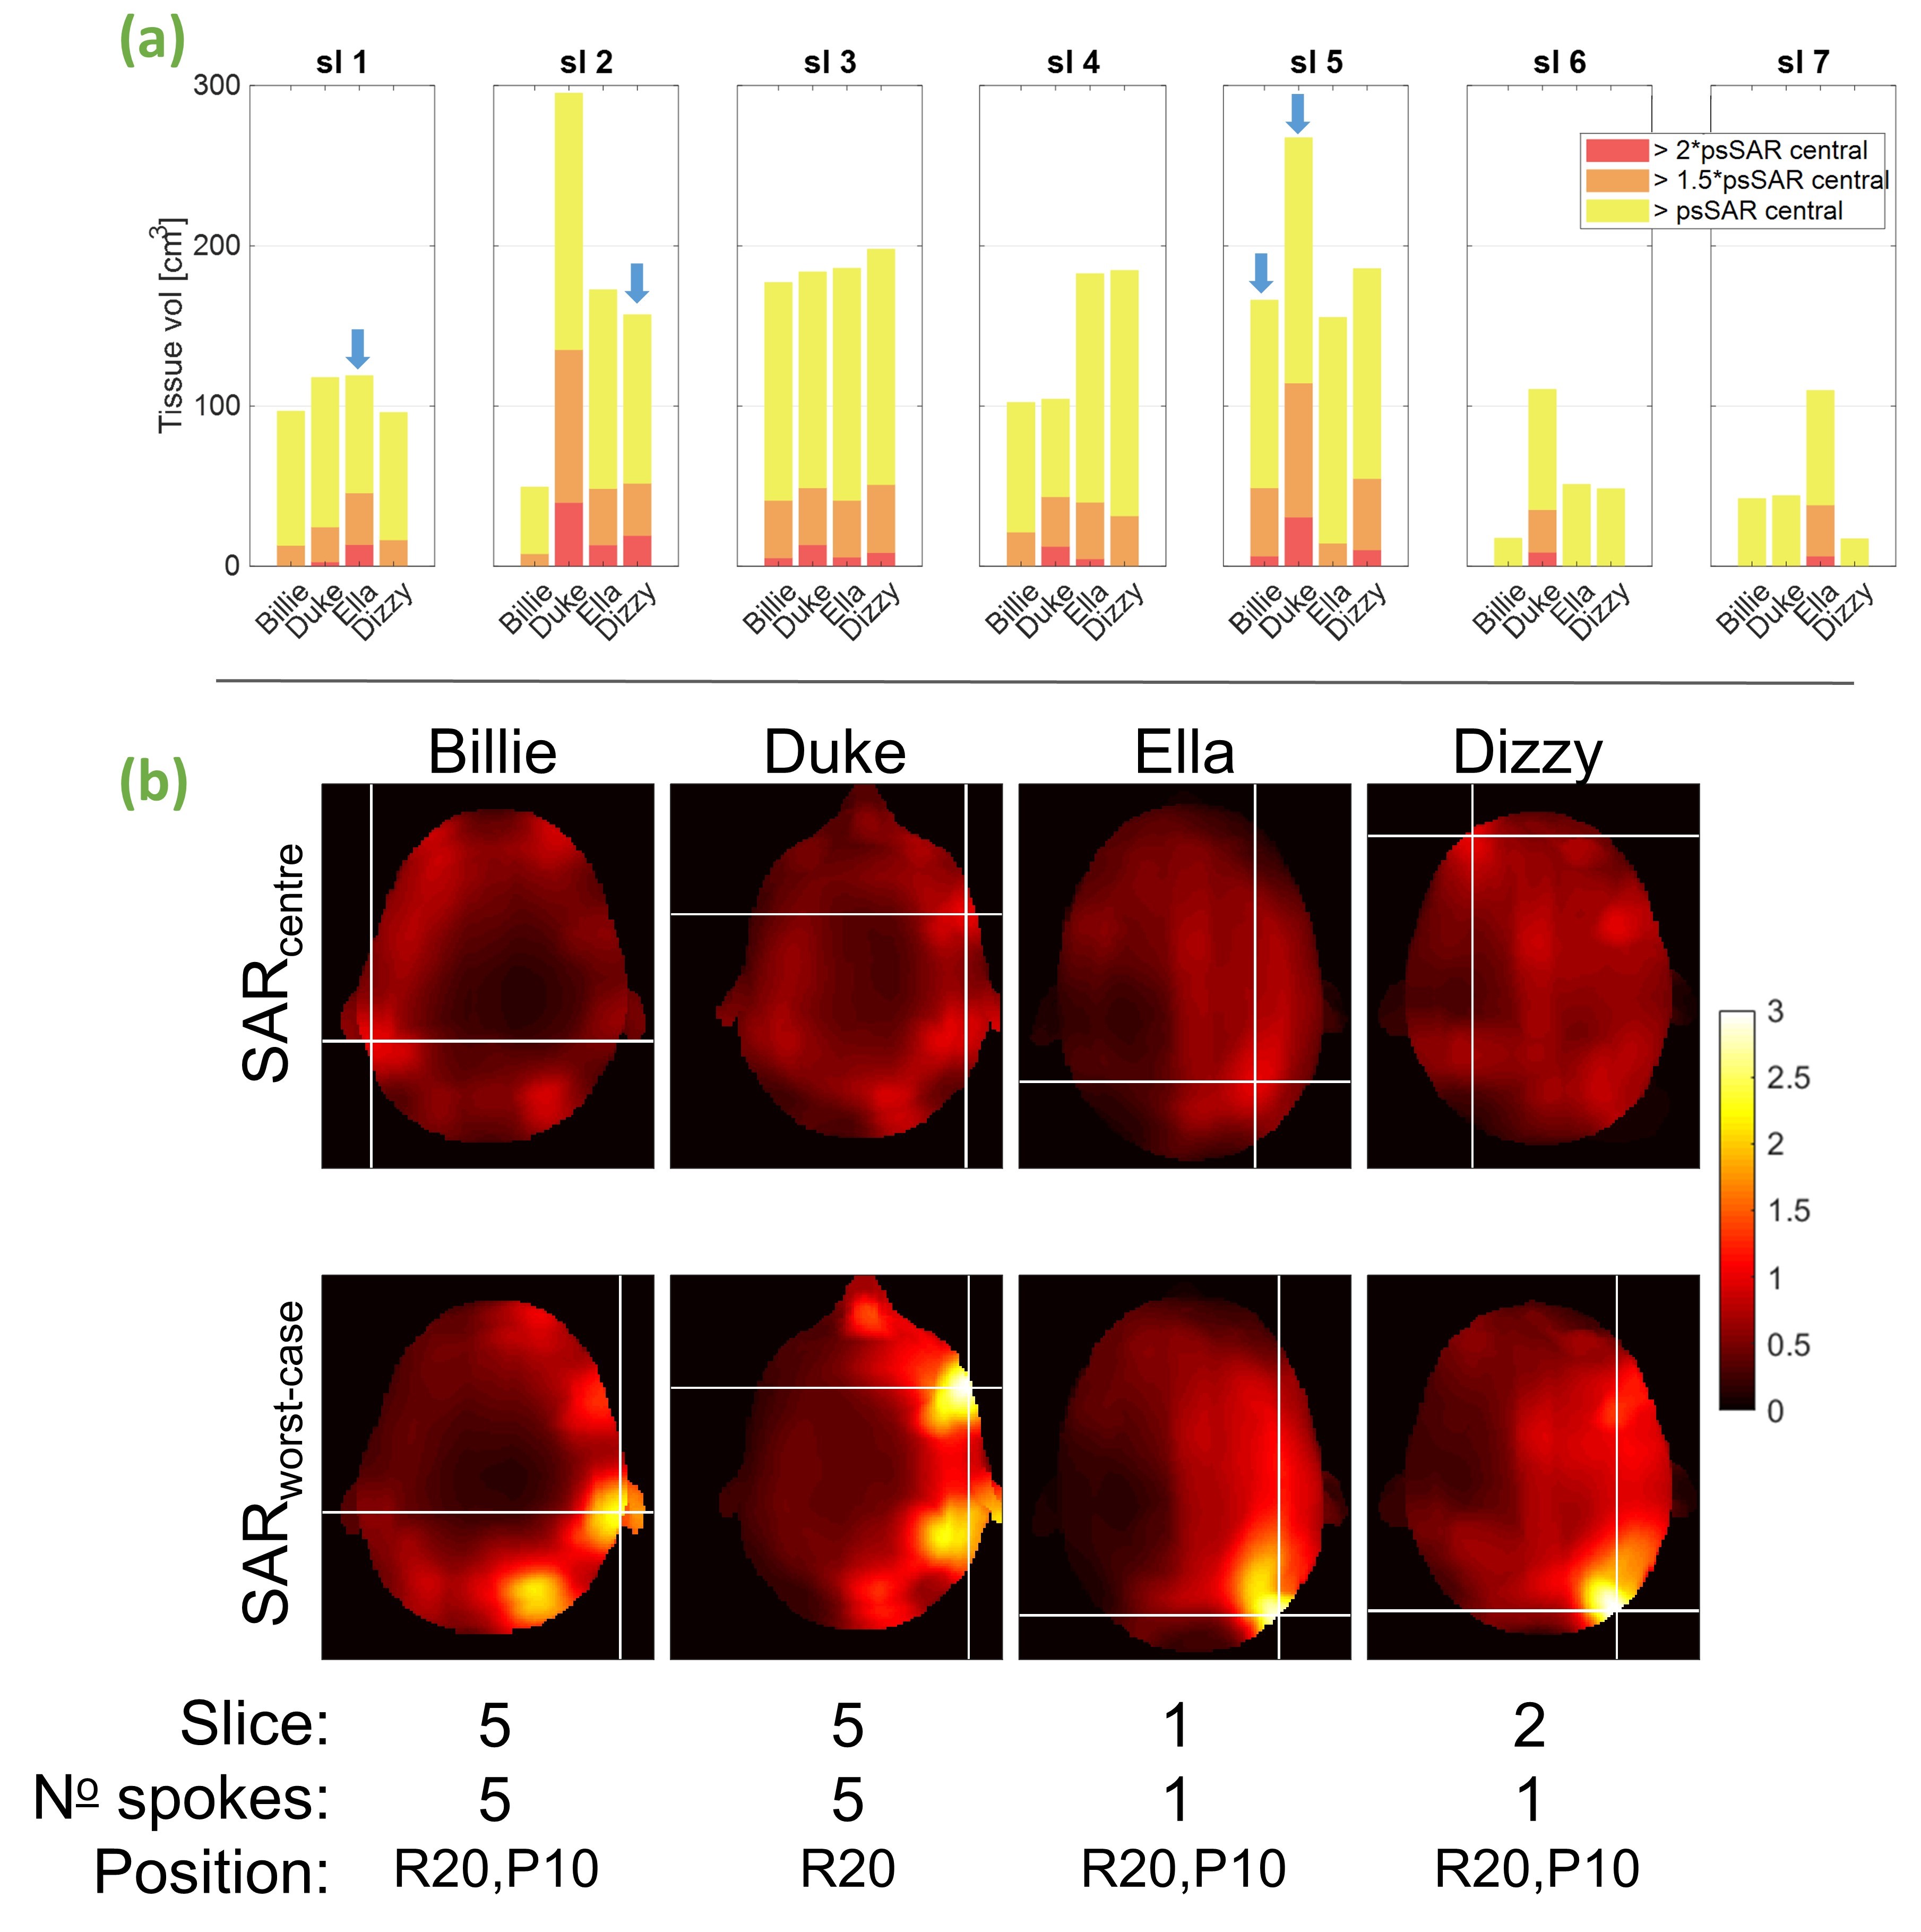
Fig 4a) Tissue volume exposed to higher SAR than psSARcentre by >100% (all colours), >150% (orange) and >200% (red) for worst-case pTx pulses separated by slice. Blue arrows show overall worst-cases per model (shown below) b) local-SAR profiles for each model’s worst-case. SARcentre shows SAR using the same pulse without motion; models’ worst-case profiles were normalised to psSAR from the respective motion-free profile. The crosses indicate hotspots (max. psSAR). Slice, number of spokes, and position at which worst-cases occurred shown below (R=rightward, P=posterior)
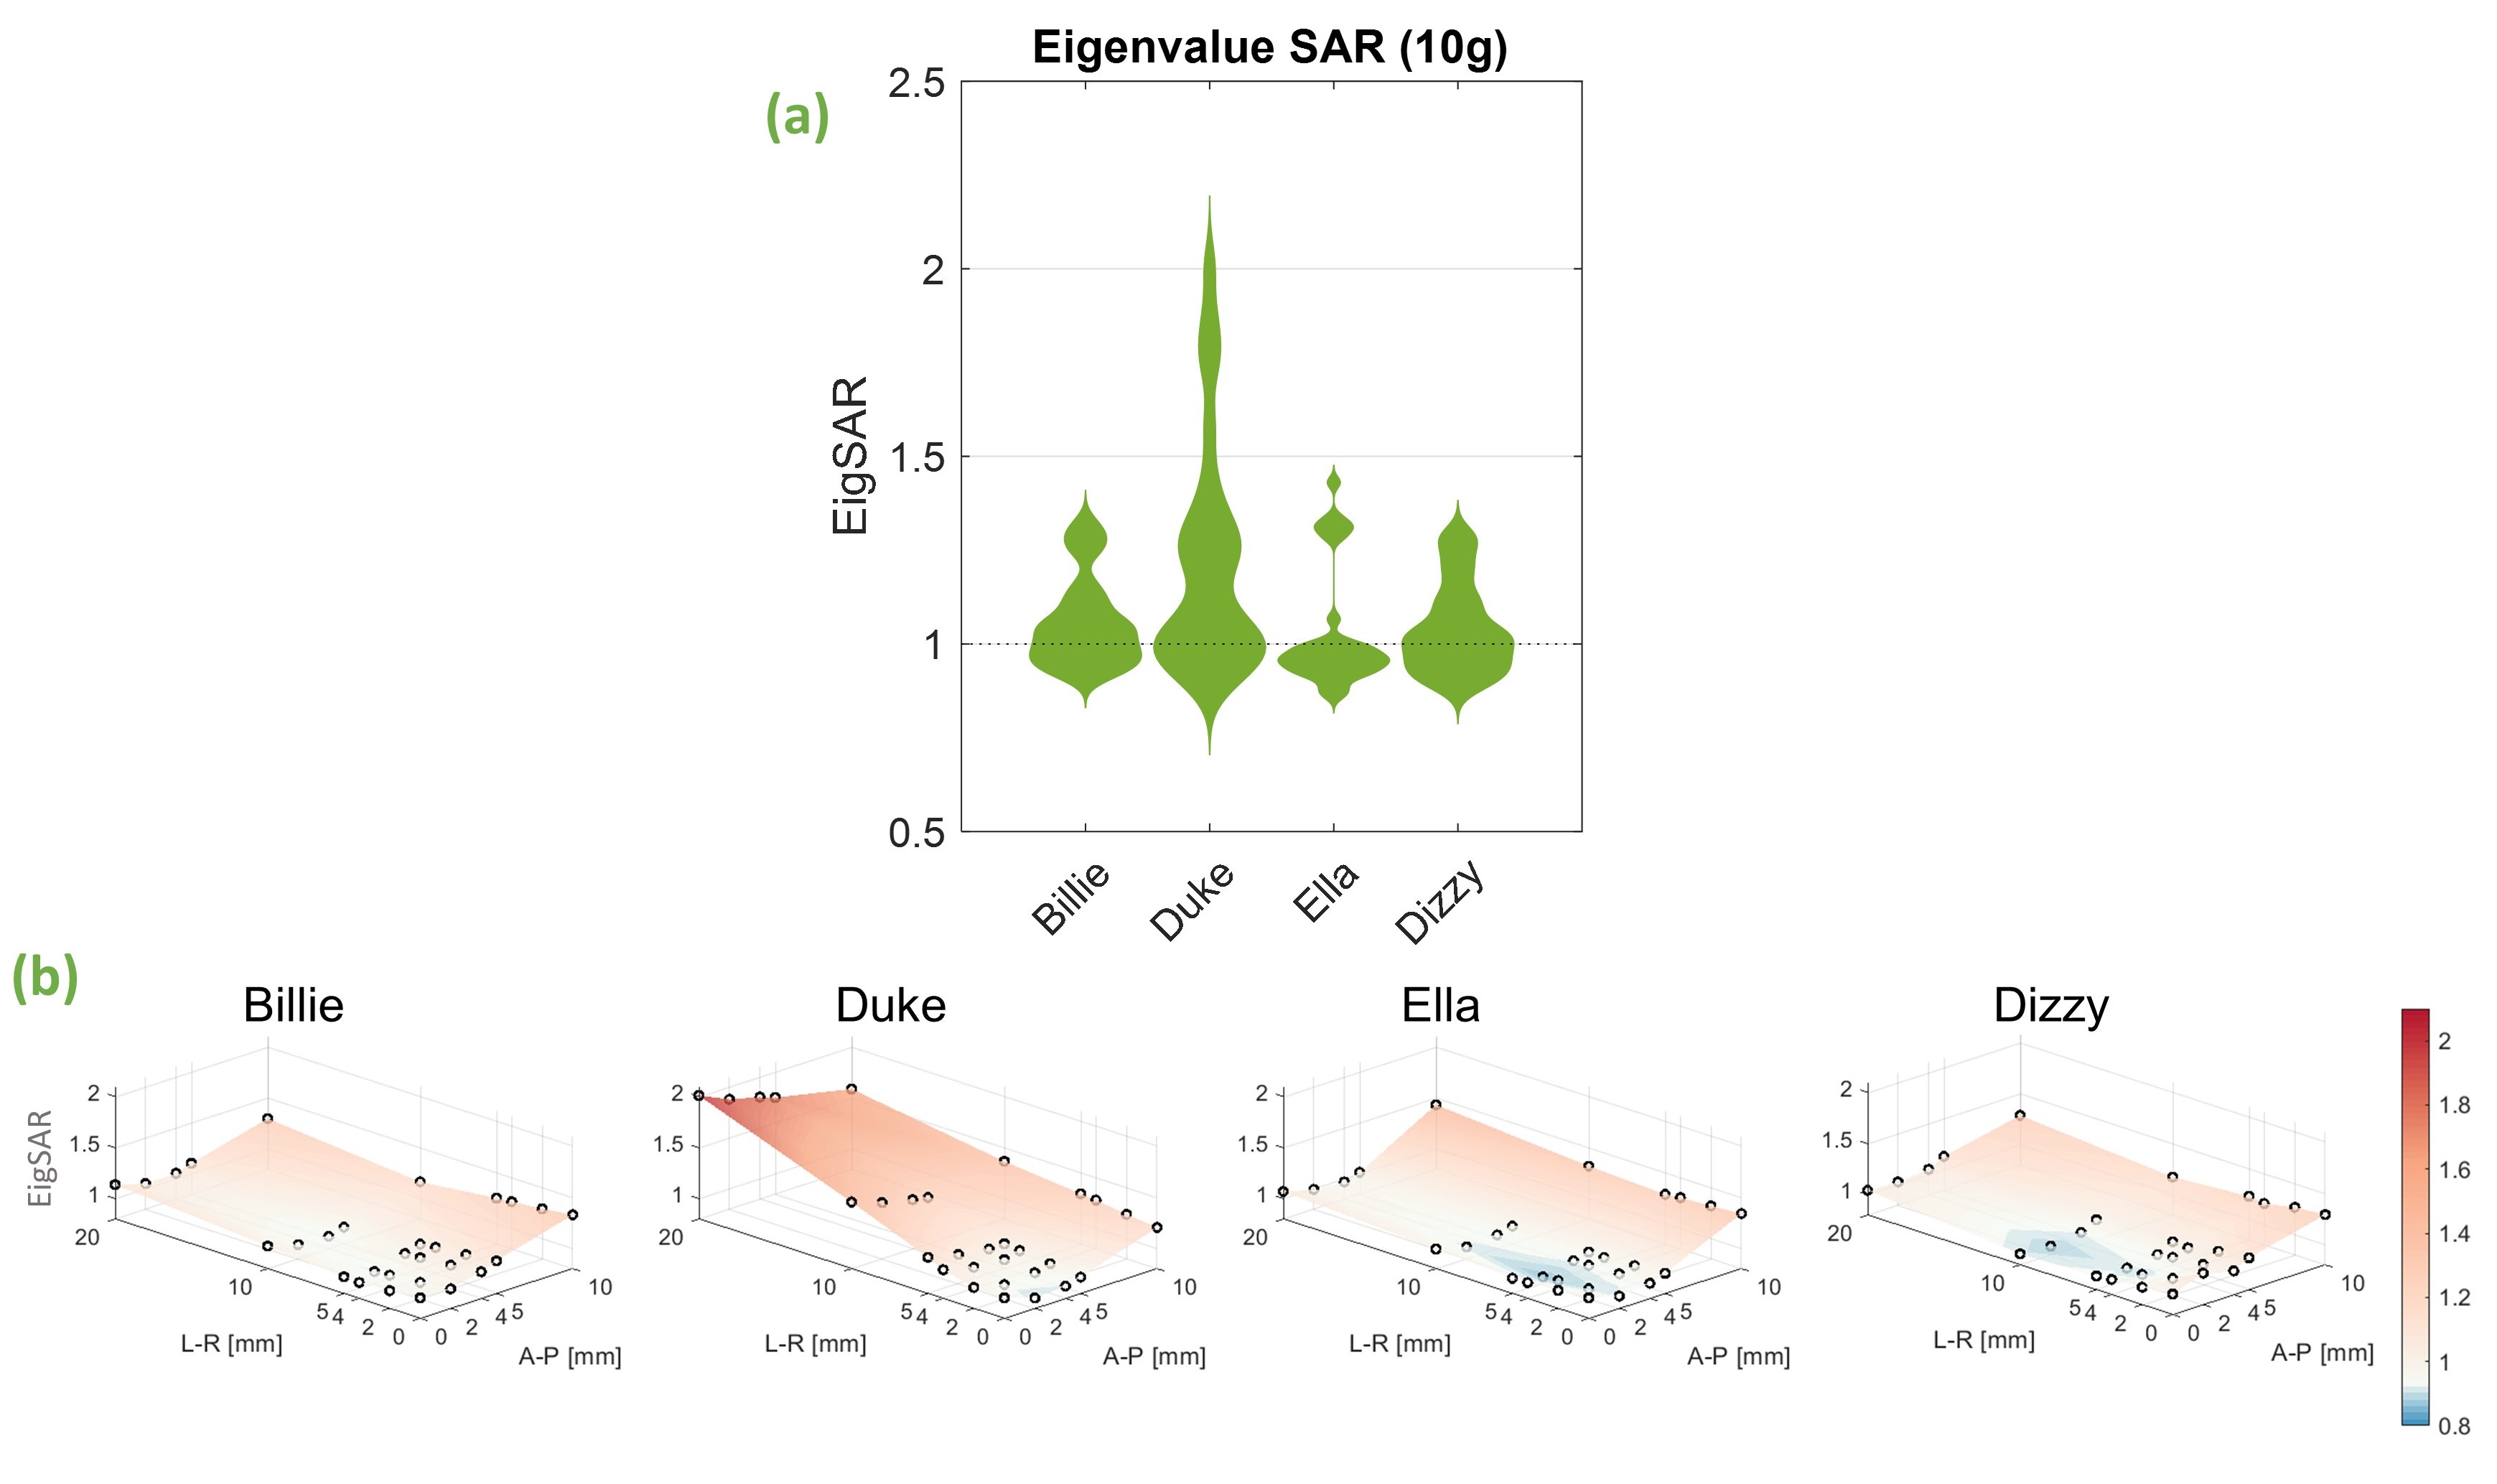
Fig 5 Eigenvalue-based SAR (EigSAR) sensitivity to motion for each body model. EigSAR was calculated as the maximum eigenvalue of the 10g-averaged Q-matrices and is therefore pulse-independent. a) each model’s EigSAR distribution across all 30 positions. b) EigSAR shown for individual positions. Values are shown as a factor of peak EigSAR at the centre position (i.e. without motion).