0456
Rapid B1+ Mapping using a Sandwiched Train Saturated TurboFLASH Sequence at 7T1Wellcome Centre for Integrative Neuroimaging, FMRIB, Nuffield Department of Clinical Neurosciences, University of Oxford, Oxford, United Kingdom, 2Oxford Centre for Clinical Magnetic Resonance Research, University of Oxford, Oxford, United Kingdom, 3Department of Imaging Methods, Institute of Measurement Science, Slovak Academy of Sciences, Bratislava, Slovakia, 4Siemens Healthineers, Frimley, United Kingdom
Synopsis
Ultra-high field MRI with parallel transmit offers significant advantages but B1 transmit maps must be acquired to utilize its full potential. We designed and evaluated three new adaptations to a pre-saturation TurboFLASH B1+ mapping method. The proposed methods enabled significantly shorter TRs (on the order of 1 s), were insensitive to T1, and had comparable accuracy to the original method whilst maintaining the other desirable characteristics of the sequence. The method was shown to work in 3D allowing for volumetric B1+ maps to be acquired in 18 seconds.
Introduction
Imaging at ultra-high fields improves signal-to-noise but users must mitigate increased transmit B1 (B1+) field inhomogeneity. In recent years, the use of parallel transmit (pTx) has become widespread at 7T as a superposition of transmit fields allows for spatial and temporal B1+ shimming1. However, this requires knowledge of the field’s non-uniformity. Current methods of B1+ mapping suffer from trade-offs between T1 sensitivity, accuracy, SAR and duration. Methods like DREAM2 are fast and have reduced T1 sensitivity but suffer from flow artefacts and a limited dynamic range. On the other hand, B1+ mapping with pre-saturation RF pulses3 is robust to motion and flow. However, this requires long TRs and is sensitive to T1 due to relaxation throughout the readout train. Here we propose and evaluate a new adaption of the pre-saturation TurboFLASH (satTFL) B1+ mapping sequence3 enabling a shorter TR and a reduces T1 sensitivity, whilst maintaining the desirable characteristics of the method.Methods
Three different adaptations to satTFL were tested, as shown in Figure 1b-d. Conventionally, satTFL (Figure 1a) uses the ratio of two images: one as a reference (S0), and one magnetisation-prepared (S1) with a non-selective saturation pulse of flip angle $$$\alpha$$$. The TR between these images is set to 5T1 to permit full longitudinal relaxation and prevent contamination from prior acquisitions. The effect of shortening this TR is shown in Figure 1b. This work proposes acquiring S0 and S1 images in quick succession so that both will have similar magnetization history (Figure 1c), eliminating the need for a period of 5T1. We also explore the benefit of an additional image train (S2) following S1 to help correct for T1 (Figure 1d). These methods were explored using Extended Phase Graph simulations and scans both in phantom and in vivo. Five volunteers were scanned using an 8Tx/32Rx head coil at 7T (Siemens). Images are acquired using a TurboFLASH readout TE/TR = 1.78/4.2ms with flip angle $$$\beta$$$, slice thickness = 8mm, scan matrix = 50×36, bandwidth = 490Hz/px. We acquire a segmented satTFL (TR = 10s) B1+ map acting as a reference with minimal T1 dependence. Additionally, we apply our adaptation as a 3D sequence with a reduced scan matrix of 24×24×16. Since $$$\beta$$$ is subjected to the same field distribution as $$$\alpha$$$ we assume them to be linearly proportional. B1+ is found for the schemes in Figure 1a-c using,$$\alpha=\cos^{-1}(S_1/S_0). $$ Scheme D is calculated with an additional weighting from S2 as,
$$\alpha=\cos^{-1}\left(\frac{S_1+0.5(S_1-S_2)}{S_0}\right).$$We propose a lookup table, generated from simulation, to correct for any bias in which is independent from T1.
Results
We identified from simulation that an $$$\alpha:\beta$$$ ratio of 10:1 yields the best compromise between bias in $$$\alpha$$$ and sensitivity to noise. Scheme C is not substantially affected by using a reduced TR of 1s, offering significant gains in speed. However, α requires substantial bias correction above 130° for both schemes C and D as seen in the Bland-Altman plots of Figure 2c-d. B1+ maps acquired in the brain at multiple reference voltages are shown in Figure 3. These show good agreement with the simulated sequences over a range of α and are plotted with different simulated T1 values. The mean coefficient of variation due to T1’s in the range 0.5-3s is reduced by 71% for scheme C compared to satTFL. 3D B1+ maps in the brain are shown in Figure 5, acquired within 18s for schemes C and D, and 32s for short TR satTFL along with a corresponding 2D map.Discussion
SatTFL B1+ mapping is inaccurate for reduced TRs (Figure 1b) due to T1 recovery and shows unwanted structural contrast, especially around the CSF. Simulations show that by sandwiching the reference and prepared images either side of the preparation pulse the effects of T1 can be mitigated while also allowing for a reduced TR. Introducing S2 achieves better T1-correction but increases the sensitivity to noise. All maps show qualitatively similar results and large B1+ inhomogeneity with the expected brightening around the region of the lateral ventricles due to imaging in CP mode. As expected for our schemes, due to the reduced TR, a reduced SNR is evident in Figure 4. However, our method continues to reproduce satTFL measurements while having small RMSE compared to a long (70s) reference map. The largest error in the B1+ maps for our schemes is due to chemical shift from the short T1 fat signal around the brain. Schemes C and D allow for fast switching of the transmit configuration for multi-transmit array mapping. Additionally, this lends itself to cardiac gating therefore potentially enabling measurements of B1+ in the blood pool of the heart. Further work will combine these adaptations with methods such as TxLR4 allowing acceleration of multi-channel mapping by up to a factor of eight. This may allow full volumetric multi-channel mapping of the pTx array in a single breath-hold.Conclusion
A pulse sequence for rapid B1+ mapping was proposed and evaluated. The proposed scheme removes the requirement for any delay between images while maintaining accuracy and enabling rapid B1+ mapping. A 3D B1+ map in the brain is acquired in 18s and is well suited to cardiac breath hold B1+ mapping.Acknowledgements
JK is supported by an iCASE stipend award in collaboration with Siemens Healthineers. LV is supported by a Sir Henry Dale Fellowship of the Wellcome Trust and the Royal Society [#221805/Z/20/Z] and would also like to acknowledge the support of the Slovak Grant Agencies VEGA [2/0003/20] and APVV [#19–0032]. The Wellcome Centre for Integrative Neuroimaging is supported by core funding from the Wellcome Trust (203139/Z/16/Z).References
- Padormo F, Beqiri A, Hajnal JV, Malik SJ. Parallel transmission for ultrahigh-field imaging. NMR Biomed. 2016;29:1145–1161.
- Nehrke K and Börnert P. DREAM - A Novel Approach for Robust, Ultrafast, Multislice B1 Mapping. Magn Reson Med. 2010; 68:1517-1526.
- Chung S, Kim D, Breton E, Axel L. Rapid B1+ Mapping Using a Pre-Conditioning RF Pulse with TurboFLASH readout. Magn Reson Med. 2010; 64(2):439-446.
- Hess AT, Dragonu I, Chiew M. Accelerated calibrationless parallel transmit mapping using joint transmit and receive low‐rank tensor completion. Magn Reson Med. 2021; 86:2454–2467.
Figures
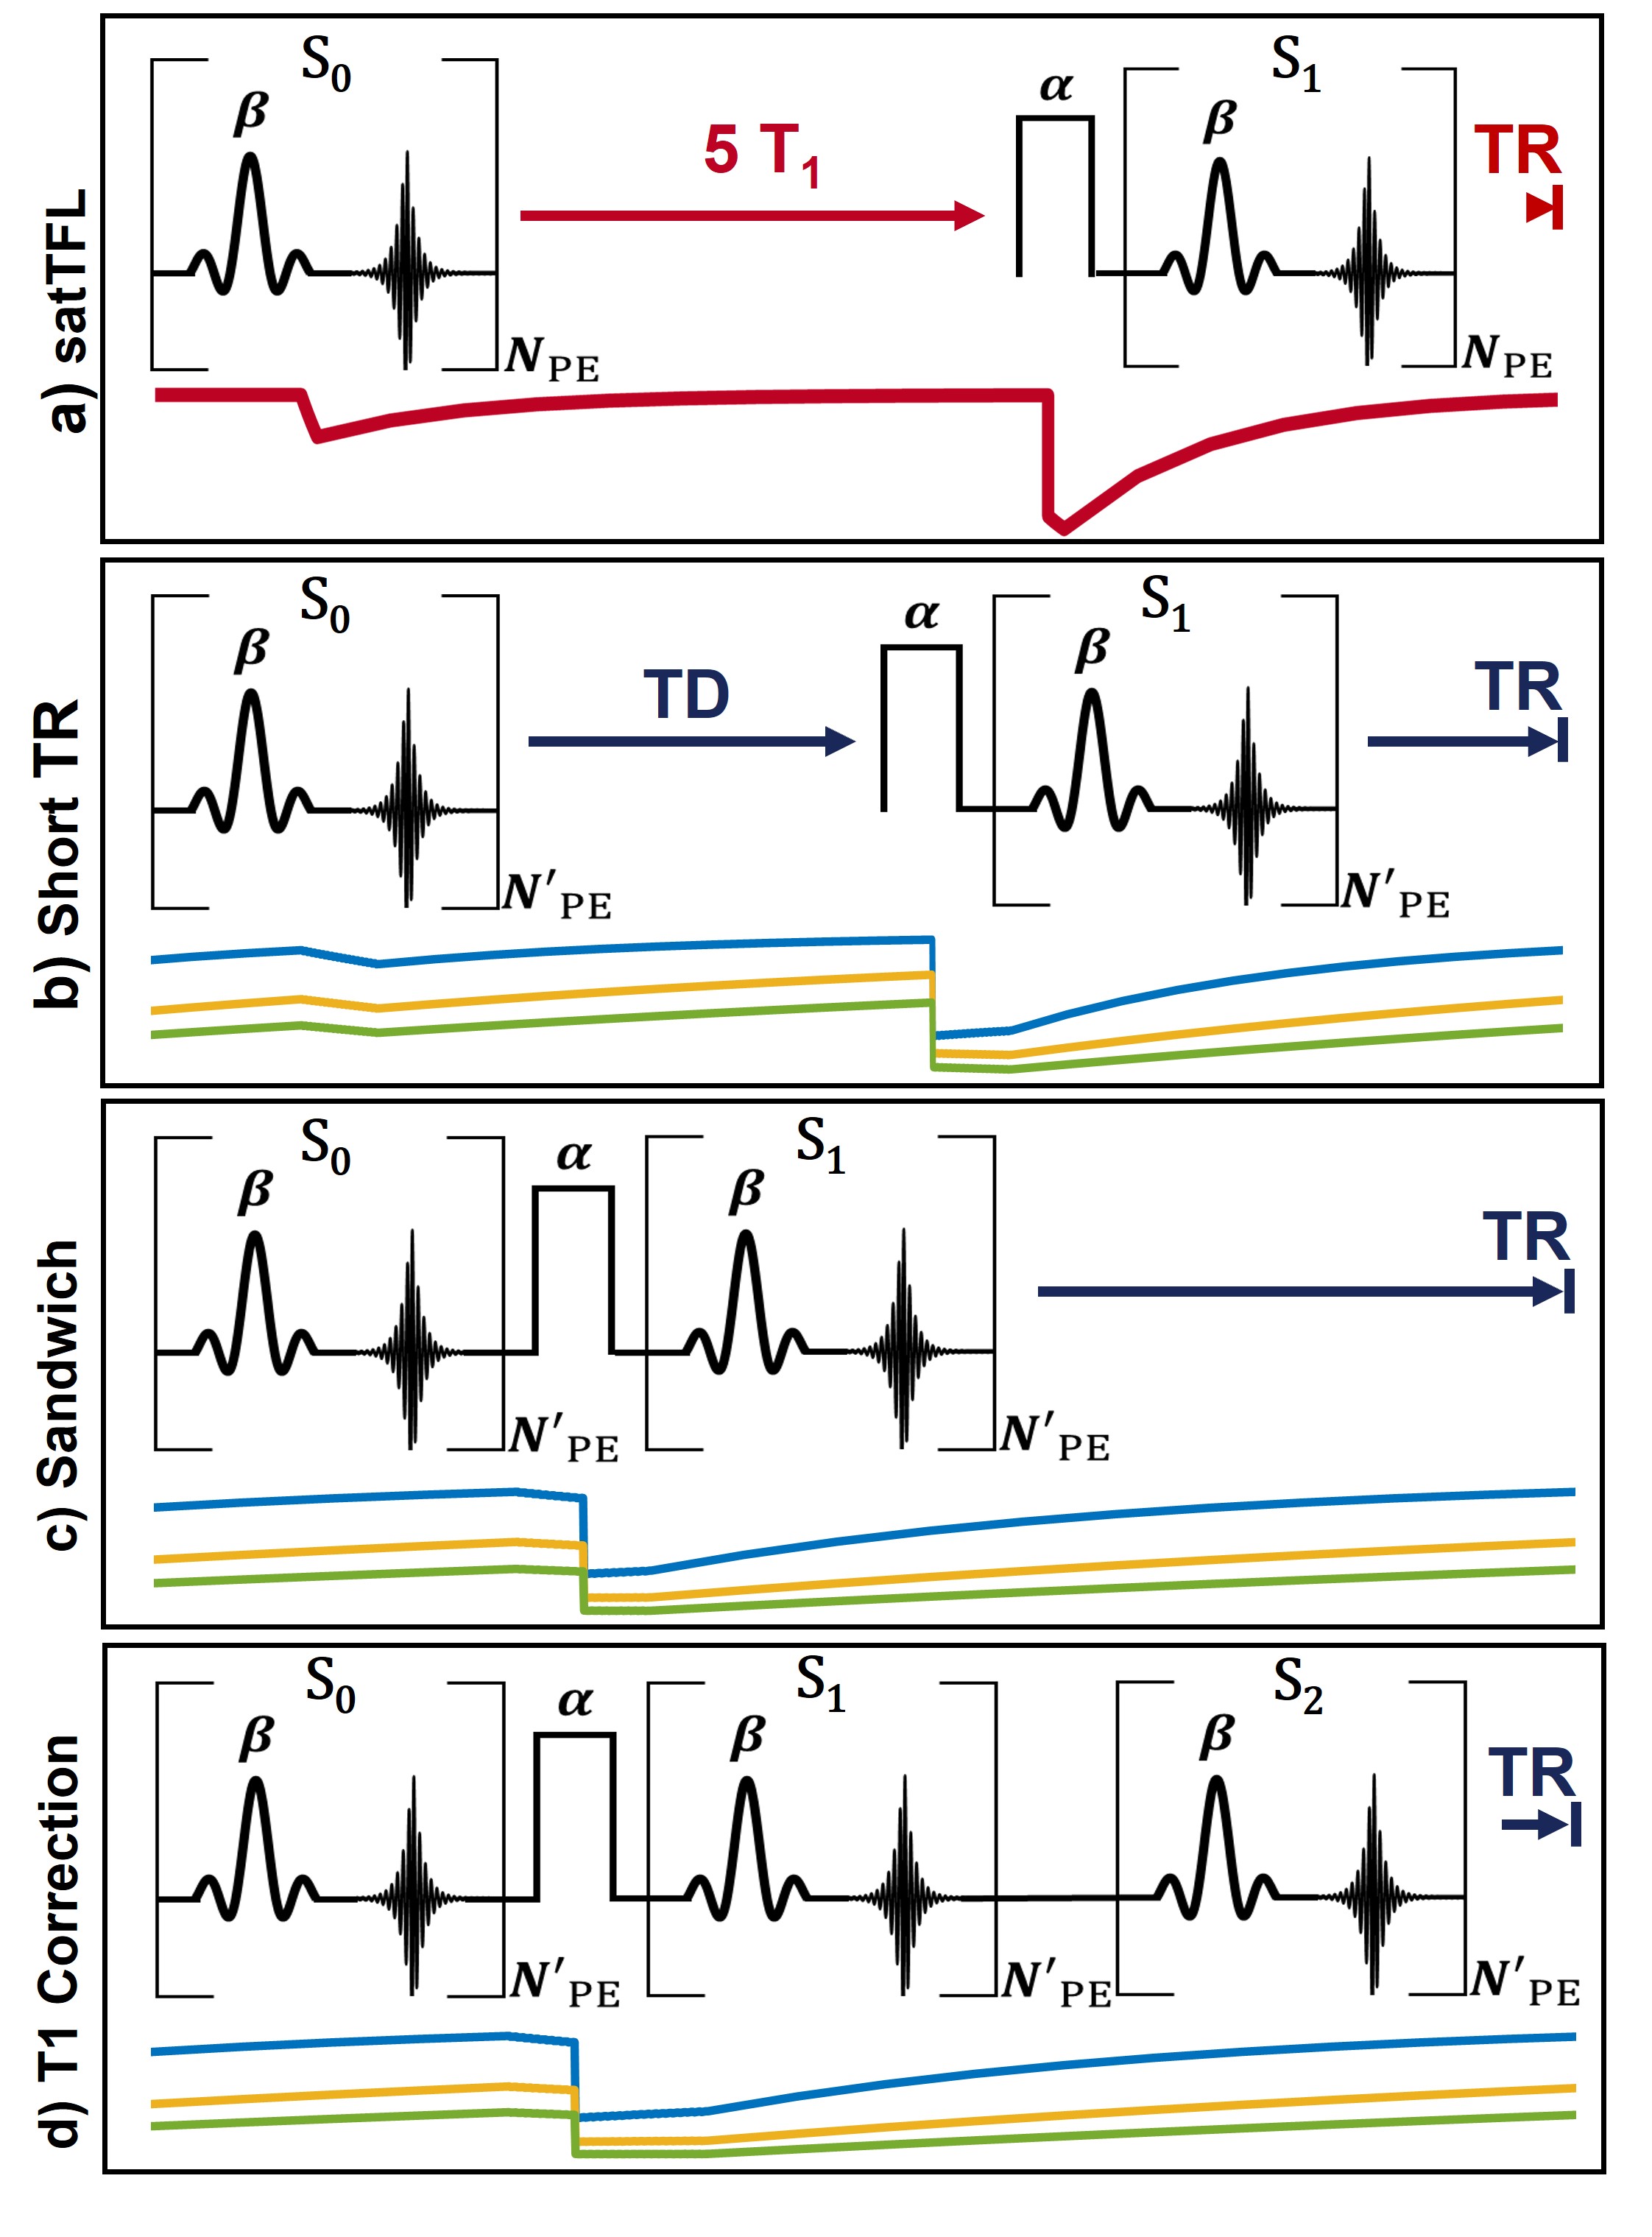
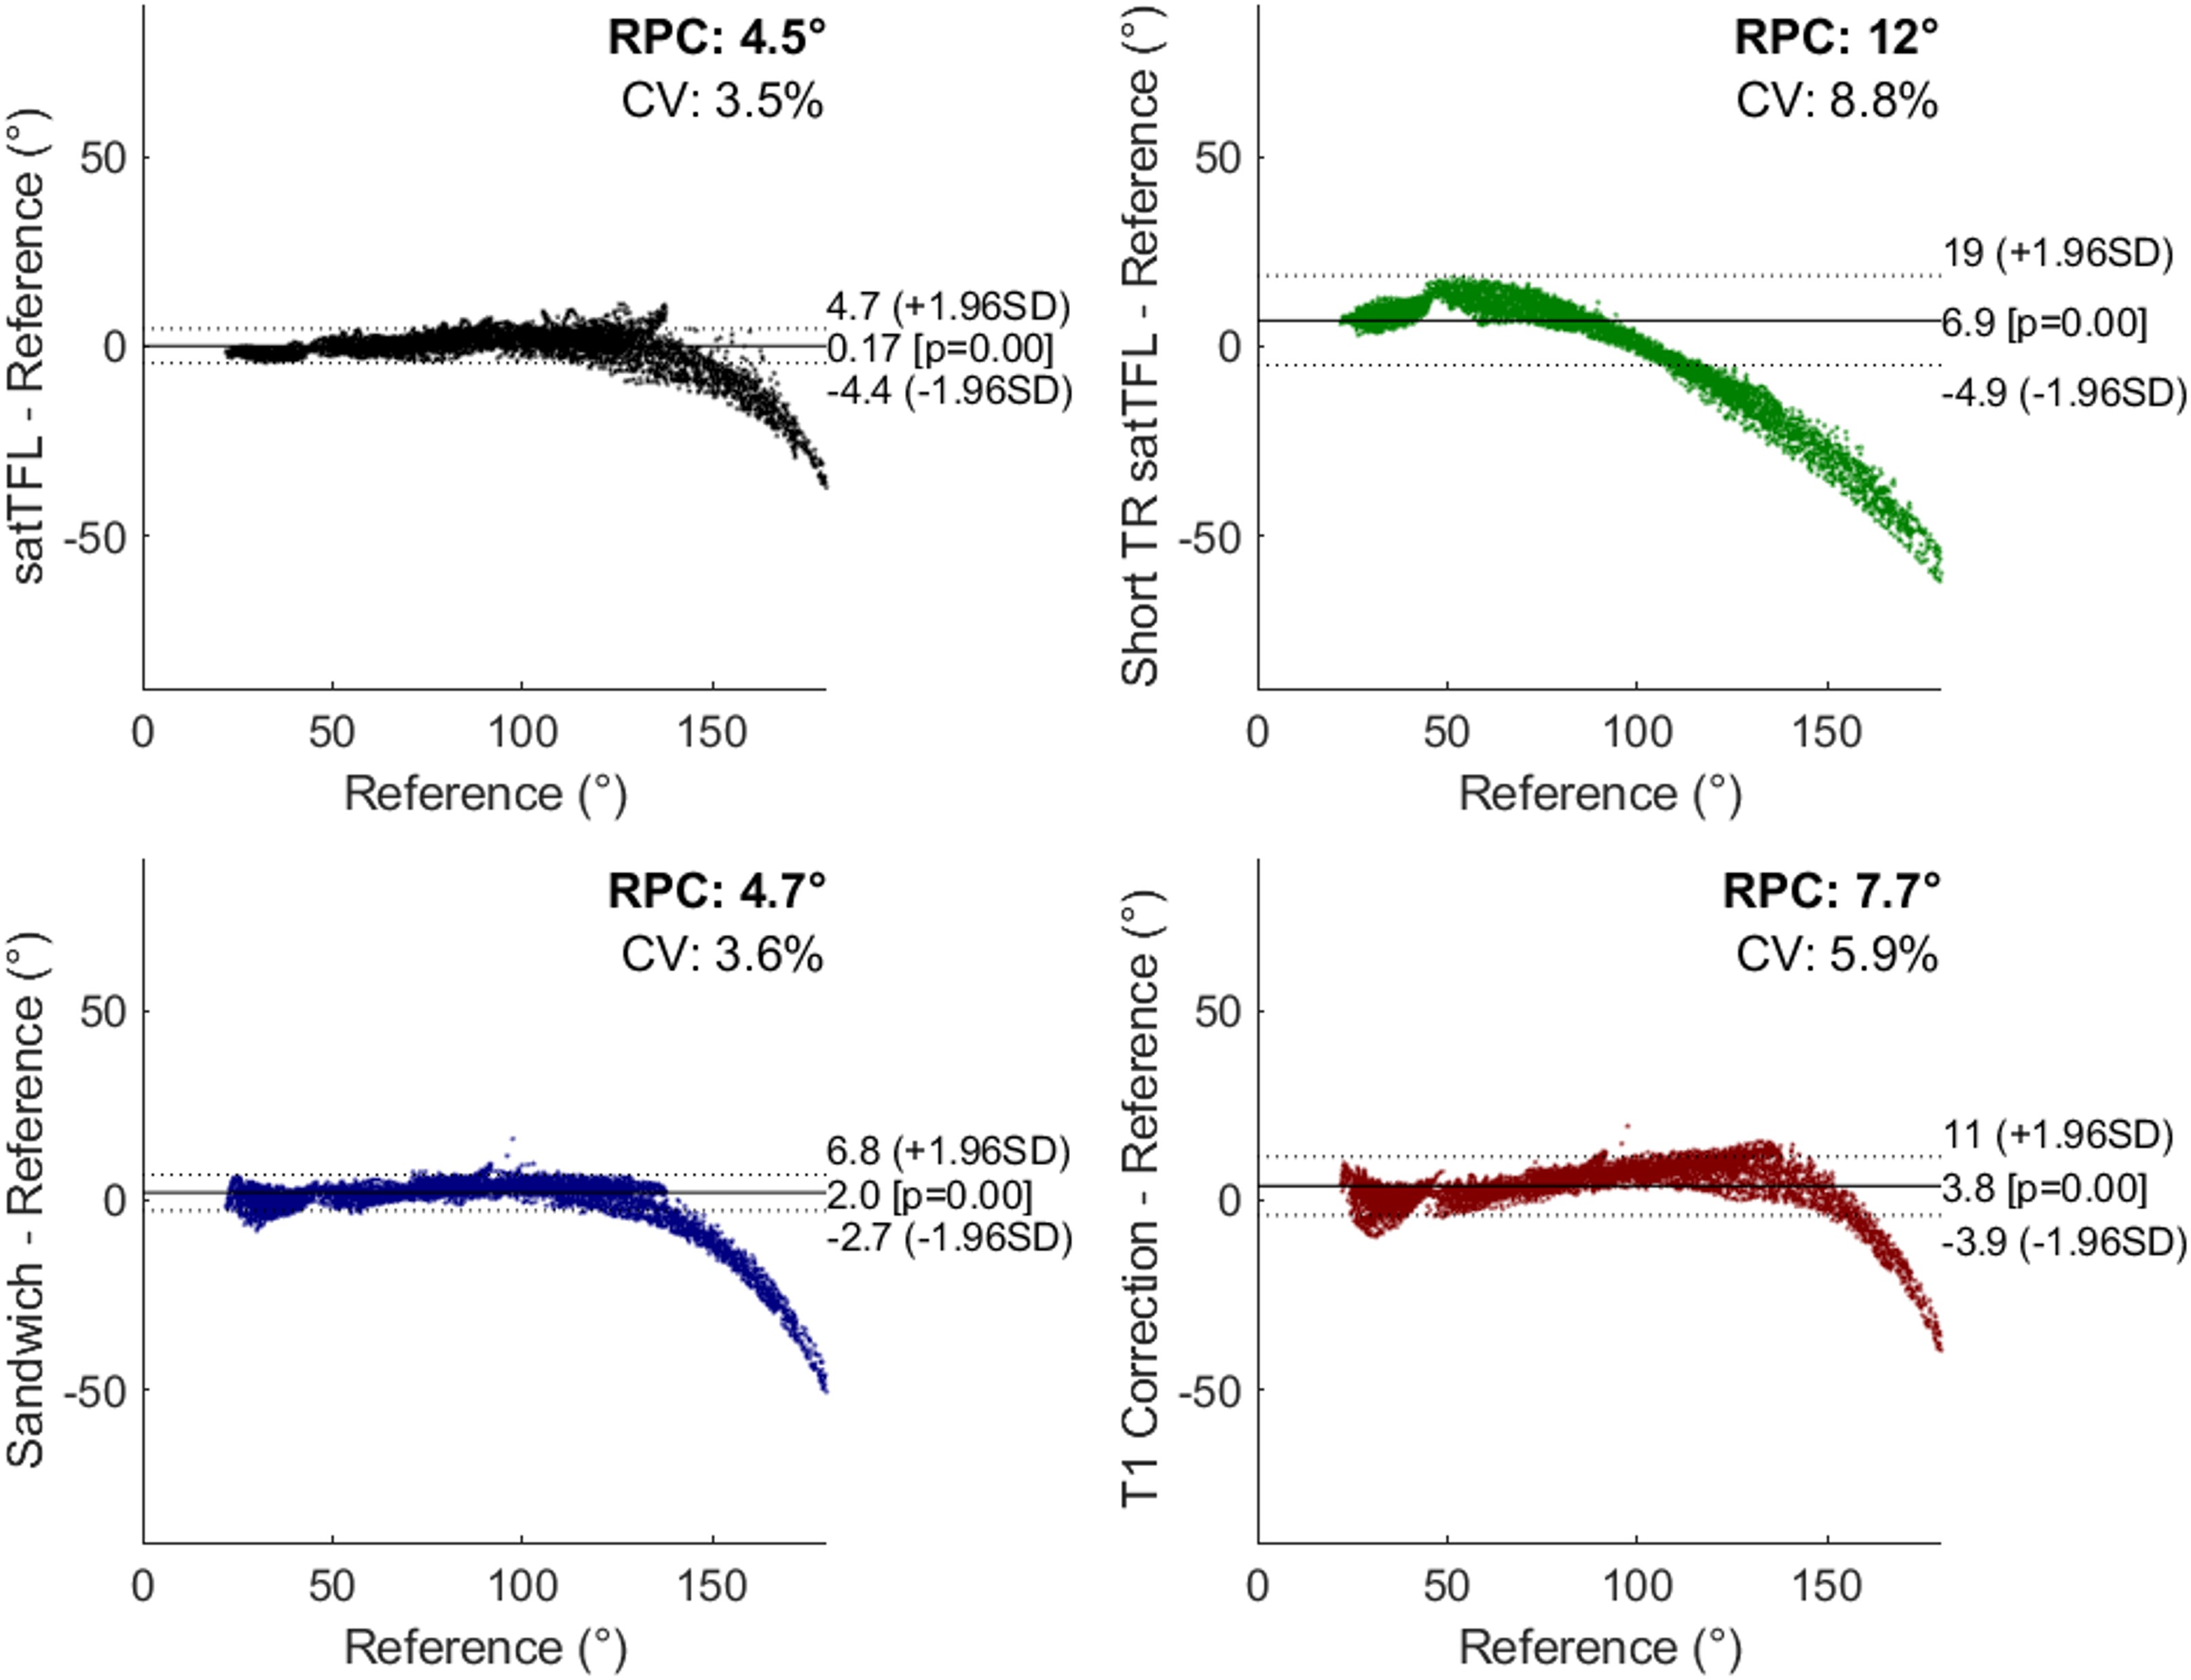
Figure 2: Bland-Altman plot of each scheme compared to a reference T1 insensitive method. The data in each plot are aggregated from 5 volunteers for 4 B1+ maps at reference voltages (30 V, 60 V, 90 V and 120 V) for greater dynamic range. The 120 V datasets are removed from the Bland-Altman analysis due to oversaturation beyond the linear region.
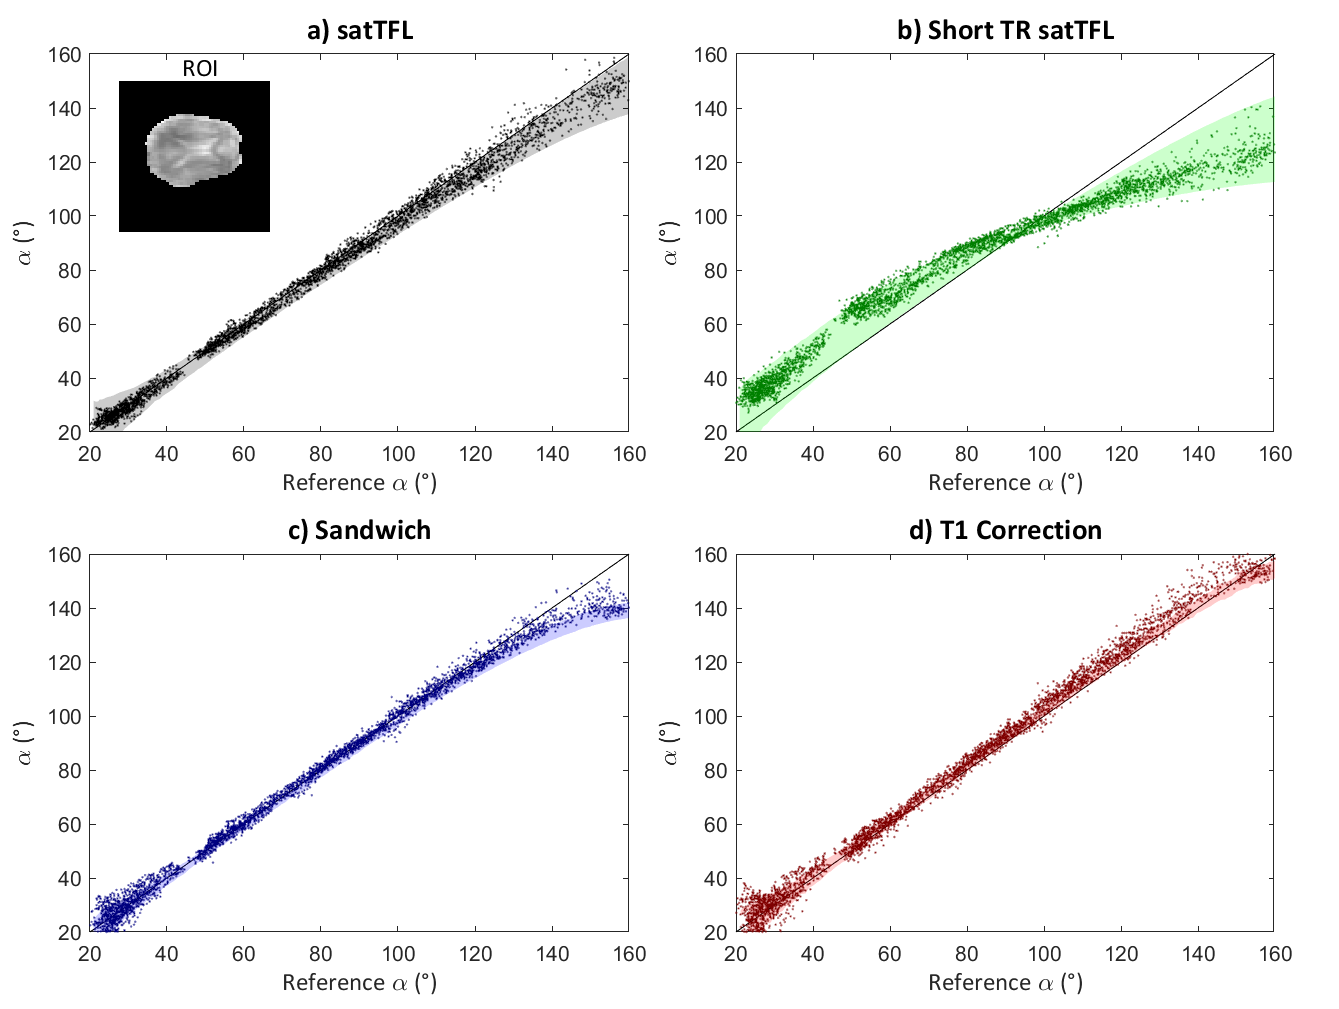
Figure 3: Voxel-wise comparison of α for each scheme against the reference method. The data in each plot are aggregated from 4 B1+ maps at varying reference voltages (30 V, 60 V, 90 V and 120 V) for greater dynamic range. Each point representing the flip angle measured in a single voxel from the ROI (shown in top left). The shaded region in each plot shows the range of α expected from EPG sequence simulations using T1 values 0.5-3 s.
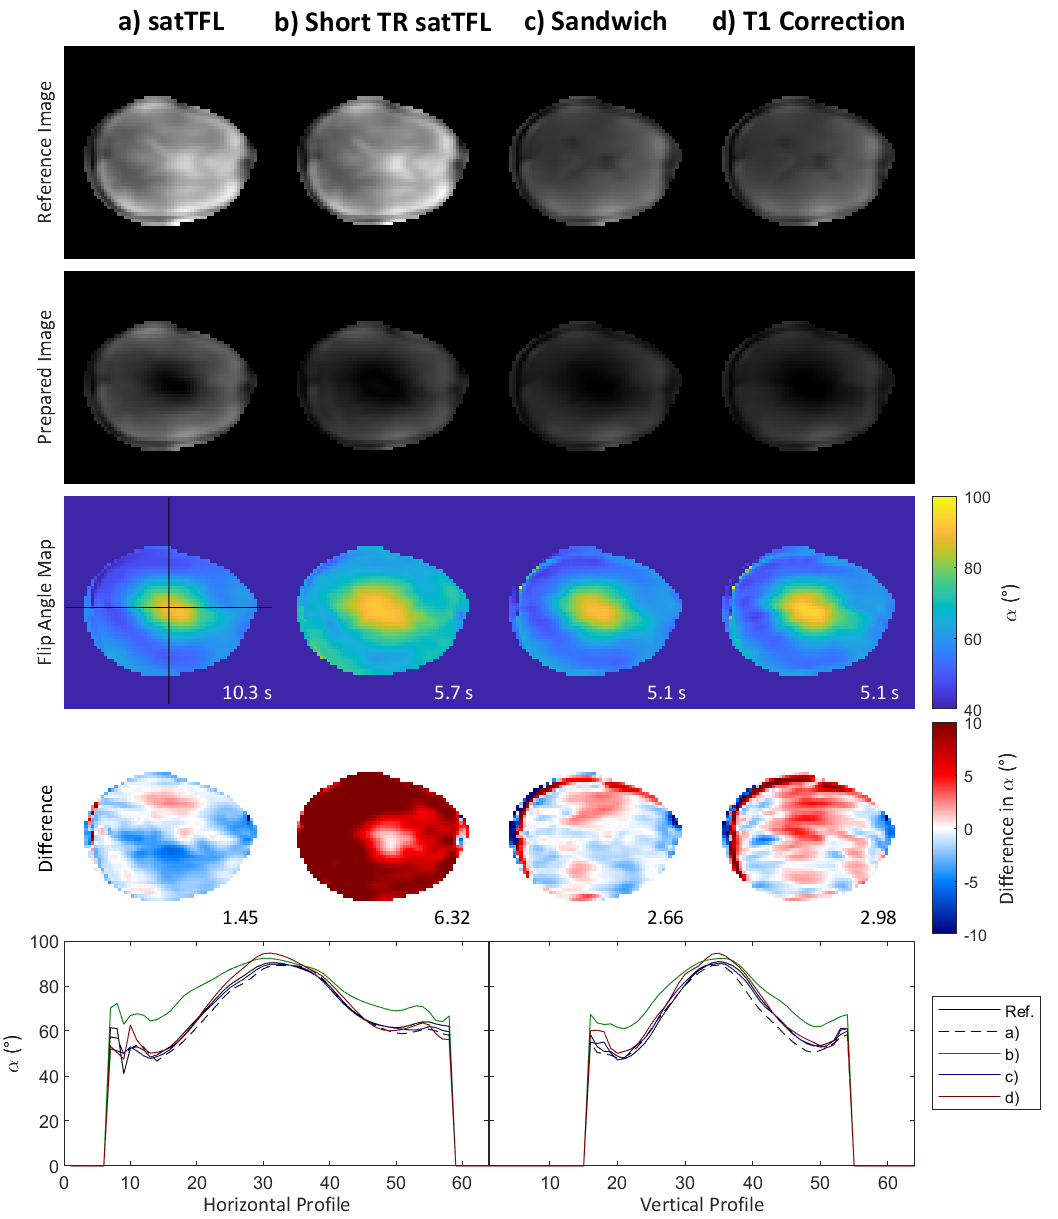
Figure 4: B1+ maps in the brain acquired for each scheme. First two rows show the magnitude of the images used to calculate the corresponding maps in the third row. The acquisition time is shown in the bottom right. The difference between each map and a mean reference (calculated from two reference voltages for the reference method and scaled by the voltage) are shown in the fourth row, along with the RMSE. Horizontal and vertical profiles through the centre of the brain are also shown.
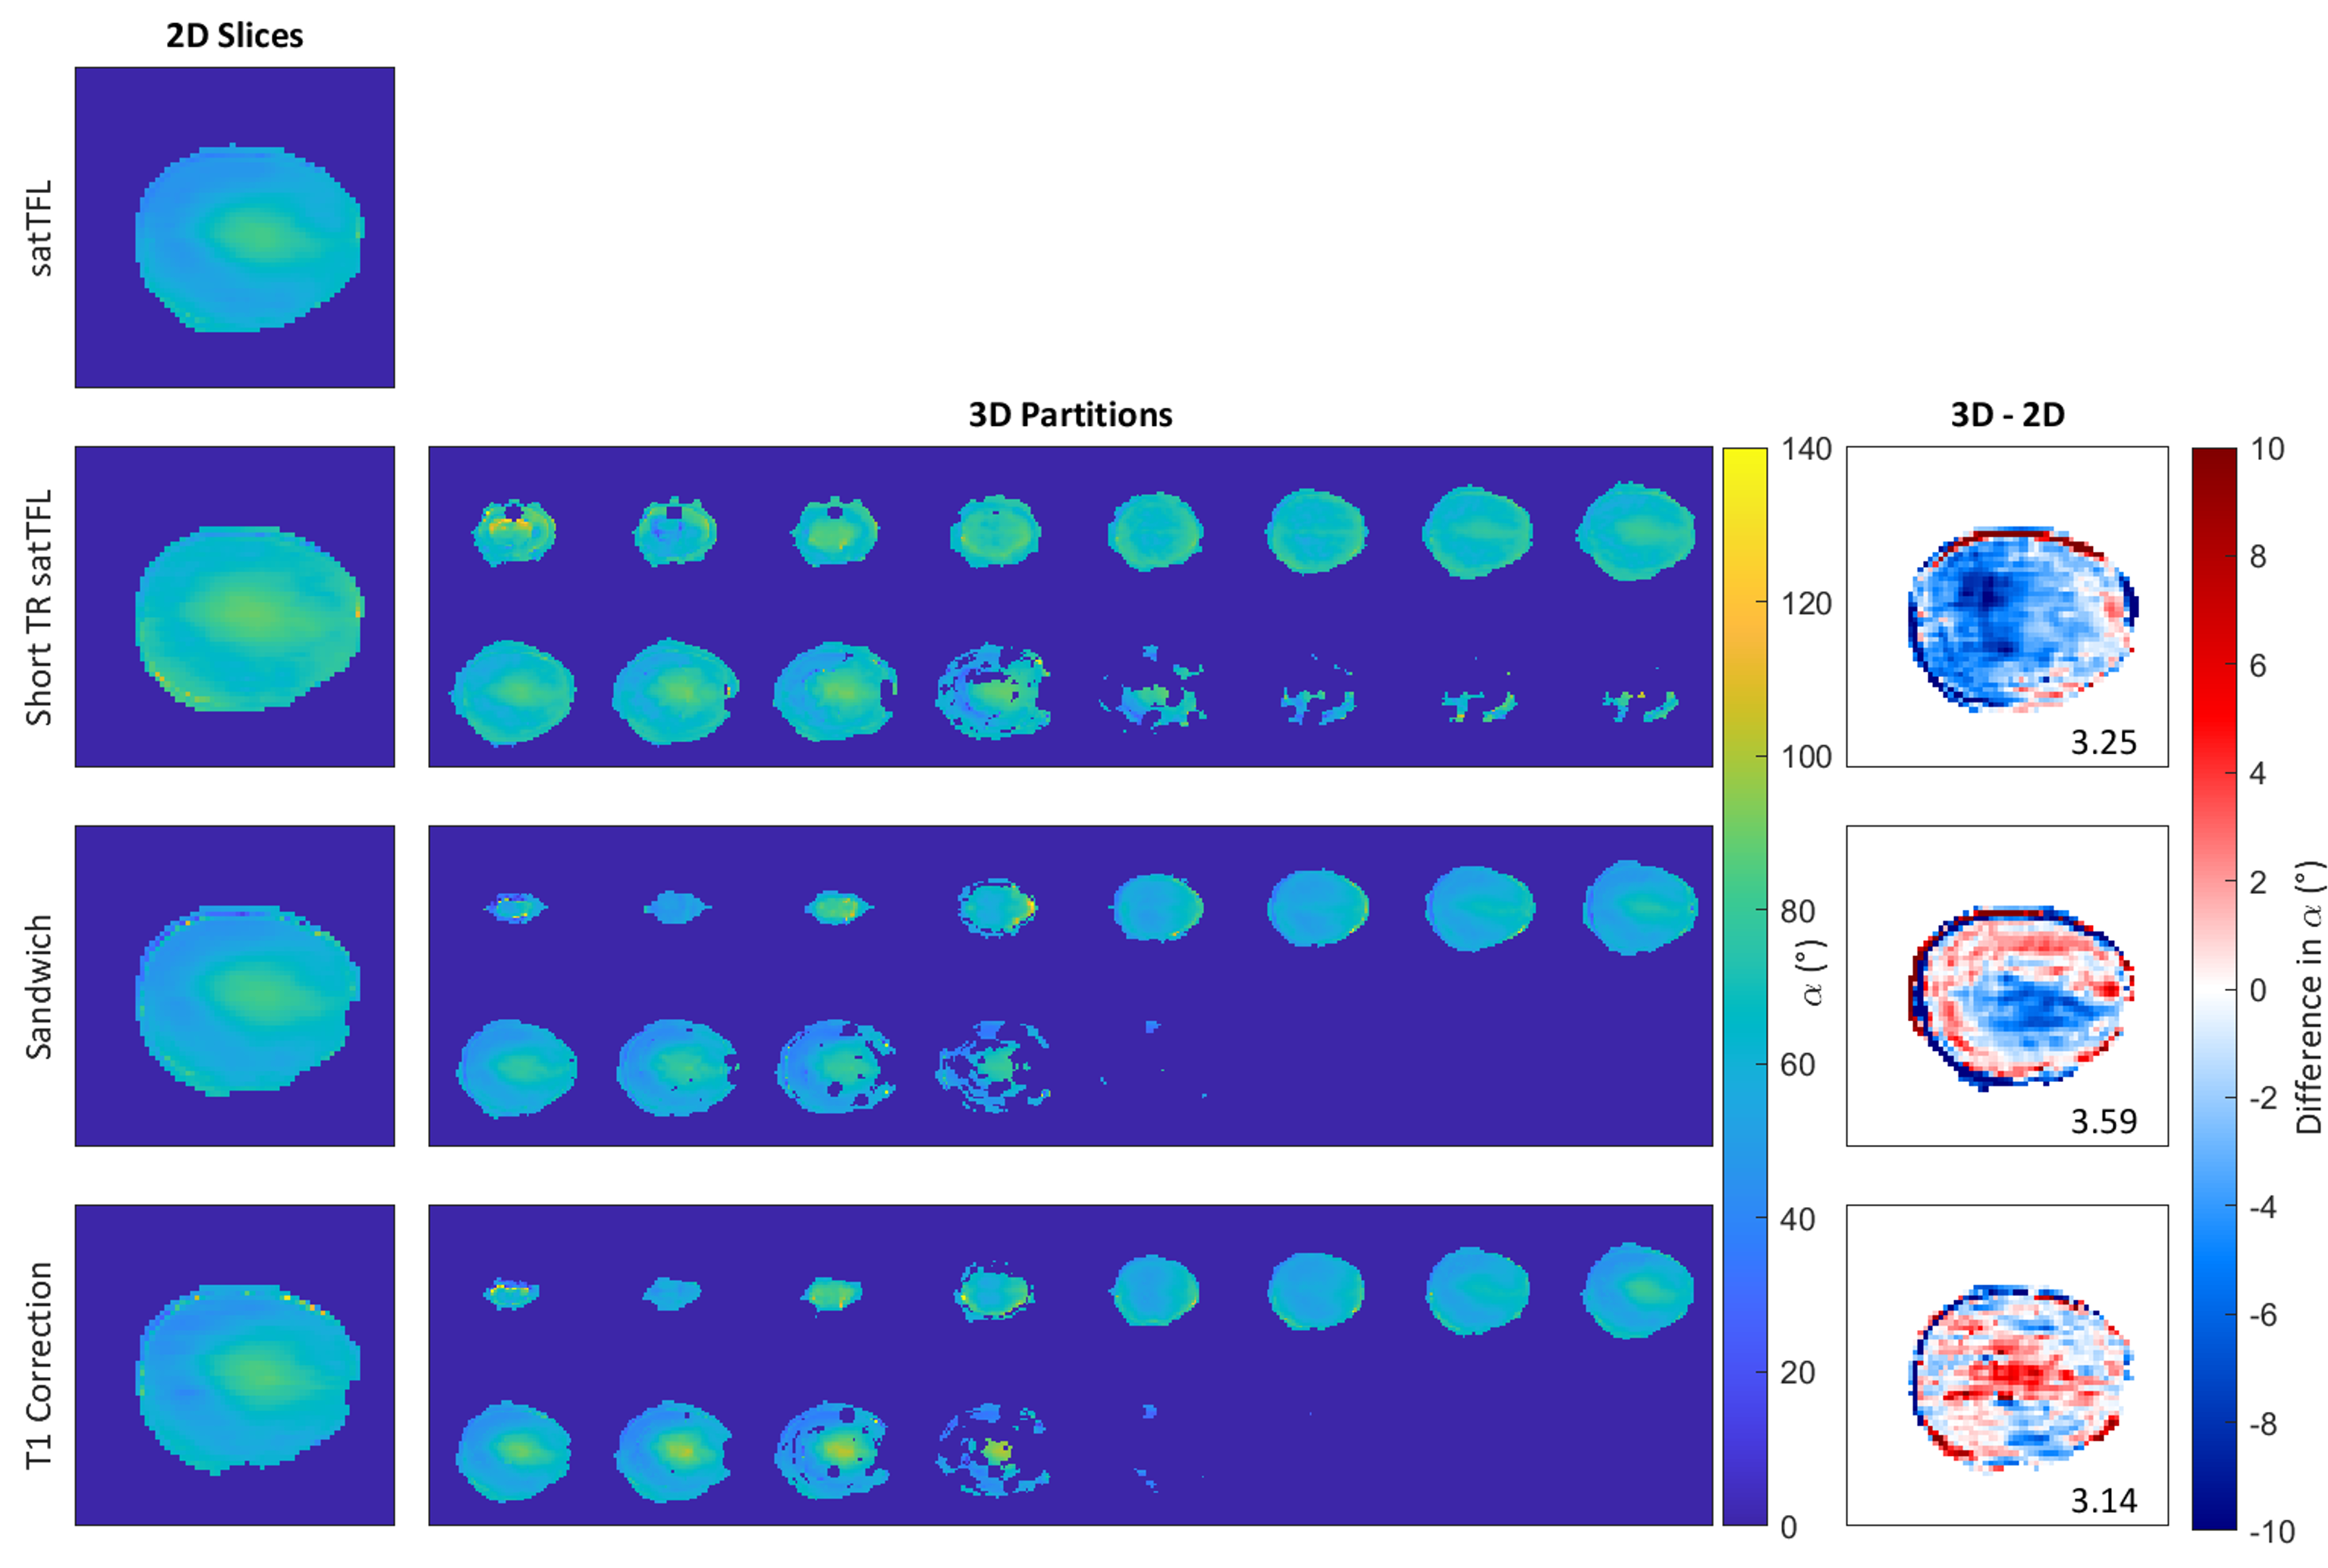
Figure 5: 2D B1+ maps acquired using each of the four schemes (left). B1+ maps for 16 partitions (8 mm) of the brain acquired in CP mode using a 3D version of our adaptions (centre images). B1+ maps for the sandwich and T1 correction schemes have been bias corrected from simulation. The difference between a central 3D partition and the corresponding 2D slice is shown on the right. 3D data acquired in 17.3 s (including 2 dummy TRs) for our schemes and 32 s for short TR satTFL.