0452
Fat suppression using dynamic parallel transmission at 7T: application to whole-brain CEST MRI1Institute of Radiology, University Hospital Erlangen, Friedrich-Alexander-Universität Erlangen-Nürnberg (FAU), Erlangen, Germany, 2Department of Neuroradiology, University Hospital Erlangen, Friedrich-Alexander-Universität Erlangen-Nürnberg (FAU), Erlangen, Germany, 3MR Application Predevelopment, Siemens Healthcare, Erlangen, Germany, 4Division of Medical Physics in Radiology, German Cancer Research Center (DKFZ), Heidelberg, Germany
Synopsis
Fat signal can cause strong artifacts in MR images and/or bias measurements such as in Chemical Exchange Saturation Transfer (CEST) where metabolites peaks are reduced. At 7T, the signal-to-noise ratio and the peak separation are increased but the Specific Absorption Rate (SAR) constraints too, limiting the use of fat suppression pulses. Parallel transmit dynamic pulses for fat saturation (using kT-points) and water-selection (using a Spiral Non-Selective trajectory) were implemented for a whole-brain CEST protocol and optimized to reduce SAR compared to the standard circularly-polarized approach. Results showed high improvements in flip angle homogeneity and fat suppression efficiency, with reduced SAR.
Introduction
Chemical Exchange Saturation Transfer (CEST) can provide whole-brain metabolic maps, with potentially-high clinical value, especially since the clinical approval of 7T systems. Indeed, at ultra-high field, it benefits from an increased signal-to-noise ratio and a wider spectral peak separation, which facilitate the measurement of metabolites generally indistinguishable at standard field strengths.However, CEST at 7T comes with higher Specific Absorption Rate (SAR) constraints, limiting the use of fat suppression pulses. Due to the chemical shift with water, lipids can cause artifacts in MR images and/or bias the measurement of metabolites (e.g., Nuclear Overhauser Enhancement, NOE)1. The fat signal is generally detrimental to CEST measurements as it reduces the z-spectrum amplitude2.
Parallel transmission (pTx) of channel-specific pulse shapes increases the degrees of freedom (DOFs) to manipulate the spatial transmit-field (B1+) distribution3. Dynamic pulses (temporally varying pulse shapes with simultaneously applied B0 gradients) additionally increase these DOFs to improve the flip angle (FA) homogeneity while reducing SAR.
This study aimed to evaluate the potential of dynamic pTx pulse design for fat suppression in whole-brain CEST MRI at 7T.
Materials & Methods
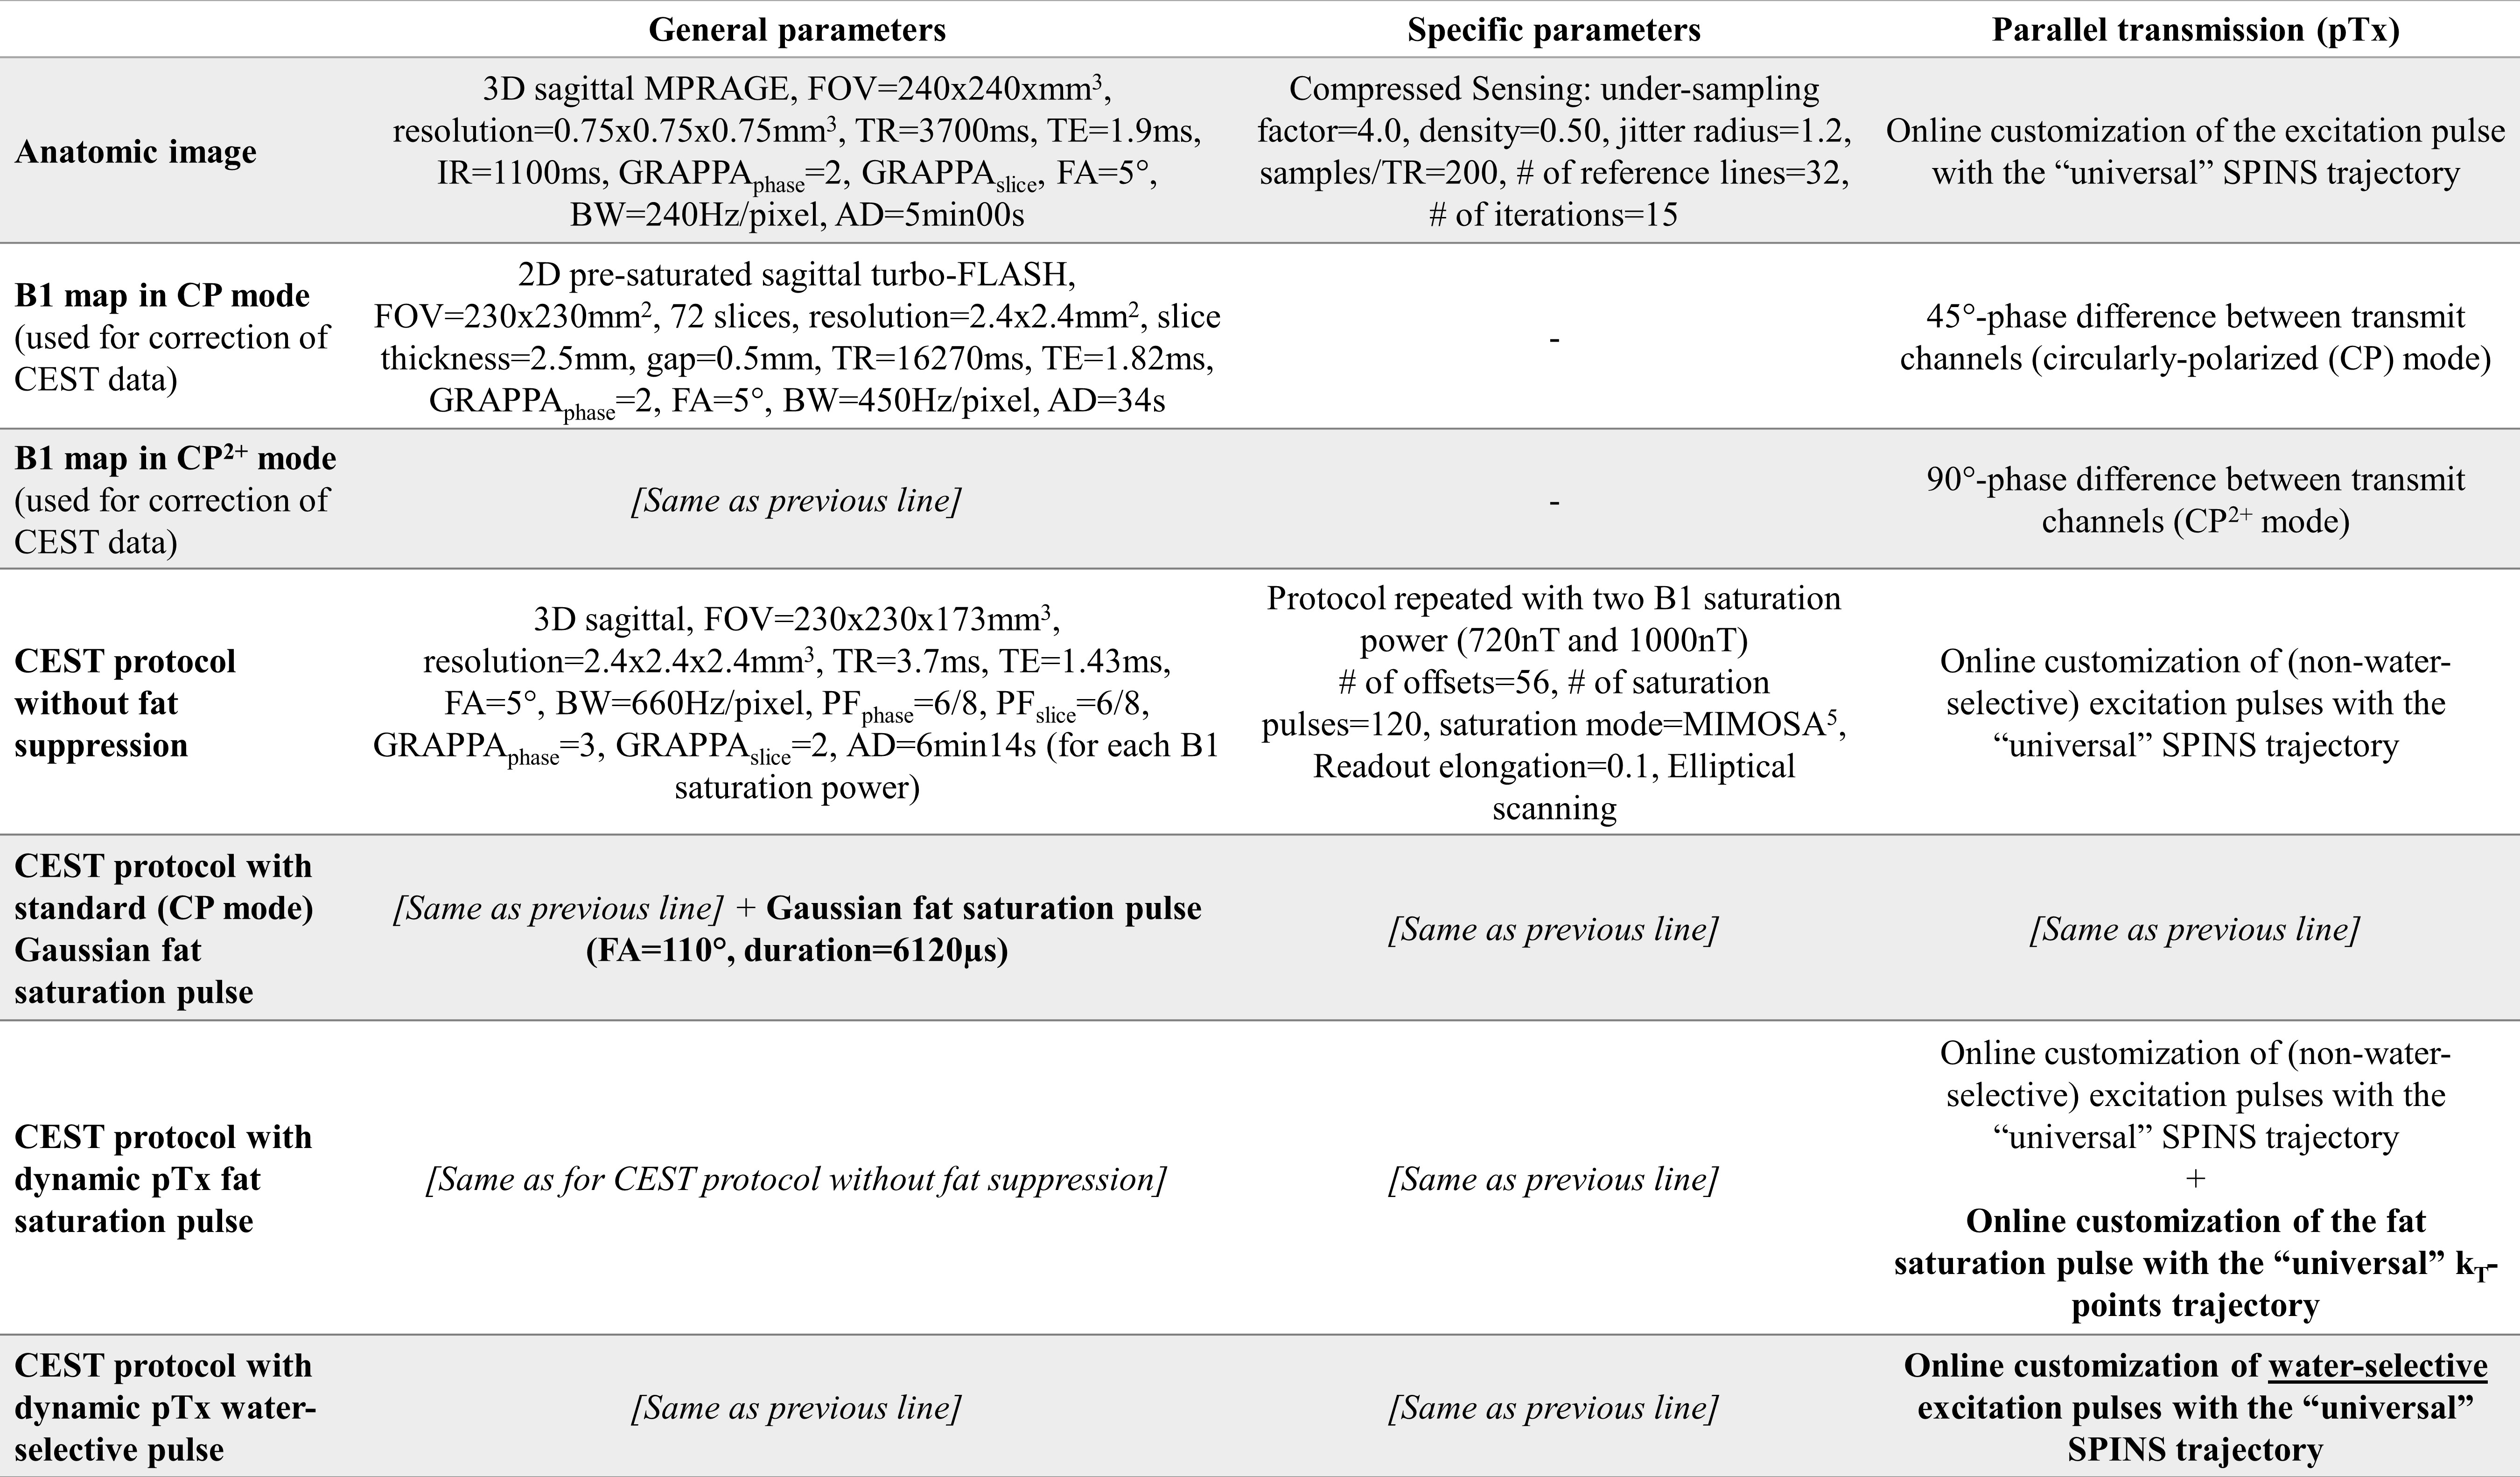
Pulse design.The initial CEST protocol4 consisted of a saturation module with two interleaved complimentary sets of phase difference between adjacent channels5 and a spiral-centric-reordered-square readout6 with online-customized pTx pulses based on a “universal” Spiral Non-Selective (SPINS) transmit trajectory7. This whole-brain protocol demonstrated an improved reproducibility4 (parameters in Fig.1).Two widely used fat suppression approaches were considered:
(1) Fat saturation pulse before the readout,
(2) Water-selective pulses in the readout.
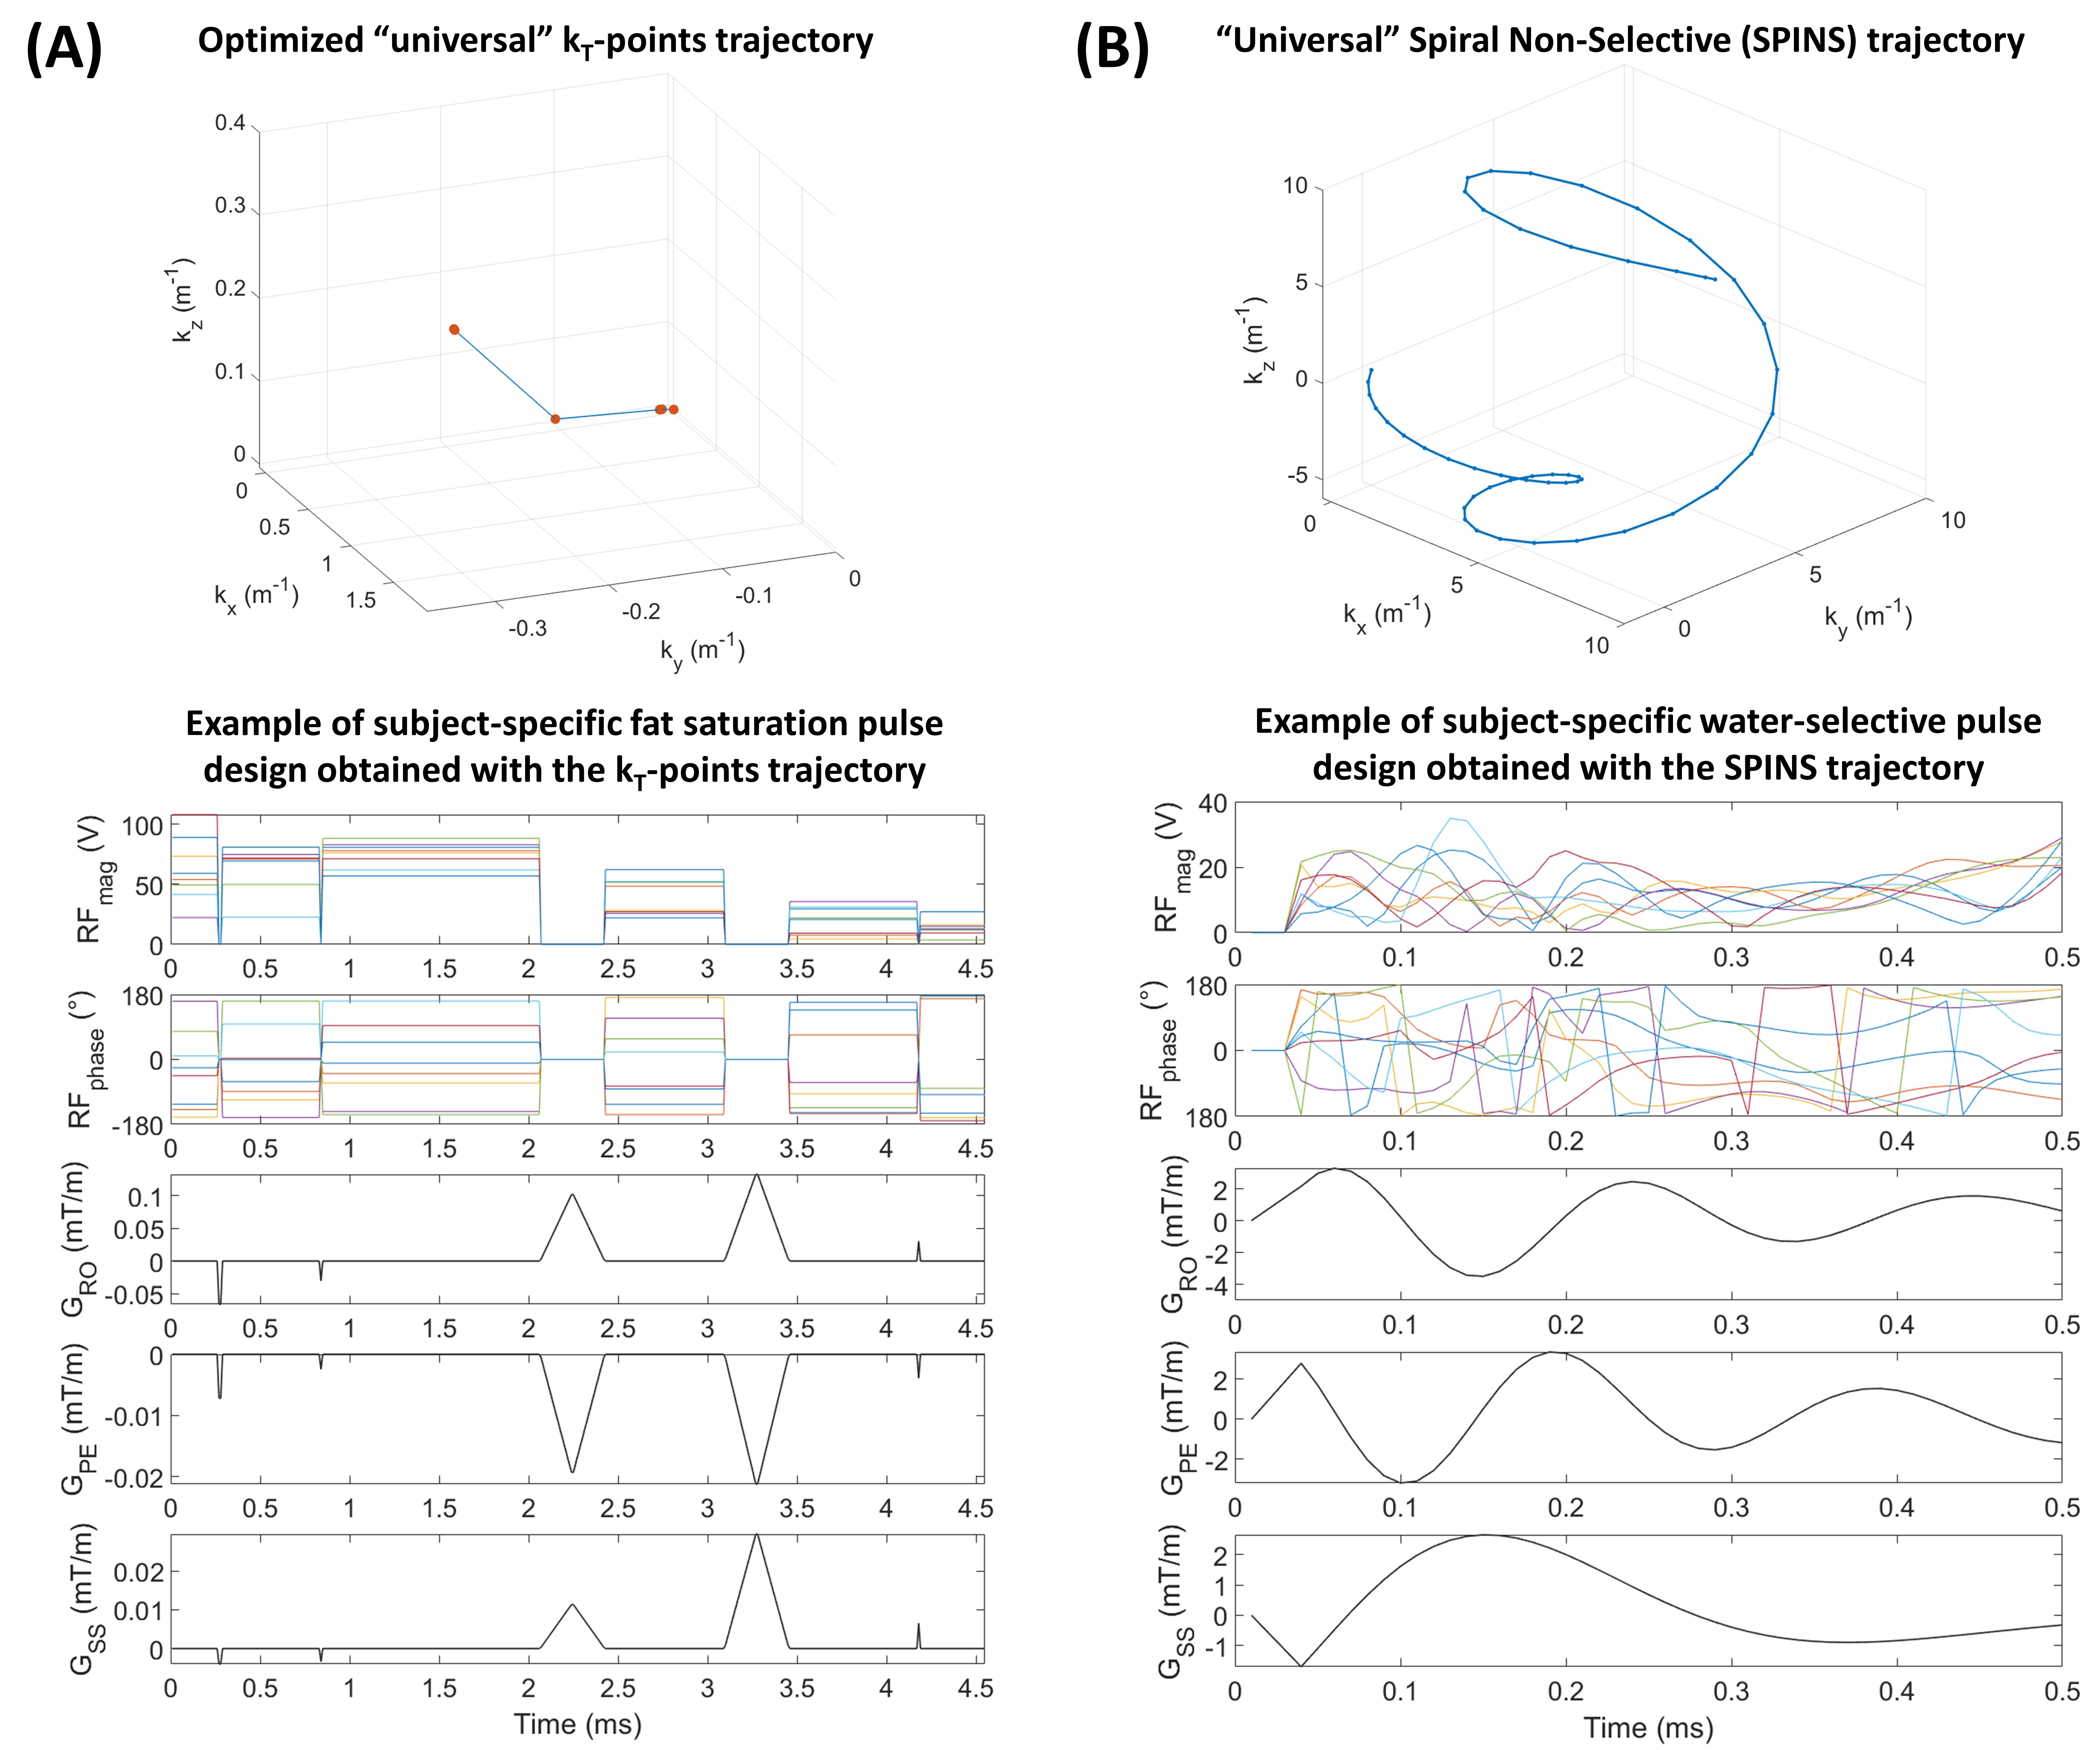
For approach (1), the standard approach was a circularly-polarized (CP) Gaussian pulse (FA=110°, duration=6120µs, frequency=-3.3ppm). It was compared to a dynamic pTx pulse based on a “universal”8 kT-points9 trajectory with a 25% shorter duration (4550µs) to reduce B0 sensitivity. The kT-points coordinates and sub-pulse durations were determined through a global search10 (Matlab 2017b, Mathworks, USA) minimizing the Root-Mean-Squared-Error (RMSE) on the resulting FA in a healthy population (10 women, 10 men, same as for the SPINS trajectory). Then, the pulse amplitude and phase were optimized at the acquisition based on the subject’s B0 and B1+ data with the determined kT-points (Fig.2-A). For this optimization, the maximum local Specific Energy Dose (SED, energy absorbed per mass of tissue, proportional to SAR) was limited to 75% of the Gaussian pulse SED and the FA RMSE in the brain was minimized with a target of 110° at -3.3ppm (main fat frequency) and 0° at 0ppm (water frequency).
For approach (2), the readout pulses were replaced by water-selective pulses with the same “universal” SPINS trajectory (Fig.2-B). The water-selectivity was achieved during the subject-specific optimization, with a target of 5° at 0ppm and 0° at -3.3ppm. The SED limit for this optimization was set so that the maximum local SED of the readout remained below 90% of the value for a readout with the CP fat saturation and the original non-water-selective pulses.
Acquisition.The experiments were performed on a 7T whole-body system (Terra, Siemens Healthcare, Erlangen, Germany) with an 8Tx/32Rx brain coil (Nova Medical). The protocol (Fig.1) was applied in 6 healthy volunteers (aged 40.3±8.3 y.o., 3 women) with the 4 strategies: no fat suppression, Gaussian fat saturation (CP mode), fat saturation with kT-points trajectory (pTx), water-selective pulses with SPINS trajectory (pTx). The subject-specific pTx optimizations did not add time to the protocol since they could be performed during the anatomic image acquisition.
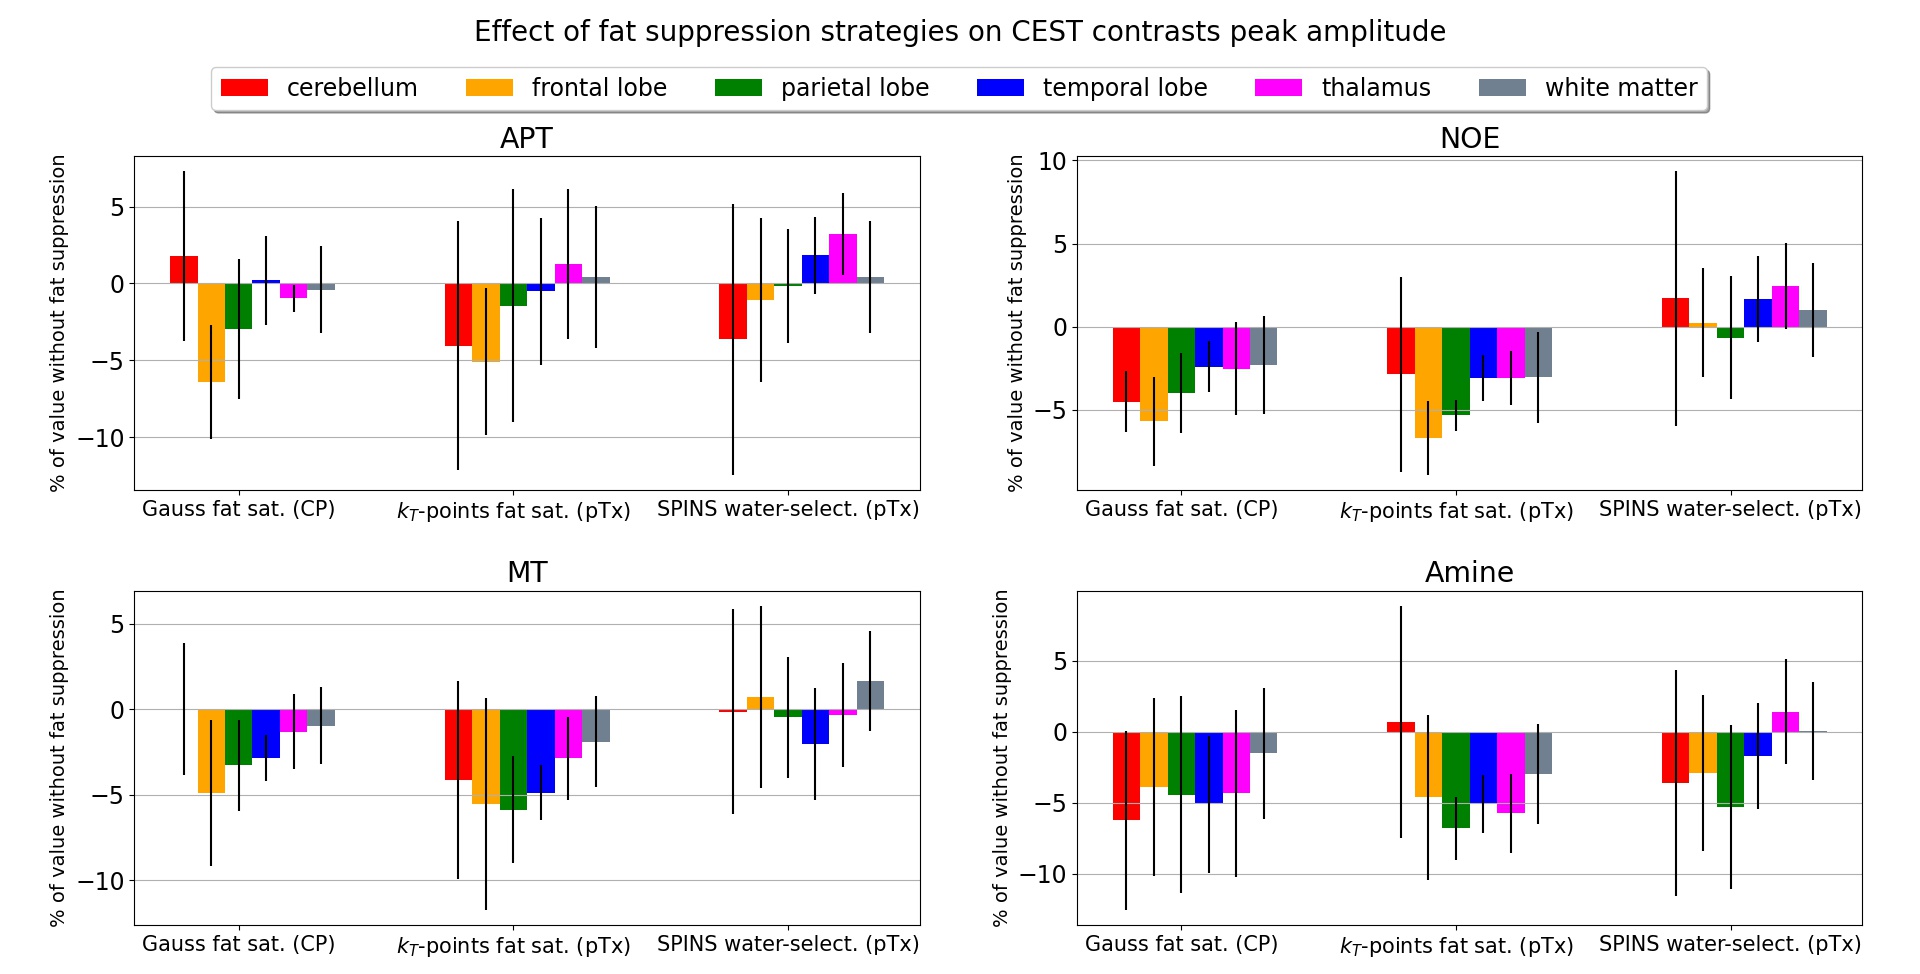
Analysis.The Amide Proton Transfer (APT), NOE, Magnetization-Transfer (MT) and Amine contrasts were calculated voxel-wise for each fat suppression strategy after temporal motion correction, B0 and B1+ correction11,12, denoising and 5-pool Lorentzian fitting12. These maps were registered to the MNI template and structural atlas13,14 using ANTs15 with an affine registration to the anatomic image before a non-linear registration of the anatomic image to the template. The differences in CEST contrasts with respect to the acquisition without fat suppression were quantified for each fat suppression strategy in different brain regions.
Results & Discussion
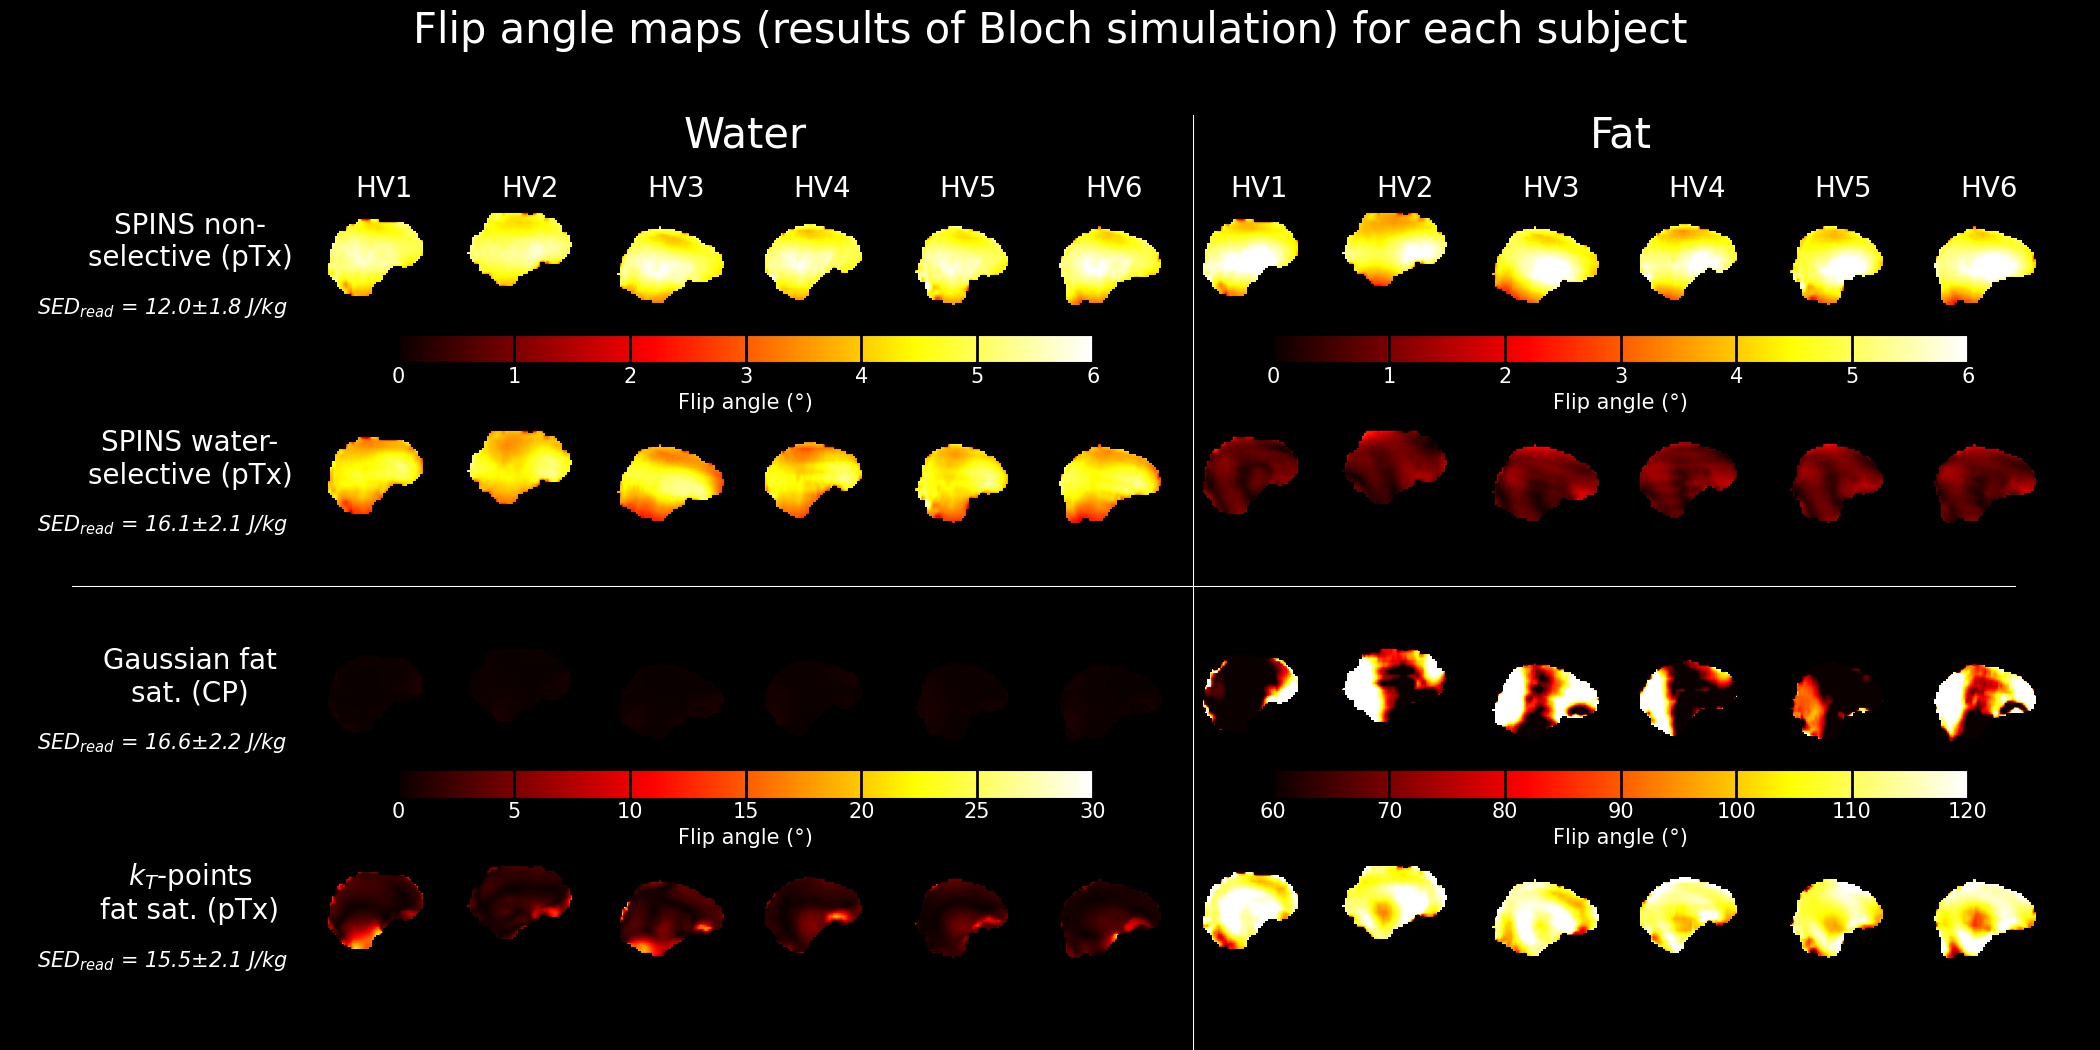
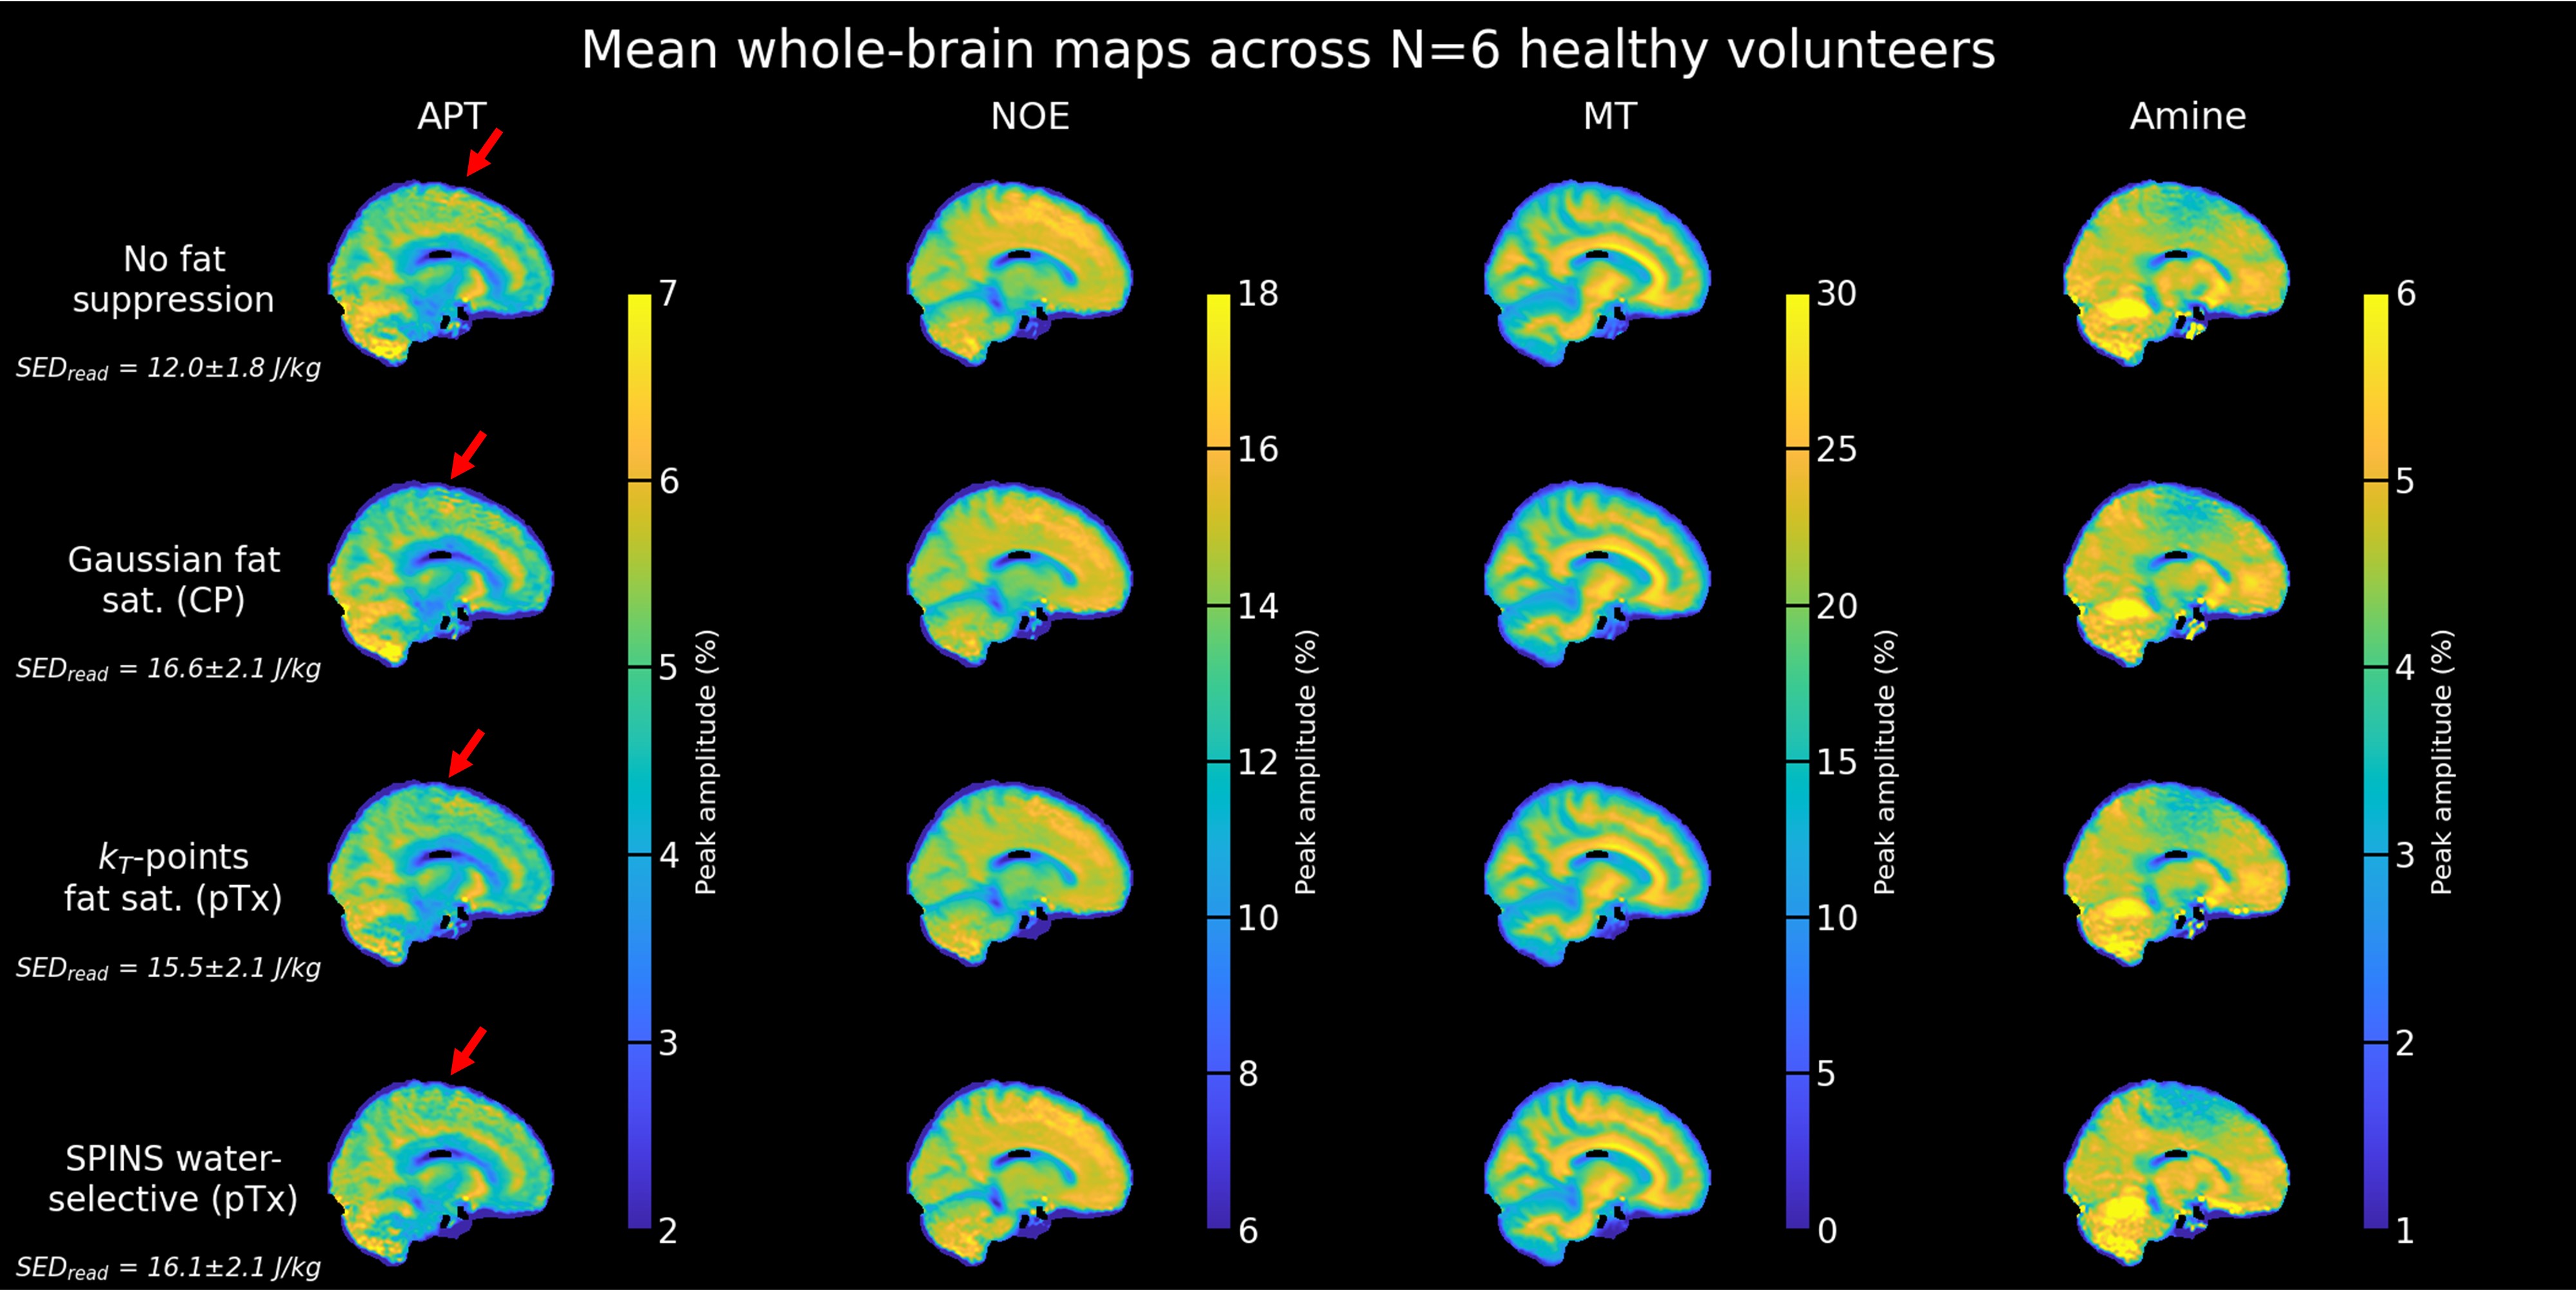
A successful design of water-selective pulses with reduced SED compared to the non-selective pulses was achieved (Fig.3), although performances were decreased in the lower brain at the water frequency (averaged normalized RMSE across subjects=22.6%, versus 10.1% for non-water-selective pulses). The fat saturation homogeneity was highly improved with pTx, compared to the CP mode. Additionally, the two pTx fat suppression approaches reduced the sequence energy deposition. Longer pulse duration might improve the spectral selectivity but might be sub-optimal for fast CEST imaging.No large difference between strategies were observed in the CEST maps (Fig.4), except for APT where ringing artifacts at the top of the brain (potentially due to the scalp fat) seemed removed with the pTx fat suppressions.
Regarding CEST contrasts values (e.g., MT), the improved homogeneity of the pTx fat saturation reflected in the cerebellum where the same trend as in other regions was retrieved (Fig.5). Given the reported repeatability of the protocol4, these differences are unlikely due to test-retest variability.
Conclusion & Perspectives
Homogeneous fat suppression with reduced energy deposition was obtained with individually optimized dynamic pTx pulses, in particular for fat saturation, compared to the standard CP approach. Future work will aim to implement those pulses for CEST MRI in other body regions (e.g., knee), where fat is more problematic.Acknowledgements
This work was supported by the emerging field initiative (project 4 Med 05 “MIRACLE”) of the Friedrich-Alexander University (FAU) Erlangen-Nürnberg.References
1. Lu, J., Zhou, J., Cai, C., Cai, S. & Chen, Z. Observation of true and pseudo NOE signals using CEST-MRI and CEST-MRS sequences with and without lipid suppression: Observation of True and Pseudo NOE Signals. Magn. Reson. Med. 73, 1615–1622 (2015).
2. Zhang, S. et al. Z‐spectrum appearance and interpretation in the presence of fat: Influence of acquisition parameters. Magn. Reson. Med. 79, 2731–2737 (2018).
3. Padormo, F., Beqiri, A., Hajnal, J. V. & Malik, S. J. Parallel transmission for ultrahigh-field imaging: Parallel Transmission for Ultrahigh-Field Imaging. NMR Biomed. 29, 1145–1161 (2016).
4. Liebert, A. et al. Whole‐brain quantitative CEST MRI at 7T using parallel transmission methods and correction. Magn. Reson. Med. 86, 346–362 (2021).
5. Liebert, A. et al. Multiple interleaved mode saturation (MIMOSA) for B1+ inhomogeneity mitigation in chemical exchange saturation transfer. Magn Reson Med 82, 693–705 (2019).
6. Zaiss, M., Ehses, P. & Scheffler, K. Snapshot-CEST: Optimizing spiral-centric-reordered gradient echo acquisition for fast and robust 3D CEST MRI at 9.4 T. NMR Biomed 31, e3879 (2018).
7. Herrler, J. et al. Fast online‐customized (FOCUS) parallel transmission pulses: A combination of universal pulses and individual optimization. Magn Reson Med 85, 3140–3153 (2021).
8. Gras, V., Vignaud, A., Amadon, A., Le Bihan, D. & Boulant, N. Universal pulses: A new concept for calibration-free parallel transmission: Calibration-Free Parallel Transmission. Magn. Reson. Med. 77, 635–643 (2017).
9. Cloos, M. A. et al. kT-points: Short three-dimensional tailored RF pulses for flip-angle homogenization over an extended volume. Magn. Reson. Med. 67, 72–80 (2012).
10. Ugray, Z. et al. Scatter Search and Local NLP Solvers: A Multistart Framework for Global Optimization. INFORMS Journal on Computing 19, 328–340 (2007).
11. Zaiß, M., Schmitt, B. & Bachert, P. Quantitative separation of CEST effect from magnetization transfer and spillover effects by Lorentzian-line-fit analysis of z-spectra. Journal of Magnetic Resonance 211, 149–155 (2011).
12. Windschuh, J. et al. Correction of B1-inhomogeneities for relaxation-compensated CEST imaging at 7 T: Correction of B1-Inhomogeneities for Relaxation-Compensated CEST Imaging at 7 T. NMR Biomed. 28, 529–537 (2015).
13. Mazziotta, J. et al. A probabilistic atlas and reference system for the human brain: International Consortium for Brain Mapping (ICBM). Phil. Trans. R. Soc. Lond. B 356, 1293–1322 (2001).
14. Mazziotta, J. et al. A Four-Dimensional Probabilistic Atlas of the Human Brain. Journal of the American Medical Informatics Association 8, 401–430 (2001).
15. Avants, B. B. et al. A reproducible evaluation of ANTs similarity metric performance in brain image registration. NeuroImage 54, 2033–2044 (2011).
Figures