0450
Interplay of Iron and Copper in the Neuromelanin-Related Paramagnetic Relaxation Enhancement1Max Planck Institute for Human Cognitive and Brain Sciences, Leipzig, Germany, 2Leipzig University, Faculty of Physics and Earth Sciences, Felix Bloch Institute for Solid State Physics, Leipzig, Germany, 3Department of Chemistry, University of Pavia, Pavia, Italy, 4Institute of Biomedical Technologies, National Research Council of Italy, Segrate, Italy
Synopsis
Neuromelanin-sensitive MRI receives interest as potential biomarker in neurodegenerative diseases, such as Parkinson’s and Alzheimer’s disease. It is known that human neuromelanin pigments bind large quantities of toxic metal ions, especially iron but also other transition metals including copper. These melanin-iron complexes are a potential source of paramagnetic relaxation enhancement of water proton. In relaxometry investigations, we found deviations from a simple linear concentration-dependent T1 shortening in synthetic neuromelanins containing different amounts of iron and copper. Knowledge of the occupation of distinct metal binding sites seems crucial for contrast optimization or attempts to quantify metal content by MRI.
Introduction
Imaging of neuromelanin (NM)-rich subcortical nuclei, in particular, substantia nigra (SN) and locus coeruleus (LC), gained increasing interest due to their role in neurodegenerative diseases (e.g. Parkinson’s disease).1-3 However, optimizing NM-associated contrast is hindered because underlying mechanisms remain unclear. The so-called “NM-MRI” is a T1-weighted technique assuming shortened water T1 due to metals bound to NM.2 The most abundant NM metal in SN and LC is iron.4 SN-NM binds more iron than LC-NM, whereas LC-NM’s copper content is higher.2,4 Previous studies also investigated magnetization-transfer in synthetic NM or T2 and T2*.3,5To gain further insight into NM-related relaxation, we investigated the rates R1, R2, R2* and magnetic susceptibility (Δχ) combined with EPR experiments in model systems with variation of iron and copper contents.
Methods
Sample preparation: Pheomelanin was synthesized by autoxidation of dopamine in presence of l-cysteine and different amounts of iron and copper.6 To mimic the protein moiety of NM pigment, β-lactoglobulin (βLG) was added (dopamine/βLG w/w ratio 1/2).6 Appropriate quantities (0.5 mg/ml) of the preparations were suspended in polyacrylamide with 10% (w/w) BSA. Susceptibility artifacts from air were minimized by adding polyacrylamide layers around the preparations (»3 ml) and filling the tubes with agarose. The samples were placed in a holder inside a cylindrical container with 1.5% low-melting agarose in PBS (phosphate buffered saline, pH 7.4) with 0.1% Magnevist. Small amounts (≈2-3 mg) of the same melanin preparations were examined by EPR as dry powders. Iron and copper contents in the preparations were obtained by inductively coupled plasma–optical emission spectrometry (ICP-OES).MRI: Relaxometry data was acquired on a MAGNETOM Prismafit (Siemens) using a 32-channel coil. An inversion-prepared TSE sequence was used to measure R1 (≈22 °C) with 33 inversion times between 25ms and 10s (TR=12s). R2 and R2* were measured by CPMG (32 echoes between 26ms and 832ms) and multi-echo (ME) GRE (24 echoes between 17ms and 408ms), respectively. Quantitative susceptibility mapping (QSM) was performed with ME-GRE on a MAGNETOM Skyra Connectom (32-channel coil; 1mm isotropic) and a processing pipeline detailed elsewhere.7-9 During all scans, the temperature increase was <4 K.
EPR: Spectra were recorded on an X-Band spectrometer (EMXmicro, Bruker) between room temperature and 10 K.
Results and Discussion
EPR: A sharp peak of the NM free radical appears at g=2.0 (Figure 1A). Consistent with previous studies,10 a high-spin Fe(III) signal with rhombic symmetry and large zero-field splitting is observed at geff≈4.3. Notably, the Cu(II) signal (geff=2.15) exhibits a splitting caused by non-negligible hyperfine interaction. Both signals showed the expected Curie behavior leading to a smaller magnitude at elevated temperature (Figure 1B). At room temperature, another broad signal component is visible, assigned to Fe(III) in an antiferromagnetic domain.10,11 This confirms two iron sites in NM, a mononuclear center and a multinuclear cluster (small oxy-hydroxy aggregates).12 We assign the broad contribution (pronounced at high iron content) to the multinuclear cluster, which is supported by comparing the narrow iron signal’ intensity (at 10K) and the metal analysis demonstrating an increasing deviation for high iron load (Figure 2A). Consistently, most iron was previously assigned to paramagnetic mononuclear Fe(III) for pheomelanin-BSA conjugates with up to approximately 5µg/mg iron.14QSM: Considering quenching of the orbital angular momentum, we expect a positive shift of Δχ (compared to the metal-free sample) that scales—to first approximation—with the metals’ contents and effective magnetic moments. Remarkably, two linear regimes are observed upon variation of the iron and copper contents: Up to a critical loading, a linear increase is found with increasing metal content, which is inverted after this point (Figure 3B). This would be consistent with a preferred occupation of the mononuclear center at low metal concentrations, followed by increasing iron clustering on the multinuclear site. Consistently, recent magnetometry investigations of synthetic melanin found a trend towards lowering of the effective moment per Fe(III) at high loading.11
Relaxometry: Figure 4A demonstrates that there is no simple relation between relaxation enhancement and total metal content. Hence, changes in R1 alone poorly predict metal loading. By estimating (relative) amounts of mononuclear iron and copper from corresponding EPR signals at 10 K (Figure 4A), an estimate of Fe(III) stored in multinuclear clusters was extracted. It demonstrates a (counterintuitive) linear decrease of the R1 relaxivity (Figure 4B), resembling the QSM result of a reduced moment per Fe(III) with increasing storage in antiferromagnetic clusters.11 Linear regimes with increasing R2 and R2* at lower metal loading (Figure 5) further corroborate this interpretation. Note that R2 and R2* rather indicate a plateau than a clear indication of a decreased relaxivity at high metal content.
Conclusion
Previously suggested “NM-MRI” may lead to invalid conclusions about metal stored in NM because multivariate contributions (mononuclear/clustered) lead to two relaxivity regimes. Multiparametric investigations integrating R1, R2*, and QSM in a single sequence10 may, thus, be advantageous because of distinct sensitivities of these parameters to the two regimes. While our results cannot unambiguously identify the (currently unknown) Cu(II) centers, they are consistent with the assumption that both metals occupy the same or vicinal sites. Our results may further contribute to optimizing NM-sensitive MRI with potential impact in investigations of neurodegenerative diseases.Acknowledgements
No acknowledgement found.References
1. Möller HE, Bossoni L, Connor JR, et al. Iron, myelin, and the brain: Neuroimaging meets neurobiology. Trends Neurosci. 2019; 42: 384–401.
2. Sulzer D, Cassidy C, Horga G, et al. Neuromelanin detection by magnetic resonance imaging (MRI) and its promise as a biomarker for Parkinson's disease. NPJ Parkinson’s Dis. 2018; 4: 11.
3. Priovoulos N, van Boxel SCJ, Jacobs HIL, et al. (2020). Unraveling the contributions to the neuromelanin-MRI contrast. Brain Struct Funct. 2020; 225: 2757–2774.
4. Zecca L, Stroppolo A, Gatti A, et al. (2004). The role of iron and copper molecules in the neuronal vulnerability of locus coeruleus and substantia nigra during aging. Proc Natl Acad Sci USA 2004; 101: 9843–9848.
5. Trujillo P, Summers PE, Ferrari E, et al. Contrast mechanisms associated with neuromelanin-MRI. Magn Reson Med. 2017; 78: 1790–1800.
6. Ferrari E, Capucciati A, Prada I, et al. Synthesis, structure characterization, and evaluation in microglia cultures of neuromelanin analogues suitable for modeling Parkinson’s disease. ACS Chem Neurosci. 2017; 8: 501–512.
7. Bilgic B, Polimeni JR, Wald LL, et al. Automated tissue phase and QSM estimation from multichannel data. Proceedings of the 24th Annual Meeting of ISMRM. Singapore 2016; 2849.
8. Özbay PS, Deistung A, Feng X, et al. A comprehensive numerical analysis of background phase correction with V-SHARP. NMR Biomed. 2017;30(4):e3550.
9. Li W, Wang N, Yu F, et al. A method for estimating and removing streaking artifacts in quantitative susceptibility mapping. NeuroImage. 2015;108:111-122.
10. Aime S, Bergamasco B, Biglino D, et al. EPR investigations of the iron domain in neuromelanin. Biochim Biophys Acta. 1997; 1361: 49–58.
11. Li Y, Xie Y, Wang Z, et al. Structure and function of iron-loaded synthetic melanin. ASC Nano. 2016; 10: 10186–10194.
12. Zucca FA, Segura-Aguilar J, Ferrari E, et al. Interactions of iron, dopamine and neuromelanin pathways in brain aging and Parkinson’s disease. Prog Neurobiol. 2017; 155: 96–119.
13. Metere R, Kober T, Möller HE, Schäfer A. Simultaneous quantitative MRI mapping of T1, T2* and magnetic susceptibility with multi-echo MP2RAGE. PLoS ONE 2017; 12: e0169265.
14. Ferrari E, Engelen E, Monzoni E, et al. Synthesis and structural characterization of soluble neuromelanin analogs provides important clues to its biosynthesis. J Biol Inorg Chem. 2013; 18: 81-93.
Figures
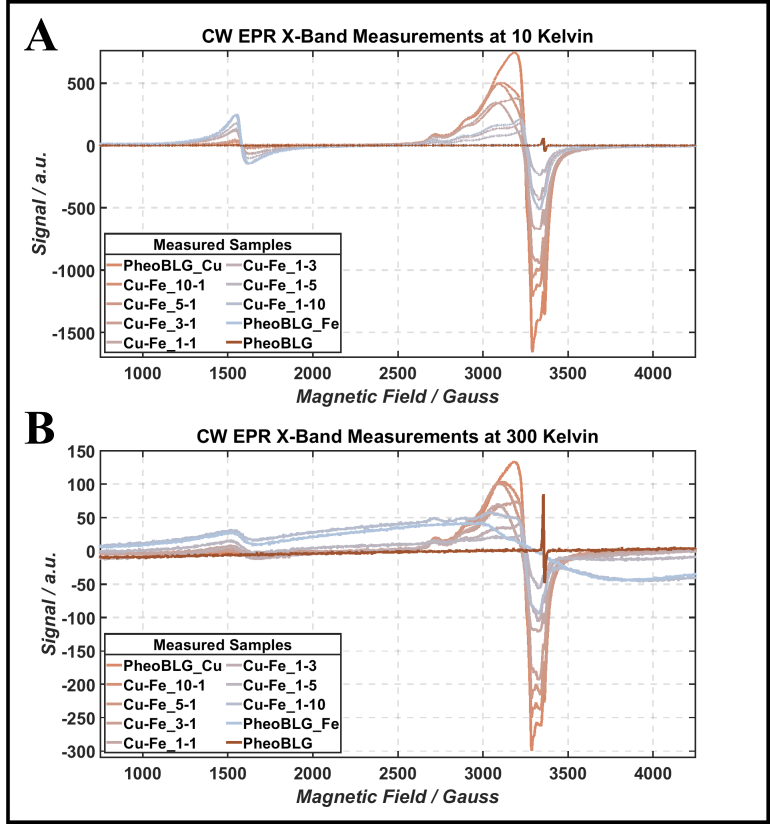
Figure 1: Comparison of continuous-wave X-band EPR spectra at 10 K (A) and room temperature (B). Distinct temperature-dependent behavior of the signal amplitudes of paramagnetic contribution associated with copper (S=1/2 at g≈2.15) and iron (S=5/2 at g≈4.3) in contrast to the broad antiferromagnetically coupled iron signal is visible.
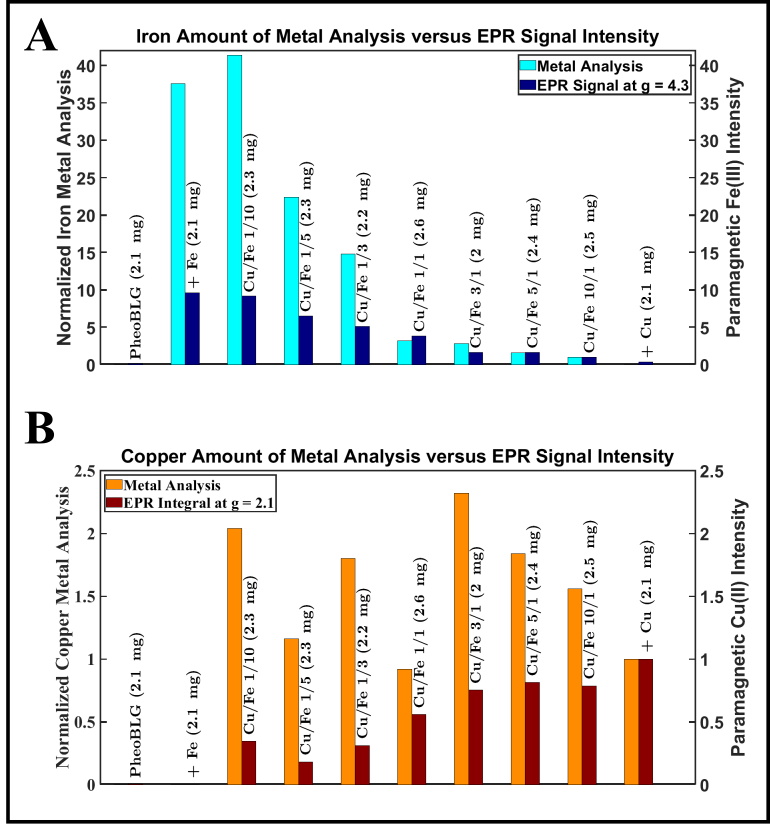
Figure 2: Results of EPR signal analysis at 10 K in comparison with this from ICP-OES metal analysis for iron (A) and copper (B). For normalization of iron levels, the sample with the smallest quantity (“Cu/Fe 10/1”) was chosen as a reference whereas for normalization of copper levels, the sample containing only copper but no iron was chosen as a reference.
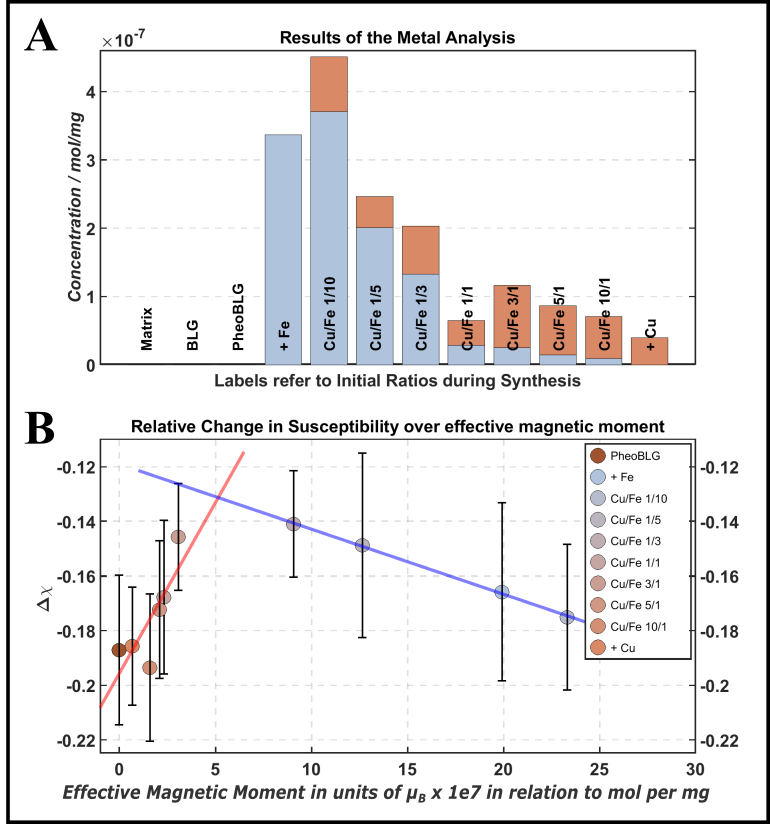
Figure 3: Results from ICP-OES metal analysis (A) and QSM (B). Using concentrations obtained from the metal analysis, first-order estimates of the expected effective magnetic moment were derived with the spin-only formula. Remarkably, the paramagnetic shift up is observed up to a critical point, after which the behavior is reversed.
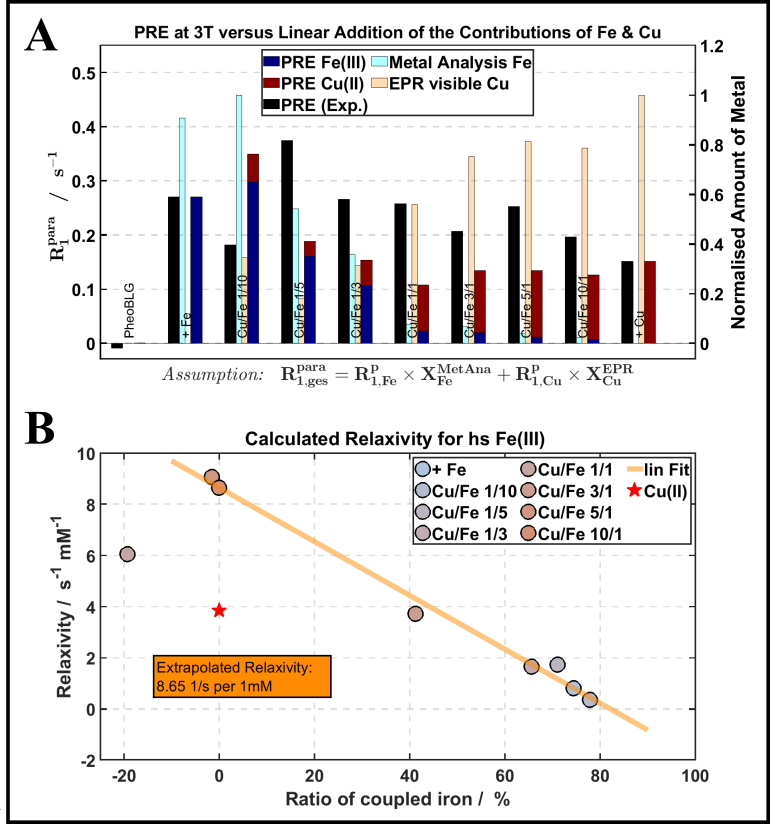
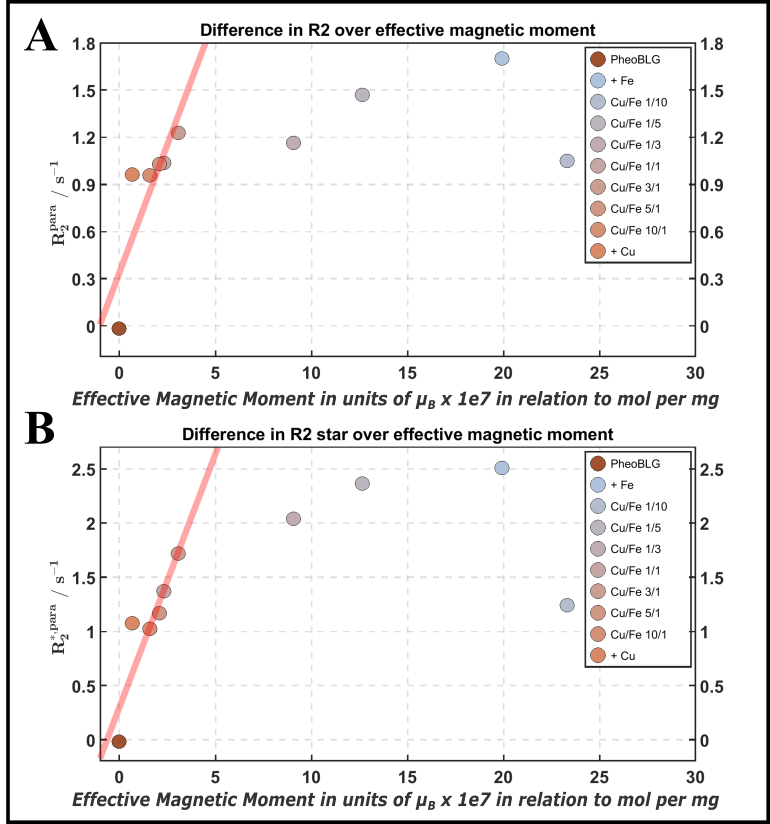
Figure 5: Relaxation R2 (A) and R2* (B) as a function of first-order estimates of the expected effective magnetic moment derived with the spin-only formula. Linear increases with increasing magnetic moment towards a plateau are observed.